Stop!Loss|Market View: GOLD🙌 Stop!Loss team welcomes you❗️
In this post, we're going to talk about the near-term outlook for GOLD ☝️
Potential trade setup:
🔔Entry level: 3995.914
💰TP: 3646.967
⛔️SL: 4195.976
"Market View" - a brief analysis of trading instruments, covering the most important aspects of the FOREX market.
👇 In the comments 👇 you can type the trading instrument you'd like to analyze, and we'll talk about it in our next posts.
💬 Description: The current accumulation of 4005 - 4143 has formed the basis for a further decline toward 3600 - 3700. Two sell scenarios are being looked for, the more likely of which involves a potential trade on a breakout of the lower border. An alternative scenario involves the formation of a false breakout at the upper border of this accumulation.
Thanks for your support 🚀
Profits for all ✅
❗️ Updates on this idea can be found below 👇
DXY

DXY FRGNT Daily Forecast -Q4 | W43 | D2| Y25 |
📅 Q4 | W43 | D2| Y25 |
📊 DXY FRGNT Daily Forecast
🔍 Analysis Approach:
I’m applying Smart Money Concepts, focusing on:
Identifying Points of Interest on the Higher Time Frames (HTFs) 🕰️
Using those POIs to define a clear trading range 📐
Refining those zones on Lower Time Frames (LTFs) 🔎
Waiting for a Break of Structure (BoS) for confirmation ✅
This method allows me to stay precise, disciplined, and aligned with the market narrative, rather than chasing price.
💡 My Motto:
"Capital management, discipline, and consistency in your trading edge."
A positive risk-to-reward ratio, paired with a high win rate, is the backbone of any solid trading plan 📈🔐
⚠️ Losses?
They’re part of the mathematical game of trading 🎲
They don’t define you — they’re necessary, they happen, and we move forward 📊➡️
🙏 I appreciate you taking the time to review my Daily Forecast.
Stay sharp, stay consistent, and protect your capital
— FRNGT 🚀
TVC:DXY

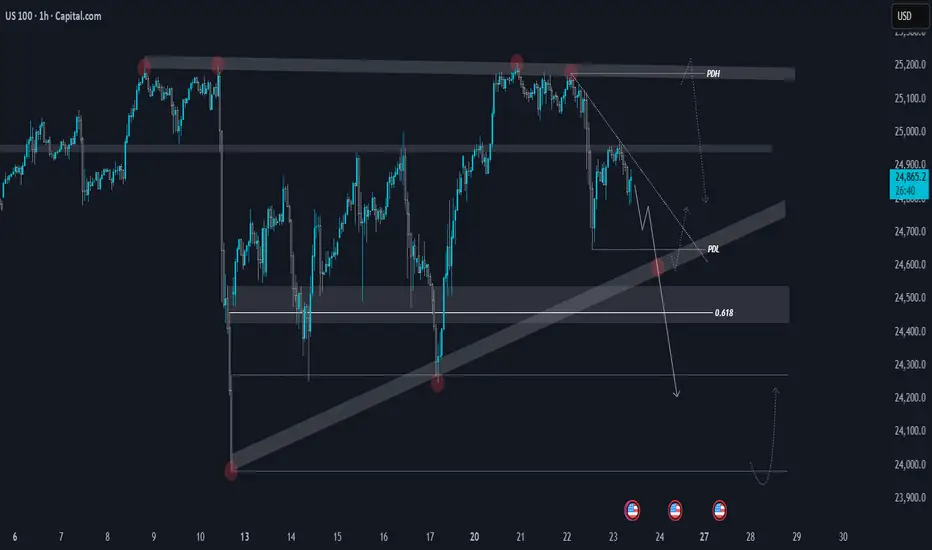
NASDAQ | Daily TF - Bearish Divergence with Double TopCAPITALCOM:US100 NASDAQ continues to hold a bearish tone on the 1-hour chart, with a clear bearish divergence confirming weakness in momentum. Price is respecting lower highs and lower lows, keeping the short-term structure bearish.
On the 4H timeframe, the index is approaching the trendline support around 24,600, which marks the third touch of this level. If this zone fails to hold, we could see an extended move toward the 24,000 area.
From a broader view, the daily chart shows a double top pattern along with a strong bearish divergence — both supporting a deeper pullback. However, a daily close above 25,220 would invalidate this view and could shift momentum back to the upside.
📰 With the ongoing U.S. government shutdown and heightened market uncertainty, sentiment remains mixed. Volatility is expected to stay elevated, so it’s best to wait for clear confirmation around key levels before taking any positions.
NO TRADE ZONE FOR GOLD!!!I was Looking for price to proceed with being bullish but it decided to breakdown. I'm not ready to buy again just yet. Need to see a full sweep on levels first. I think im going to sit on hands for the rest of the week.

US DOLLAR AnalysisRespect the Higher Low: The Quiet Power of an Uptrend
U.S. Dollar Index (DXY) | 23 Oct 2025 | Pre–New York Session Outlook
By Daniel Fadeley
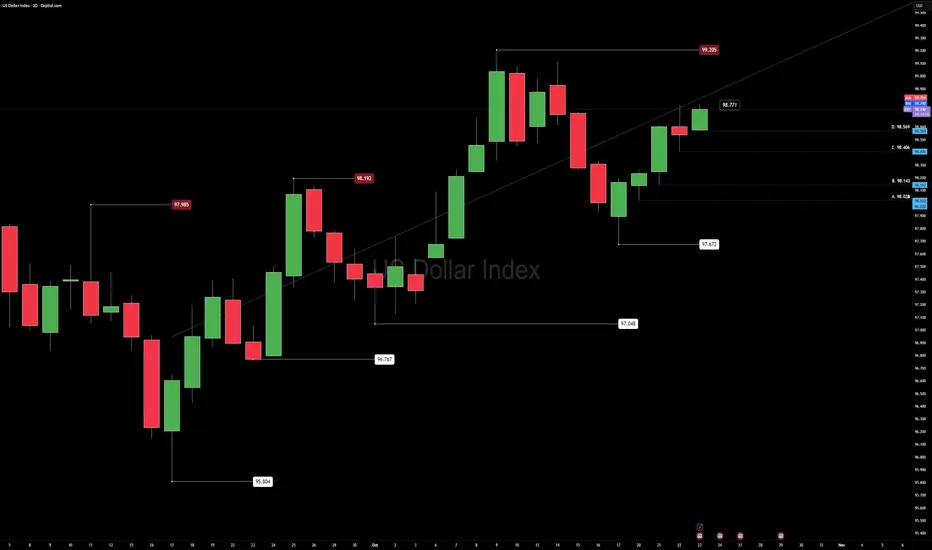
The U.S. Dollar continues to show a bullish bias, with higher lows forming consistently across both the weekly and daily structure. This ongoing strength keeps the broader tone positive for USD, while EURUSD and GBPUSD remain under cross-asset pressure.
We’re currently operating inside a bullish range with 97.672 as the range low and 99.205 as the range high.
Context
Momentum favors the dollar as buyers continue defending each pullback. If this month’s bullish structure holds, the market could confirm a longer-term upward phase.
However, conditions are slightly extended on Fibonacci sequence levels, suggesting reduced reward-to-risk for new swing positions until a clean retest offers better value.
Technical Map
Price took out yesterday’s high (98.771) and approaches the range ceiling at 99.205.
Volatility remains elevated through the week, and intraday momentum supports buy-the-dip behavior while daily lows continue to hold.
For cross-assets, this structure implies ongoing pressure on major USD pairs while the dollar holds above recent higher lows.
Fundamental Outlook
The week ahead features several key macro events:
U.S. GDP advance data
Core PCE inflation release
Multiple Federal Reserve speakers
Ongoing U.S. government funding discussions
Impact lens:
Yields rising → typically strengthens USD and tightens global liquidity.
Yields easing → can relieve pressure on risk assets such as equities and crypto.
Liquidity trends show ETF inflows slowing and capital rotating defensively, consistent with cautious macro positioning.
Plan
Current outlook remains bullish within range, focusing on position trades from defended lows and short-term rotational setups during volatility spikes.
Patience near 99.205 is key — a clean breakout with retest would confirm continuation; failure there could mean another controlled rotation inside the range.
Mindset
“Structure builds confidence. Clarity builds control.”
In fast markets, the goal is not prediction but preparation — follow structure, protect capital, and let confirmation lead conviction.
Educational use only — not financial advice.
Follow @CORE5DAN for calm, data-driven analysis and weekly structure lessons.
— CORE5DAN
Institutional Logic. Modern Technology. Real Freedom.
DXY Forming a Strong Base – Reversal Ahead?U.S. Dollar Index TVC:DXY – Daily Analysis
After a long downtrend, the Dollar Index seems to be forming a strong base at the bottom, as highlighted by multiple bounces from the same support zone. This area has been acting as a reliable floor, preventing further downside.
Currently, the price has also broken above the descending trendline, showing early signs of strength. If the price holds above this breakout, we could see a move toward the 100–101 zone, which is the next key resistance area.
However, if the price dips back below the trendline, a retest of the base zone near 97.00 could take place before any potential continuation higher.
Summary: DXY is showing a potential reversal structure. A sustained move above the trendline could confirm the start of a stronger bullish phase.
DYOR, NFA
Thanks for reading! Appreciate your support and engagement 🙏

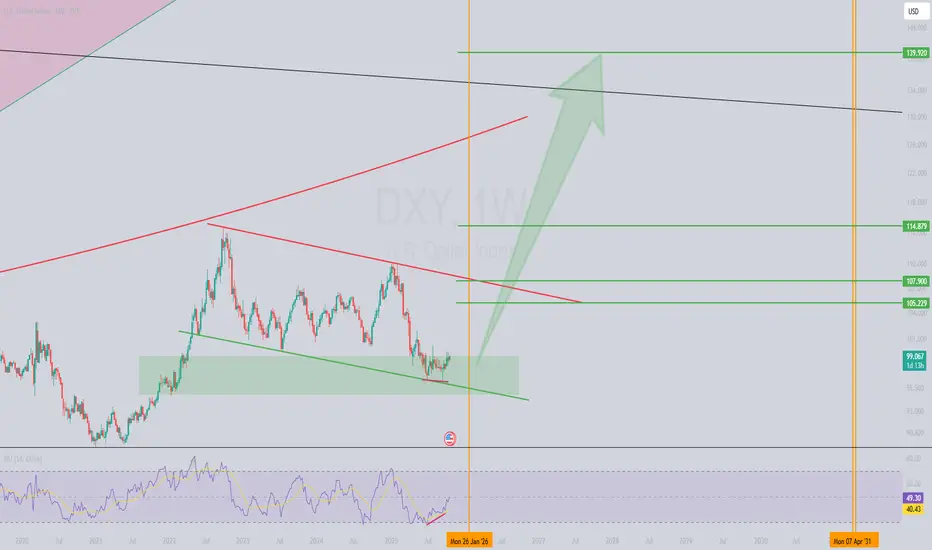
DXY: Bullish Setup Brewing at Key Weekly Support!The US Dollar Index (DXY) is showing a compelling setup on the weekly timeframe! 📈 The price has reached a critical support zone between 99.120 and 94.802. This level also aligns with the lower boundary of a descending channel, adding confluence to this high-probability zone.
🔍 Key Technical Observations:
Bullish Divergence: A clear bullish divergence has formed between the price and the RSI indicator, signaling potential exhaustion of sellers and a possible trend reversal.
Channel Support: The price is testing the lower trendline of the descending channel, a spot where buyers have stepped in before.
Support Zone: The 99.120–94.802 range is a high-value area for accumulation, making it a prime spot for a bounce.
📡 What’s Next?Technically, the DXY looks poised for a bullish reversal. However, global macroeconomic events and fundamental news (like Fed decisions or geopolitical developments) will play a crucial role in confirming this move. Keep an eye on upcoming economic data releases! 📅
What do you think of this setup? Are you bullish on DXY, or waiting for more confirmation? Drop your thoughts below! 👇
EUR/USD – Outlook (2H Chart)Scenario 1 – Bullish Correction (Preferred):
Market completed a 5-wave impulsive drop.
Price is now testing the 1.1580–1.1595 demand zone (Wave-B area).
If this zone holds, we expect a corrective wave-C rally toward 1.1638 – 1.1680.
Structure: (1-2-3-4-5) down → (A-B-C) up.
📈 Expectation: Short-term bullish retracement before next major move.
🟢 Confirmation: 1-hour candle close above 1.1600.
---
Scenario 2 – Bearish Continuation:
If price breaks below 1.1575, buyers lose control.
Market can extend deeper toward the 1.1545 – 1.1550 zone.
That would complete a larger Wave-5 extension before new correction begins.
📉 Expectation: Short-term selling continuation before trend reversal.
🔴 Invalidation for bulls: 1.1570 break and retest.
---
Summary:
The pair stands at a critical decision zone.
Hold = wave-C bounce 📈
Break = deeper drop to support 📉
---

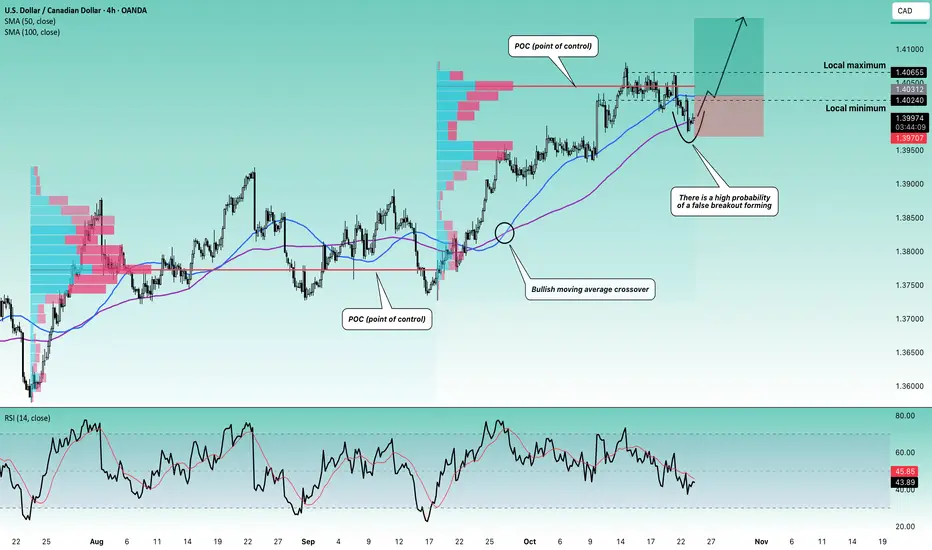
Stop!Loss|Market View: USDCAD🙌 Stop!Loss team welcomes you❗️
In this post, we're going to talk about the near-term outlook for the USDCAD currency pair☝️
Potential trade setup:
🔔Entry level: 1.40312
💰TP: 1.41455
⛔️SL: 1.39707
"Market View" - a brief analysis of trading instruments, covering the most important aspects of the FOREX market.
👇 In the comments 👇 you can type the trading instrument you'd like to analyze, and we'll talk about it in our next posts.
💬 Description: The focus on the accumulation area of 1.40240 - 1.40655 remains despite the breakout of its lower border. We are currently most likely observing the formation of a false breakout. The main scenario is the price closing above 1.40240 again, thereby forming a false breakout. Buy trades towards 1.41000 and 1.42000 can be actively looked for in this case. A more conservative option is to look for a buy trade via a breakout of the upper border of 1.40655.
Thanks for your support 🚀
Profits for all ✅
❗️ Updates on this idea can be found below 👇
Stop!Loss|Market View: GBPUSD🙌 Stop!Loss team welcomes you❗️
In this post, we're going to talk about the near-term outlook for the GBPUSD currency pair☝️
Potential trade setup:
🔔Entry level: 1.33425
💰TP: 1.32176
⛔️SL: 1.34167
"Market View" - a brief analysis of trading instruments, covering the most important aspects of the FOREX market.
👇 In the comments 👇 you can type the trading instrument you'd like to analyze, and we'll talk about it in our next posts.
💬 Description: For the pound, sell priorities are still in place. A retest of the 1.32870 support area is expected here in the near future. Sell trade is looked for from current prices (as the primary scenario), but manipulation (a false breakout) should be expected in the event of a further retest of the 1.34500 resistance area, after which a sell should be looked for again at more favorable prices. The 1.30000 level is considered a medium-term target.
Thanks for your support 🚀
Profits for all ✅
❗️ Updates on this idea can be found below 👇

USD/JPY – Buy Entry (H1- Channel Breakout Pattern)
The USD/JPY Pair, Price has been trading within a Channel Breakout Pattern on the H1 chart, forming consistent higher highs and higher lows. Price action is now testing the upper boundary of the Pattern, signalling a possible breakout. FX:USDJPY
✅Market Context:
1️⃣Strong Upward Structure Inside the Pattern.
2️⃣Buyers are showing strength near Resistance.
3️⃣Breakout above the Trendline indicates Momentum continuation toward higher zones.
✅Trade Plan:
Entry: Buy after Confirmed Breakout above the Resistance (H1 candle close above trendline or retest of the breakout).
💰Take Profit (TP): At the Key Zone – a Major Resistance area identified ahead.
🛑Stop Loss (SL): Below the Pattern Structure.
✅Psychological Discipline :
1️⃣Stick to plan – No Revenge Trades.
2️⃣Accept losing trades as Part of the Strategy.
3️⃣Risk only 1–2% of your account balance per trade.
💬 Support the community: If you found this useful, drop a 👍 like and share your thoughts in the comments!
⚠️ Disclaimer: This analysis is for educational purposes only and does not constitute financial advice. Forex trading involves high risk. Trade only with capital you can afford to lose and always do your own research.

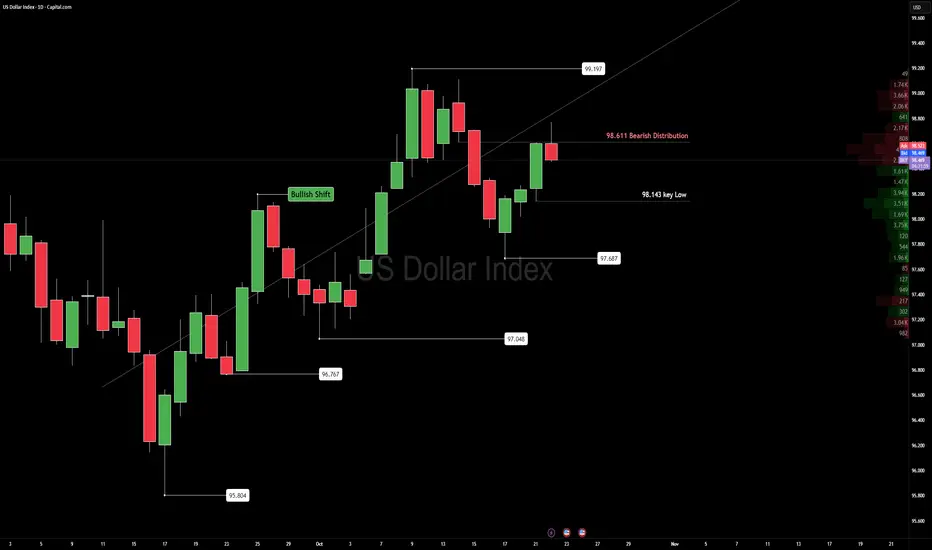
DXY UpdateDXY — Reaction at 98.611 Distribution Zone
The U.S. Dollar Index met firm resistance near 98.611, the same Bearish distribution area that capped momentum last week.
Price remains inside a wide daily range but shows the first sign of cooling after a strong stretch higher.
Below sits 98.143, the line that that changes chart bearish. Until then We are still good.
Acceptance under that level would confirm a structure shift and open space for continued rotation lower.
Upcoming jobless claims and Fed remarks may decide which side gains conviction.
For now, this is a market balancing inventory — not trending, just redistributing.
Trade confirmation, not anticipation.
Key levels:
98.611 — Distribution cap
98.143 — Structural pivot
— Institutional Logic. Modern Technology. Real Freedom.
EURUSDHello Traders! 👋
What are your thoughts on EURUSD?
EUR/USD has broken its ascending trendline and completed a pullback to the broken level.
The pair is now trading below a key resistance zone, showing continued signs of bearish pressure.
After some short-term consolidation in this area, the price is expected to continue its decline toward the highlighted support level.
As long as the price remains below the resistance zone, the downside scenario remains valid.
A confirmed daily close above resistance would invalidate this bearish setup.
Don’t forget to like and share your thoughts in the comments! ❤️

Mid week forecast: GOLD,EURUSD,GBPUSDHello traders, this is a complete multiple timeframe analysis of this pair. We see could find significant trading opportunities as per analysis upon price action confirmation we may take this trade. Smash the like button if you find value in this analysis and drop a comment if you have any questions or let me know which pair to cover in my next analysis.

GBP/USD – Sell Entry (H1 – Channel Pattern)
The GBP/USD Pair, Price has been trading within a Channel Pattern on the H1 chart, forming consistent lower highs and lower lows. Price action is now testing the lower boundary of the pattern, signalling a possible breakdown.
✅Market Context:
1️⃣Downward structure building inside the pattern.
2️⃣Sellers are showing strength near support levels.
3️⃣Breakdown below the trendline indicates momentum continuation toward lower zones.
✅Trade Plan:
Entry: Sell after confirmed breakdown below the support (Candle close below trendline or retest of the breakout).
💰Take Profit (TP): At the Key Zone – major support area identified ahead.
🛑Stop Loss (SL): Above the pattern structure / recent swing high.
✅Psychological Discipline:
1️⃣Stick to plan – No Revenge Trades.
2️⃣Accept losing trades as part of the strategy.
3️⃣Risk only 1–2% of your account balance per trade.
💬 Support the community: If you found this useful, drop a 👍 like and share your thoughts in the comments!
⚠️ Disclaimer: This analysis is for educational purposes only and does not constitute financial advice. Forex trading involves high risk. Trade only with capital you can afford to lose and always do your own research.

Stop!Loss|Market View: SILVER🙌 Stop!Loss team welcomes you❗️
In this post, we're going to talk about the near-term outlook for SILVER ☝️
Potential trade setup:
🔔Entry level: 46.91212
💰TP: 41.26205
⛔️SL: 50.07903
"Market View" - a brief analysis of trading instruments, covering the most important aspects of the FOREX market.
👇 In the comments 👇 you can type the trading instrument you'd like to analyze, and we'll talk about it in our next posts.
💬 Description: Metals have fixed intraday decline records early this week. For now, the likelihood of continued declines is higher, and a reversal is more likely. A strong factor for continued declines in silver would be the formation of an accumulation between levels 47 and 48. In this case, a drop to level 38 could be expected. The declines in metals are explained with profit-taking, thereby strengthening the USD.
Thanks for your support 🚀
Profits for all ✅
❗️ Updates on this idea can be found below 👇

eurgbp looking bullish over all trend is up and now breaking bullish pennant consolidation towards upside, successful breakout can lead 120 pips bullish wave, keep in mind that we need breakout, without breakout there is no entry

Stop!Loss|Market View: GOLD🙌 Stop!Loss team welcomes you❗️
In this post, we're going to talk about the near-term outlook for GOLD ☝️
Potential trade setup:
🔔Entry level: 4330.320
💰TP: 4023.981
⛔️SL: 4544.296
"Market View" - a brief analysis of trading instruments, covering the most important aspects of the FOREX market.
👇 In the comments 👇 you can type the trading instrument you'd like to analyze, and we'll talk about it in our next posts.
💬 Description: Gold has been showing signs of a possible "double top," but an update of the high may happen. While gold is testing its all-time high once more, silver and platinum have not yet recovered from their decline at the end of last week. Given that the USD index has been rising alongside gold since mid-September, it can be assumed that gold's current rally is a culmination of retail buying. The likelihood of a downward reversal has increased.
Thanks for your support 🚀
Profits for all ✅
❗️ Updates on this idea can be found below 👇

GBP/USD - Fundamental Drive Ahead! (21.10.2025)🧠 Setup Overview:
GBP/USD has broken below its rising trendline after testing the 1.3470 resistance zone multiple times. The pair is under fundamental selling pressure, fueled by risk aversion and renewed U.S. dollar strength.
Fundamental Drivers:
1️⃣ U.S. markets gained as President Trump decided not to impose very high tariffs on Chinese goods, which temporarily boosted sentiment.
2️⃣ However, investors are now digesting U.S. credit risks and US–China trade tensions, both adding safe-haven demand to the USD.
3️⃣ Meanwhile, the UK economy faces uncertainty from softer consumer spending and weak housing data — further limiting GBP’s upside potential.
📉 Technical Plan:
Bias: Bearish below 1.3400
Structure: Trendline breakdown confirmed
Cloud Resistance: Adds confluence to downside momentum
Next Levels to Watch:
🟥 1st Support: 1.3349
🟥 2nd Support: 1.3310
📊 If price closes below 1.3349 on the 30-min chart, further selling pressure may extend toward 1.3310 and possibly deeper if fundamentals align.
#GBPUSD #Forex #TechnicalAnalysis #PriceAction #Ichimoku #TrendlineBreak #FXMarket #BearishSetup #TradingView #KABHI_TA_TRADING
⚠️ Disclaimer:
This analysis is for educational purposes only — not financial advice. Always manage your risk and use proper position sizing before entering any trade.
📣 Support My Work
If you found this analysis useful — LIKE 👍, COMMENT 💬, and FOLLOW 🔔 to stay updated with daily Forex setups!

GBPUSD 1H Analysis: Bearish Pressure Builds After Break 📊 GBPUSD – 1 Hour Analysis (SELL)
Technical Outlook:
Bullish momentum is fading, and selling pressure is building after the recent break.
My trade plan is on the SELL side; target level: 1.33564 📉
Fundamental Analysis:
On the U.S. side, the strong dollar narrative and the Fed’s data‑driven stance continue to support USD strength.
Meanwhile, uncertainty around the U.K.’s growth/inflation balance and tighter financial conditions are weighing on GBP.
Together, these factors reinforce the downside bias in the pair.
🙏 Every like is my biggest motivation to keep sharing these analyses.

USD Index: Bearish for today?At least for today it looks like dollar index is bearish.
Waiting for #1 BOS - as initial confirmation that bearish is taking over.
#2 BOS - should provides a confirmation that bearish is on its way.

US Dollar: Looking For Higher Prices This WeekWelcome back to the Weekly Forex Forecast for the week of Oct 20-24th.
In this video, we will analyze the following FX market: USD Dollar
The USD had a bearish week overall, but Friday's bullish close may hint towards the bias for this week. Potentially, we may see some continuation to the upside over the next couple of days.
Look at how price pulled back into the Daily Demand. This is a great place for the retracement to end ... and the new bullish leg to begin.
Wait for confirmations... like the failure of the -FVG. Then buys become valid.
Enjoy!
May profits be upon you.
Leave any questions or comments in the comment section.
I appreciate any feedback from my viewers!
Disclaimer:
I do not provide personal investment advice and I am not a qualified licensed investment advisor.
All information found here, including any ideas, opinions, views, predictions, forecasts, commentaries, suggestions, expressed or implied herein, are for informational, entertainment or educational purposes only and should not be construed as personal investment advice. While the information provided is believed to be accurate, it may include errors or inaccuracies.
I will not and cannot be held liable for any actions you take as a result of anything you read here.
Conduct your own due diligence, or consult a licensed financial advisor or broker before making any and all investment decisions. Any investments, trades, speculations, or decisions made on the basis of any information found on this channel, expressed or implied herein, are committed at your own risk, financial or otherwise.

Buy Bitcoin, Not bananas Since the last emergency update from Yellen to buy Bitcoin, we're up by approximately 260%.
In this next update from the Volcanic Miner Empire(VME) located in El Salvador, we're giving an "All Good" update. Buy Bitcoin, don't buy Bitcoin, buy bananas like Mark Cuban - whatever, we literally couldn't care less, lol.
BUT,
If you're a sensible entity browsing a website for good investment ideas, this setup should intrigue you. We have spent two-thirds of the year consolidating the previous all-time high on Bitcoin.
The world is easing monetary policy, markets are at all-time highs (with trillions of treasury notes expiring, freeing up more fiat and chasing more gains), and China is about to start handing out money in 500 billion increments to do nothing but invest in anything, for free, no risk... LOL. This is just the tip of the Volcano.
Impossible to tell you when this happens, but given macro events, it seems much sooner than later if this cycle is to confirm.
Do what you want, do it safely, and laugh at Cuban every time you eat/see/think about a banana.
