Gold Above 4300 – Watching for FVG Fill Before Next LegPrice consolidated all of yesterday’s Asian and London sessions before breaking bullish through NY, clearing the 4300 resistance.
Today, we’re holding above that breakout level and sitting just beneath the weekly high at 4398.
A 4H FVG rests below price around 4345–4360 — that’s my first area of interest for a retrace and possible continuation higher.
If price dips to fill that gap and shows strength, I’ll look for a long toward 4398–4420.
Otherwise, I’ll wait for a clear reclaim above the weekly high before confirming continuation.
Staying patient tonight — the easy part is waiting for the market to tell me what it wants to do.
#FuturesTrading #Gold #ICT #PriceAction #NOFOMO
DXY

USDJPY Rally Faces Pressure Near 151.250 on Safe-Haven FlowsHey Traders, in the coming week we’re monitoring USDJPY for a selling opportunity around the 151.250 zone.
The pair remains in a broader downtrend, currently in a corrective phase as it approaches this key resistance level.
Meanwhile, DXY is also correcting within its own downtrend, approaching resistance near 98.600, which reinforces the bearish bias on USD pairs.
With US–China tensions escalating, we’re seeing renewed safe-haven demand for JPY, potentially setting the stage for another leg lower in USDJPY.
Trade safe,
Joe

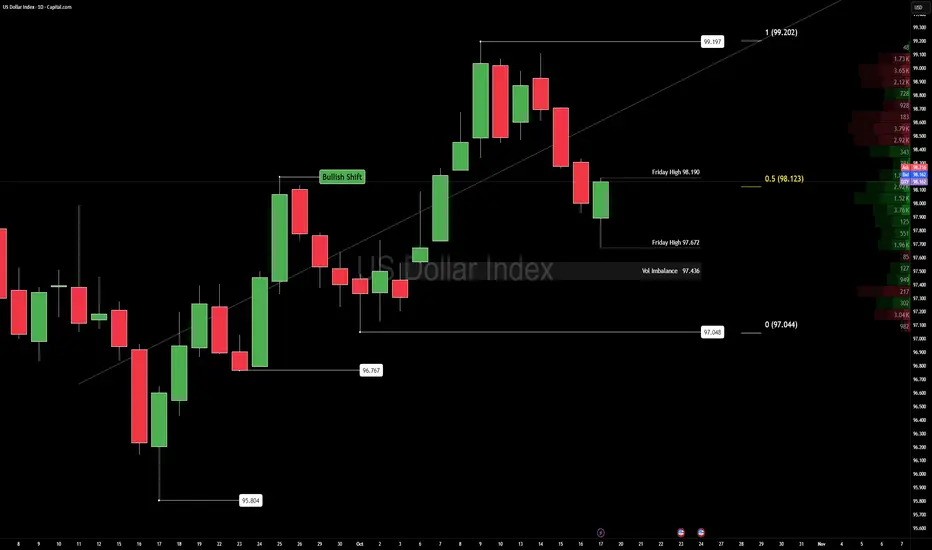
US DOLLAR UPDATE DXYDXY — Rangebound but Firm: 98.19 Holds the Line
Dollar holds steady inside Friday’s range — a quiet coil before the macro rotation.
🧭 Context
The Dollar spent Monday trapped between Friday’s high and low, liquidating the upper wick at 98.190 before closing back within range.
Price currently sits near the 50% Fibonacci retracement (98.123), keeping the bullish range intact but unconfirmed.
The market is balanced, not directional — patience is the edge here.
📊 Technical Map
Structure: Price remains inside a clean bullish range with a volume imbalance still unfilled near 97.436.
Momentum: Mildly bullish but range-dependent — upward bias, no breakout confirmation yet.
Key Levels:
Support → 97.672 / 97.436
Pivot → 98.123
Resistance → 98.190 / 98.420
🌐 Fundamental Pulse
This week’s key drivers: PMI flash, GDP (Thu), and PCE inflation (Fri) — all high-impact data that will steer the Fed narrative.
Yields remain firm but cooling; risk appetite mixed as traders await fresh growth signals.
Without new inflation pressure, the Dollar likely stays rotational within its higher-timeframe band until late-week catalysts.
🎯 Plan
Primary: Avoid midrange noise. Best setups are at range extremes — 97.6 support and 98.2 resistance.
Execution Filter: Wait for volume expansion or 1H close confirmation before breakout engagement.
Alternative: Failure to hold 98.12 reopens imbalance toward 97.43; a break above 98.19 invites continuation to 98.4–98.6.
⚠️ Risk / Alt
Range = noise. Stay tactical. High-frequency trades only until volatility expands.
🧠 Mindset Pulse
“In dull markets, discipline is the premium asset — not conviction.”
Professionals don’t chase noise; they preserve readiness.

Gold's Historic Rally: Where We're HeadingGold broke out of a multi-year consolidation (2020–2024) when it cleared the previous all-time high of $2,080. Once that level broke, we entered price discovery mode .
This is important: There's no overhead resistance from traders who bought at higher levels because there are no higher levels. That's bullish. But it also means we're in uncharted territory.
The weekly chart shows a clean uptrend with no signs of reversal yet. But rallies this big and fast typically need consolidation phases.
Here's where it gets specific. Gold showed a classic consolidation pattern:
- Consolidation range: $2,565–$2,750
- Breakout point: Early 2025
- Measured move target: ~$3400
Using the Fibonacci extension, if the uptrend continues, it suggests the next major resistance is around $4,500 and $4,750.
If you plot these on a chart, you see:
- Gold broke out cleanly from consolidation
- Every pullback has been bought
We're in a controlled uptrend, not parabolic. This is the structure of a trend that could continue.
But it's also the structure that could reverse if critical support breaks.

DXY AnalysisOn the weekly chart, the price has formed a new trading range. We mark it out and move down to the daily timeframe.
After the correction, the price reacted from an inefficiency zone, showing buyer interest.
At the moment, I’m considering two bullish scenarios:
1️⃣ An impulsive breakout of the daily FVG zone followed by an expansion of the current range.
2️⃣ A reaction from the FVG zone, then a sweep of Friday’s low, after which the price could resume its upward movement.
I see the second scenario as more likely, as it would allow the market to collect liquidity before continuing higher.

Bullish bounce?US Dollar Index (DXY) is falling towards the pivot and could bounce to the 1st resistance.
Pivot: 97.71
1st Support: 96.64
1st Resistance: 99.98
Disclaimer:
The above opinions given constitute general market commentary, and do not constitute the opinion or advice of IC Markets or any form of personal or investment advice.
Any opinions, news, research, analyses, prices, other information, or links to third-party sites contained on this website are provided on an "as-is" basis, are intended only to be informative, is not an advice nor a recommendation, nor research, or a record of our trading prices, or an offer of, or solicitation for a transaction in any financial instrument and thus should not be treated as such. The information provided does not involve any specific investment objectives, financial situation and needs of any specific person who may receive it. Please be aware, that past performance is not a reliable indicator of future performance and/or results. Past Performance or Forward-looking scenarios based upon the reasonable beliefs of the third-party provider are not a guarantee of future performance. Actual results may differ materially from those anticipated in forward-looking or past performance statements. IC Markets makes no representation or warranty and assumes no liability as to the accuracy or completeness of the information provided, nor any loss arising from any investment based on a recommendation, forecast or any information supplied by any third-party.

Weekly Outlook — Gold Futures (MGCZ2025)Price is sitting between key levels after last week’s explosive move.
I’m watching 4,300 as immediate resistance — if bulls can’t hold above this level, I expect a sweep toward 4,200–4,150 (H4 + Daily FVGs) before continuation.
Monday might just be a setup day, building liquidity for a Tuesday/Wednesday move.
Key Levels:
🟦 4,392 – Previous Weekly High
🟨 4,300 – Near-term resistance
🟧 4,200 – Daily Low / Support zone
🟩 4,150 – H4 FVG top
Let’s see how Monday sets the tone for the week.
#Gold #Futures #TradingPlan #ICT #PriceAction

Gold | Oil | Dollar | Natural Gas | Silver Price ForecastGold | Oil | Dollar | Natural Gas | Silver Price Forecast
NYMEX:NG1! NYMEX:CL1! COMEX:SI1! COMEX:GC1!

DXY SHORT FROM SUPPLY AREA|
✅DXY Price is retracing toward the supply level, where a reaction is likely once the imbalance gets filled. A rejection from this zone could confirm the retest before continuation lower toward the 98.30 target area. Time Frame 2H.
SHORT🔥
✅Like and subscribe to never miss a new idea!✅

DXY — Between Balance and Breakout
Date: Sunday, October 19
Timeframe: Daily
Analyst: @CORE5DAN
Context
The U.S. Dollar Index holds a bullish daily range between 99.197 and 97.048, now sitting around the Fibonacci 50% retracement at 97.044.
Friday’s session formed a tight box — high 98.190, low 97.672 — showing compression inside balance conditions.
Price trades above mid-range, with a volume imbalance near 97.436 acting as a magnet for short-term rotation.
Key liquidity rests just below 97.700, and reactions there could define early-week direction.
Technical Map
• Structure: Short-term bullish, still inside a broader weekly bearish framework. Watch 97.436–97.700 — a clean reaction zone where imbalance and liquidity converge.
• Momentum: Range-bound bullish, confirming control but lacking expansion. A daily close above 98.190 opens the path toward the range high at 99.197.
• Volume: Imbalance remains unfilled — ideal for mean-reversion setups before any breakout impulse.
Fundamental Pulse (Week Ahead)
• Macro Drivers:
— US GDP advance data: key for growth tone.
— Core PCE inflation: the Fed’s favored inflation gauge.
— Fed speakers and PMIs: tone setters for November rate outlook.
• Yields:
— The 10-year sits near 4.6%.
— A push higher = bullish Dollar, stronger short-term flows.
— A pullback = potential consolidation across USD pairs.
• Global Flows:
— Mild rotation out of risk assets and emerging markets supports the Dollar.
— EURUSD and XAUUSD both reflect this hesitation near key supports.
Plan
Bias stays bullish in the short term, bearish in the long term.
We favor volume imbalance fills and reaction trades at 97.436–97.700 before re-evaluating structure.
If macro data or yield spikes support Dollar demand, expect continuation toward 98.190+.
Otherwise, a drift below 97.436 would signal distribution and confirm corrective pressure.
“Structure is the compass; sentiment is the weather.”
Mindset Pulse
“Authority comes from clarity, not prediction.”
Trade what’s confirmed — not what’s comfortable.
EURUSD BTMM Analysis – Potential Reversal SetupOn the 1-hour chart, EURUSD continues to follow a clear downward trend, with price forming multiple lower highs and lower lows across the week.
Currently, the pair is trading near a potential reversal zone, where market makers may begin accumulation before a shift in direction. The MAs remain bearish, but early signs of exhaustion are visible as momentum slows near 1.1550 support.
If price forms a clear structure shift (SOC) or stop-hunt low, the setup could confirm a Day 1 reversal leading into a bullish retracement or a new cycle phase.
Bias: Preparing for possible bullish reversal
Confirmation: Structure break and hold above intraday highs
Invalidation: Sustained breakdown below 1.1530

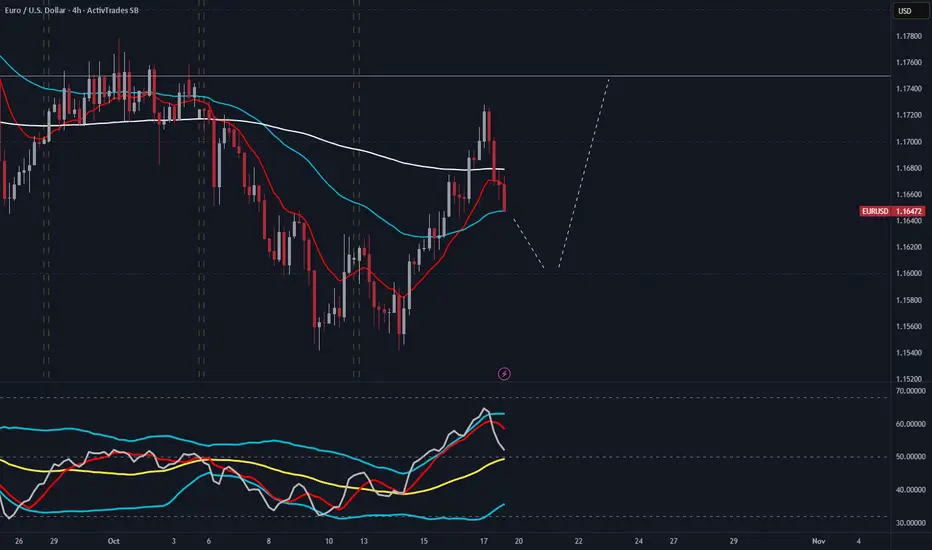
EUR/USD 4H Analysis EURUSD provided a double bottom and rallied it's away towards 1.17 then pulling back shortly after. I'd like to see the market reverse and continue the bullish rally after it's done with the pullback.
DXY DXY is showing some more correction and one more drop.
Disclosure: We are part of Trade Nation's Influencer program and receive a monthly fee for using their TradingView charts in our analysis.

DXY: Sellers Take ControlHi traders and investors!
This analysis is based on the Initiative Analysis concept (IA).
The US Dollar Index (DXY) formed a sideways range on the daily timeframe at the end of June. The seller’s initiative is now active, with a target at 96.767.
Before that, there was a buyer initiative, and we can see that at the end of it, there was a manipulation around the 98.640 level.
A buyer attack occurred on high volume, but the sellers absorbed the buyer’s attack candle and pushed the price downward on October 15.
The price may return to retest either 98.65 - 98.35 area. However, the main movement on the Dollar Index remains downward.
Wishing you profitable trades!

WHAT IS THE EXPECTED RETURN and DURATION of this GOLD Bull Run?Well, when measured against the DXY index, a clear trend becomes apparent.
A Golden Bull typically lasts about 40 quarters, which is essentially 1 decade (give or take a quarter).
Similar to #Bitcoin and its cyclical bull markets within a larger secular bull, the returns tend to decrease over time.
However, it seems that a triple-digit Gold price relative to the DXY is on the horizon at the very least.
What would that look like if the DXY were to hit a new low around 69? This would suggest a Gold price of $6900 at a ratio of 100:1.
A Gold price of $12K with a DXY of 80 only requires a ratio of 150...
Thus, a five-digit Gold price is certainly within the realm of possibility.
I have forecasts that extend as high as $12K.

GBP/USD – Buy Entry (H1- Channel Breakout Pattern)The GBP/USD Pair, Price has been trading within a Channel Pattern on the H1 chart, forming consistent higher highs and higher lows. Price action is now testing the upper boundary of the Pattern, signalling a possible breakout.
✅Market Context:
1️⃣Strong Upward Structure Inside the Pattern.
2️⃣Buyers are showing strength near Resistance.
3️⃣Breakout above the Trendline indicates Momentum continuation toward higher zones.
✅Trade Plan:
Entry: Buy after Confirmed Breakout above the Resistance (H1 candle close above trendline or retest of the breakout).
💰Take Profit (TP): At the Key Zone – a Major Resistance area identified ahead.
🛑Stop Loss (SL): Below the Pattern Structure.
✅Psychological Discipline :
1️⃣Stick to plan – No Revenge Trades.
2️⃣Accept losing trades as Part of the Strategy.
3️⃣Risk only 1–2% of your account balance per trade.
💬 Support the community: If you found this useful, drop a 👍 like and share your thoughts in the comments!
⚠️ Disclaimer: This analysis is for educational purposes only and does not constitute financial advice. Forex trading involves high risk. Trade only with capital you can afford to lose and always do your own research.

DXY Free Signal! Sell!
Hello,Traders!
DXY Price is expected to retest the horizontal supply area early next week as liquidity builds up below Friday’s close. Smart Money may engineer a short-term rally into this zone before resuming the bearish move toward 98.38.
-------------------
Stop Loss: 98.71
Take Profit: 98.38
Entry: 98.58
Time Frame: 3H
-------------------
Sell!
Comment and subscribe to help us grow!
Check out other forecasts below too!
Disclosure: I am part of Trade Nation's Influencer program and receive a monthly fee for using their TradingView charts in my analysis.

DXY Will Go Higher! Buy!
Take a look at our analysis for DXY.
Time Frame: 1D
Current Trend: Bullish
Sentiment: Oversold (based on 7-period RSI)
Forecast: Bullish
The market is approaching a key horizontal level 98.541.
Considering the today's price action, probabilities will be high to see a movement to 99.742.
P.S
Overbought describes a period of time where there has been a significant and consistent upward move in price over a period of time without much pullback.
Like and subscribe and comment my ideas if you enjoy them!

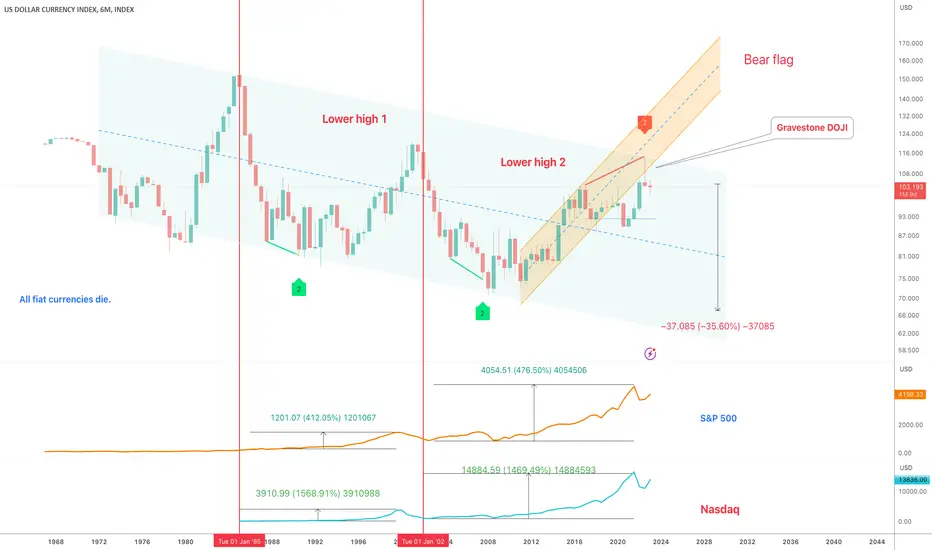
Dollar index - Macro Bearish divergenceA lot of information in the above 6-month chart of the dollar index, could discuss for hours.. some highlights:
1) The bearish divergence currently printing shall confirm by July 2023 should 100 level collapse. It is the only time in history a bearish divergence of this strength has printed on the 6-month chart.
2) IF it confirms, the index will target the lower side of the channel around 60-70 level.
3) Notice the trend of the index, lower highs lower lows. It is remarkable how many are bullish on the dollar, in the macro sense.
4) Both the S&P 500 and the NASDAQ made considerable gains in the 10-year period that followed a rejection from the upper side of the channel. Many ‘experts’ now talk about the coming lost decade. Gold is the only option, they say. Is that what you see in this chart?! Not what I’m seeing..
Will return in July to see how this candle prints, however with 1.3 months to go it is not looking good for the dollar.
Ww
DXY UpdateDXY — The Volume Cap: Where Momentum Meets Memory
Every market has memory — and in the Dollar Index, it’s sitting right at 97.4.
That’s the current Volume Cap — a zone where heavy participation once stopped price cold, leaving unfinished business behind.
Price loves to revisit these caps, testing whether the imbalance still holds or finally gives way.
⚙️ Context (4H | Friday Recap)
Friday delivered heavy volume and clean directional flow — a textbook session.
DXY continues to rotate within the 97.048–99.198 range, holding a short-term bullish tone inside a larger consolidation.
📊 Technical Map
• Structure: Long-term bearish range inside a broader consolidation phase.
• Momentum: Still bullish, but showing early fatigue.
• Volume Cap: The 97.4 level remains unfilled, acting like a magnet for potential retests — the true battleground between continuation and correction.
🌐 Fundamental Pulse
After a month of running hot, the dollar finally cooled.
Retail Sales and Industrial Production softened, yields eased, and traders started whispering “rate cuts” again.
The Fed’s cautious tone keeps volatility contained ahead of next week’s Core PCE inflation data.
🧭 Trade Plan (If/Then)
If DXY runs through 97.4, watch for a bearish Volume Cap flip — potential downside toward nearby support.
If Monday’s price action drives higher, expect bullish momentum rotation back toward the 97.0 retest region.

DXY LOCAL SHORT|
✅DXY price is reacting to a confirmed ICT supply level, showing a clean mitigation from the imbalance zone. As long as this level holds, sellers may target the short-term liquidity resting below 98.30. Time Frame 2H.
SHORT🔥
✅Like and subscribe to never miss a new idea!✅

Gold Near 4,280 as US–China Tensions Fuel Flight to Safety!Hey Traders,
In today’s session, we’re monitoring XAUUSD for a buying opportunity around the 4,280 zone. Gold remains in a strong uptrend, with price currently correcting toward a key structural support area where buyers may look to re-enter.
From a fundamental standpoint, rising US–China geopolitical tensions have pushed investors toward safe-haven assets. Market sentiment is tilting defensive, and Gold — already hovering near all-time highs — continues to reflect that global risk aversion.
A sustained bid above 4,280 could reinforce bullish momentum and potentially open the path toward new highs if uncertainty persists.
Key level: 4,280 (support / trend confluence)
Bias: Bullish while above this level
Trade safe,
Joe.

EURUSDHello Traders! 👋
What are your thoughts on EURUSD?
EUR/USD is currently trading below a key resistance zone and has already pulled back to the broken ascending trendline.
The price action suggests weakening bullish momentum, indicating a possible continuation to the downside.
After some short-term consolidation in this zone, the pair is expected to resume its decline toward the highlighted support area.
As long as the price remains below the resistance zone, the short-term outlook stays bearish.
However, a daily close above the resistance would invalidate this bearish scenario.
Don’t forget to like and share your thoughts in the comments! ❤️
