THE / USDT : Testing trendline resistanceTHE/USDT Price is once again testing trendline resistance. A confirmed breakout from this level could trigger a rally towards $0.60.
Always wait for confirmation before entering and manage risk properly.
Dyor

WLFI / USDT : Attempting breakout from horizontal resistanceWLFI/USDT is attempting to break out from horizontal resistance. If the breakout is confirmed, a short-term bullish rally towards $0.25 – $0.30 can be expected.
Always wait for confirmation before entering and manage risk properly.

DOT / USDT : Momentum building for a strong rallyDOT/USDT is showing strong momentum and looks ready for a rally. If momentum continues to build, the next upside targets are $5 – $6.
Always manage risk and wait for confirmation before entering.

Mubarak / USDT : Momentum is shifting...Bullish rally aheadMUBARAK/USDT after a successful breakout, momentum is shifting upward. A rally towards $0.06 – $0.07 is now on the verge.
Always manage risk and monitor price action for confirmation.

MOODENG / USDT : Showing strength after successful retestAfter a successful retest, MOODENG is showing strong momentum and moving forward. A rally towards $0.30 – $0.35 is now expected.
Always manage risk and wait for confirmation on the next moves.

BRETT / USDT : Breaking out from symmetrical triangleBRETT / USDT is breaking out from the symmetrical triangle. If this breakout holds, we could see a strong rally towards $0.085 – $0.095 in the short term.
Always wait for confirmation and manage risk properly.

LINK / USDT : Showing strong momentum LINK/USDT is showing strong momentum and preparing to break out of a symmetrical triangle.
📌 Entry: $23.60 – $24.38
🎯 Targets: $26 – $28 – $30
⛔ Stop Loss: $22.30
Always manage risk properly and DYOR ✅

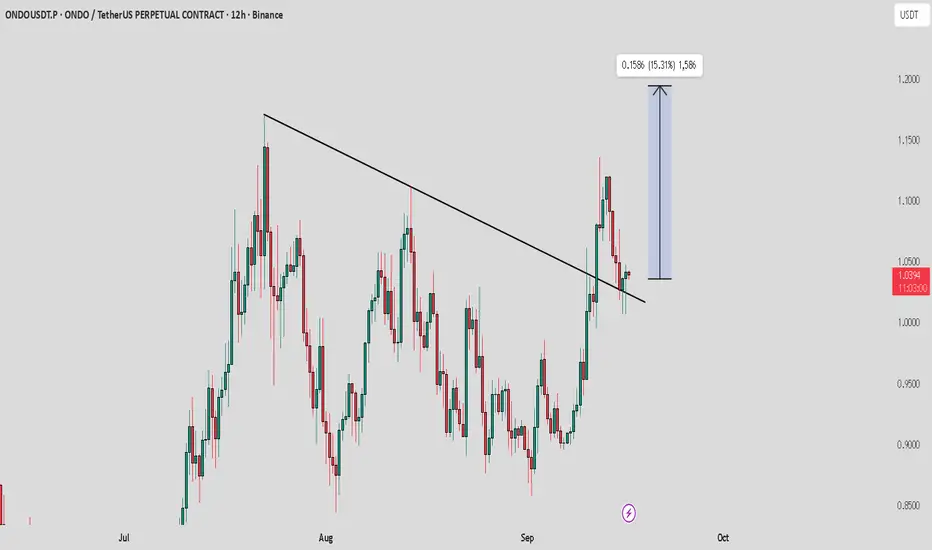
ONDO / USDT : Retest successful , Strong rally aheadONDO/USDT after a successful retest is now ready for a strong rally towards $1.20 – $1.40.
📌 Manage risk wisely.
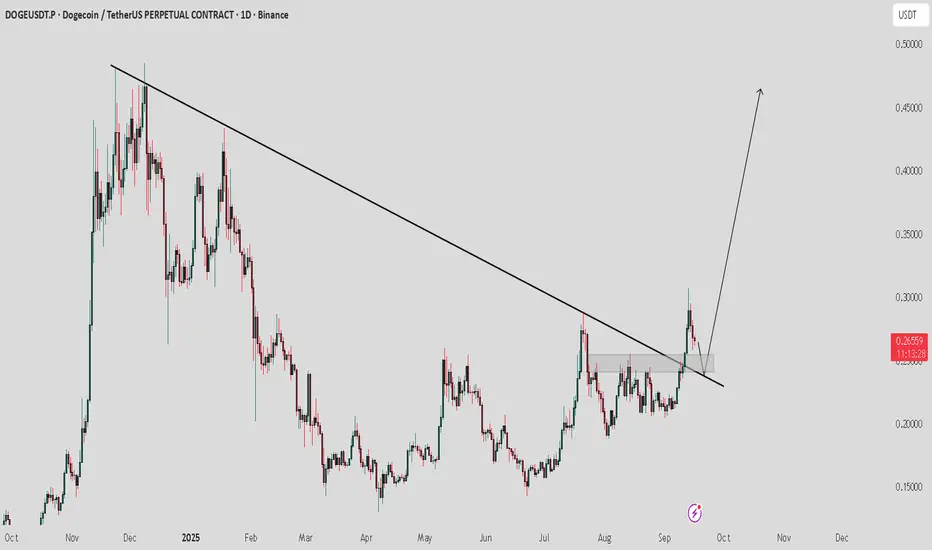
DOGE / USDT : Expecting strong move after successful retestDOGE/USDT has broken out from trendline resistance with strong potential. Currently, a retest is in progress — a successful retest could trigger a bullish rally towards $0.40 – $0.50.
📌 Always wait for confirmation of the bullish move and manage risk wisely.
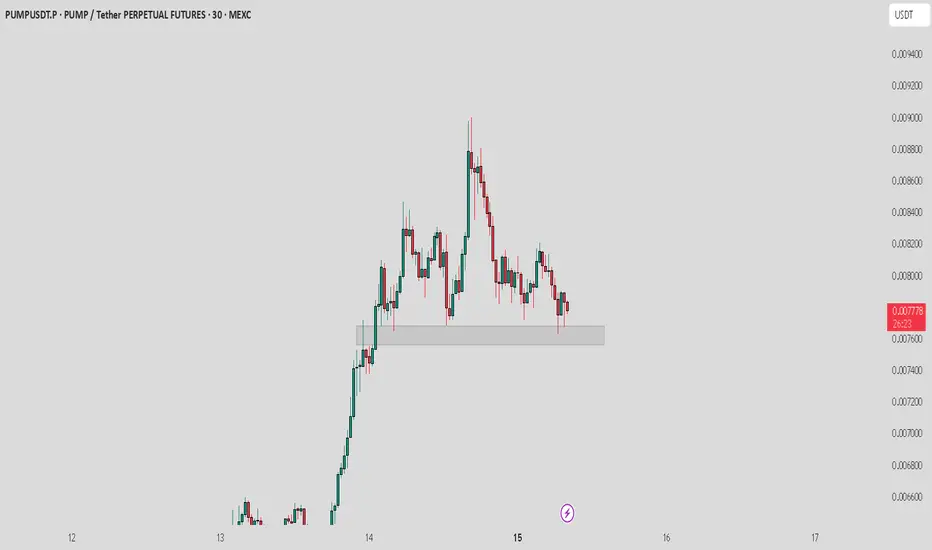
PUMP / USDT : Trading at major support zonePrice is consolidating at a key support zone. Holding this level could trigger a relief bounce, while a breakdown may open room for deeper downside. This zone will decide the next move.
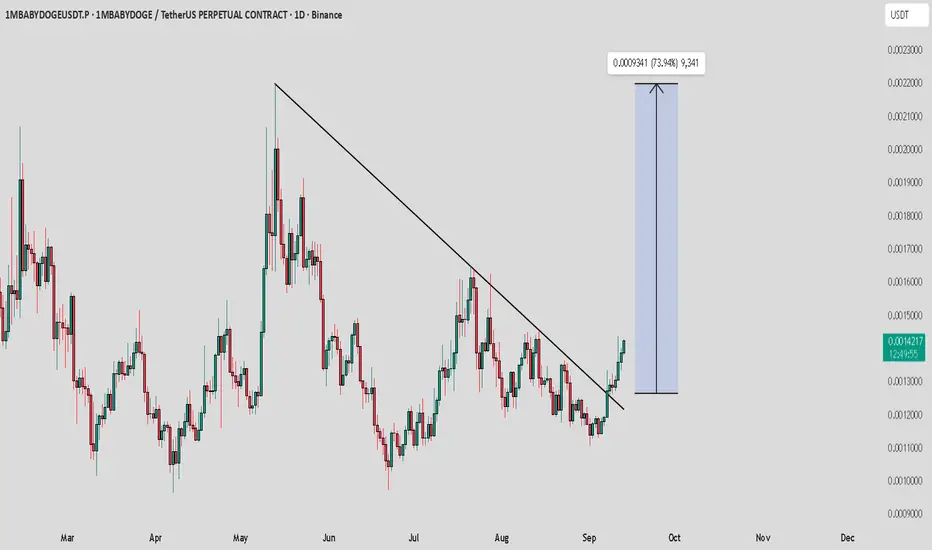
1MBABYDOGE / USDT : Showing strong momentum after breakout1MBABYDOGE/USDT is showing strong momentum after breaking out of trendline resistance. Already up +13%, but the structure still looks bullish.
Next targets: $0.0020 – $0.0025 if momentum continues.
Always manage risk and avoid chasing without confirmation.
BTC / USDT : Falling wedge breakout confirmedBitcoin (Update)
BTC has confirmed a breakout from the falling wedge pattern. After some consolidation, we anticipate a strong bullish move toward the $124,000 zone.
Keep it on your radar — breakout confirmation is in place, momentum could build quickly. Always manage risk in volatile conditions.

SEI / USDT : Looking so good for strong bullish rallySEI/USDT is showing strong momentum and is once again breaking out of trendline resistance. If this breakout sustains, we can expect a short-term rally toward $0.40 – $0.45.
Spot Update: SEI is also looking very attractive for spot buyers — a good accumulation opportunity.
Midterm Target for SEI: $0.80 – $1 🚀

ROSE / USDT : Bullish rally ahead after successful retestROSE/USDT has broken out of trendline resistance and is now heading for a retest of the breakout zone. If this retest holds successfully, price could rally toward $0.045.
📌 Always wait for clear confirmation of a bullish move before entering. Manage risk wisely.

PENGU/USDT : Bouncing back and now breaking Trendline resistancePENGU/USDT bounced strongly from horizontal support and is now breaking out of trendline resistance with solid momentum. If this breakout holds, the next target is $0.045.
Always wait for confirmation before entering. Momentum looks promising, but risk management is key.

SOL / USDT : Trading near trendline resistance with potentialSOL/USDT (2H timeframe) is trading near trendline resistance with strong potential.
If price breaks above this resistance, we could see a rally toward $220.
If it fails to break, this setup will be invalid.
Keep it on your radar and always wait for confirmation before entering.

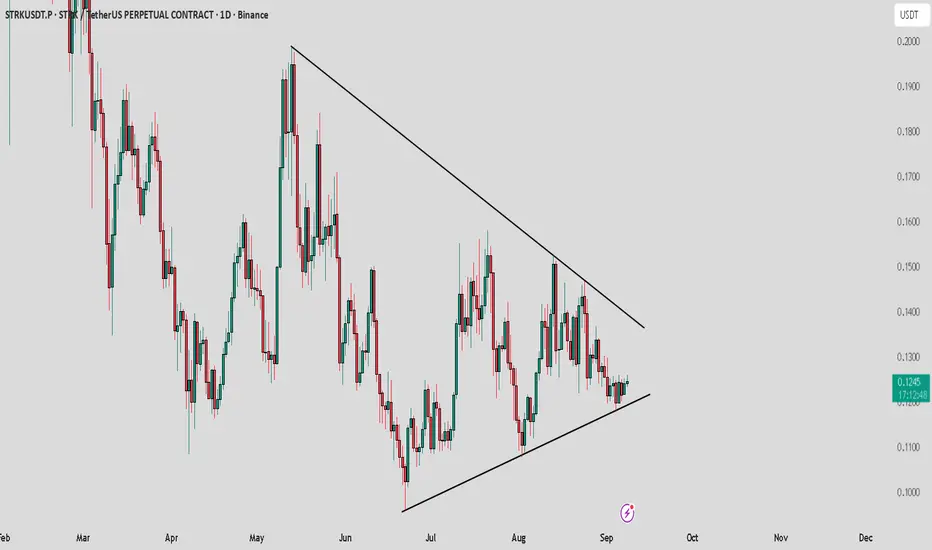
STRK /USDT : Holding support and bouncing to approach resistanceSTRK/USDT is holding strong support and climbing toward the $0.13 resistance.
A breakout above this resistance could open the way for a bullish rally toward $0.20. Keep a close watch for confirmation.
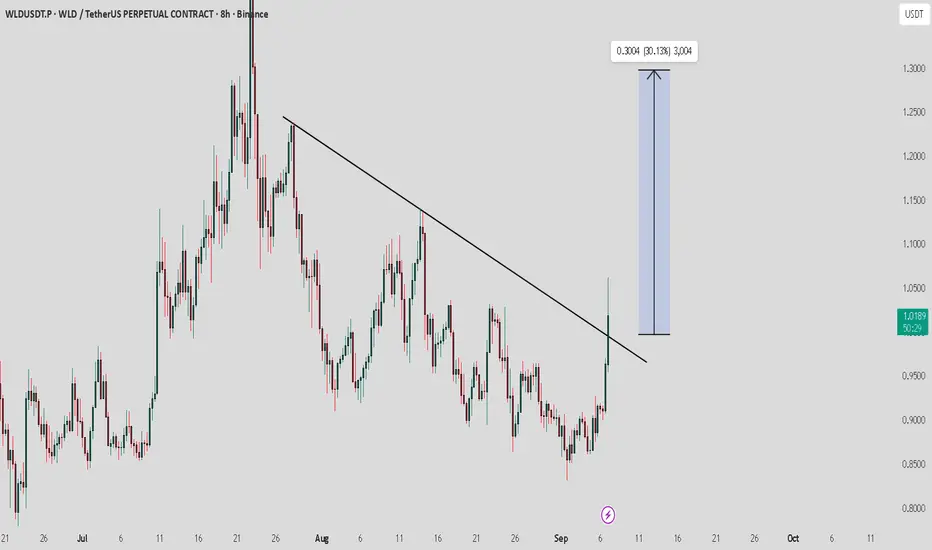
WLD / USDT : Breaking out with strong potentialWLD/USDT is breaking out of trendline resistance with strong potential. This breakout could signal the start of a strong rally ahead.
If the breakout holds, the next upside targets are $1.10 – $1.20 – $1.30. A successful retest would further strengthen this setup.
Always wait for a clear bullish signal and candle close to avoid fakeouts. Manage risk wisely before entering.
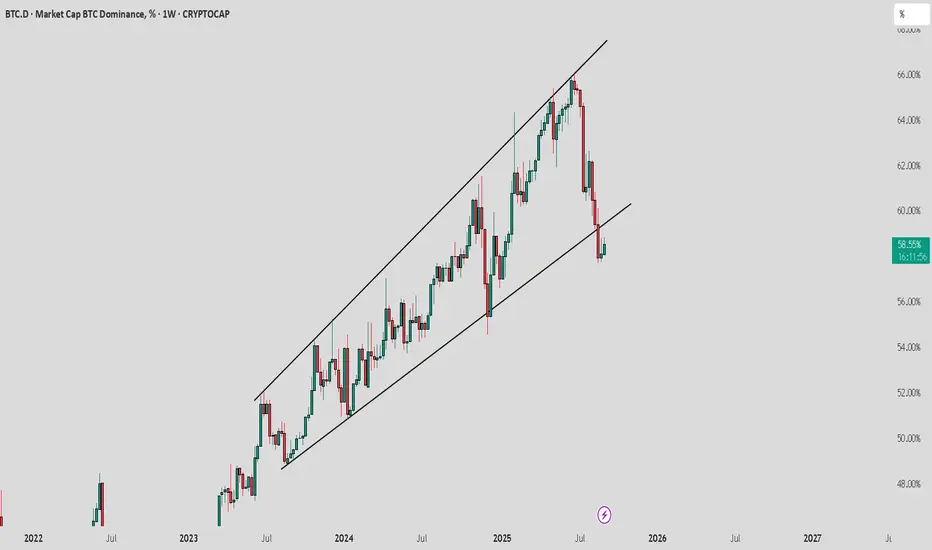
BTC.D : Moving upward to retest ascending channelBTC.D (1W Update)
Bitcoin dominance has broken down from the ascending channel and is now heading for a retest.
If this retest fails to reclaim the channel, it could trigger a huge rally in altcoins over the long term — just a matter of time.
Keep a close watch, as confirmation here will decide the next big move for the market.
PARTI / USDT : Confirmed its breakout..Strong rally aheadPARTI/USDT has confirmed its breakout and is now moving with strong momentum. If this breakout sustains, price could rally toward the $0.30 target.
Always manage risk properly and trade with confirmation.

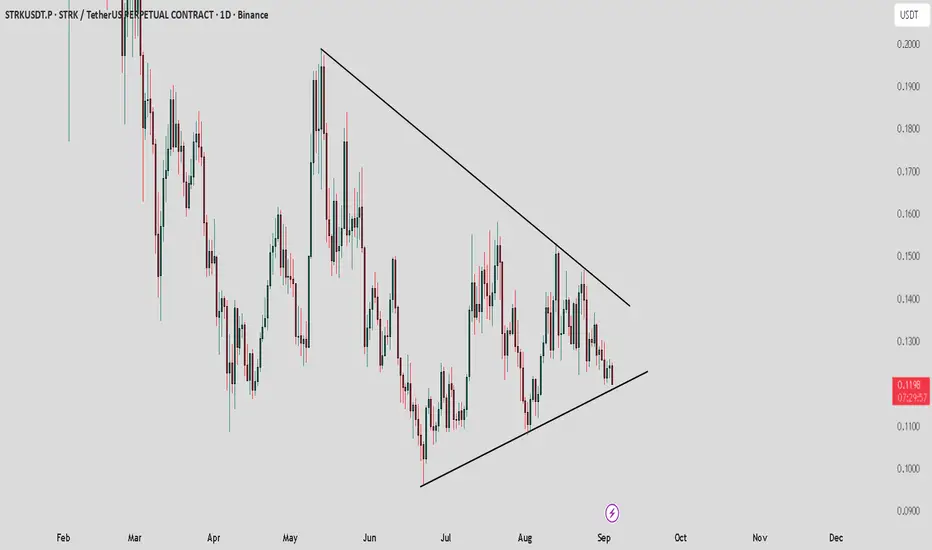
STRK / USDT : Near to support of symmetrical triangleSTRK/USDT is trading near the support of the symmetrical triangle.
Bullish scenario: If support holds, price could bounce toward the resistance at $0.13.
Bearish scenario: A breakdown from this support may drag price toward $0.096.
Always wait for confirmation before entering. Manage risk properly and trade according to market conditions.
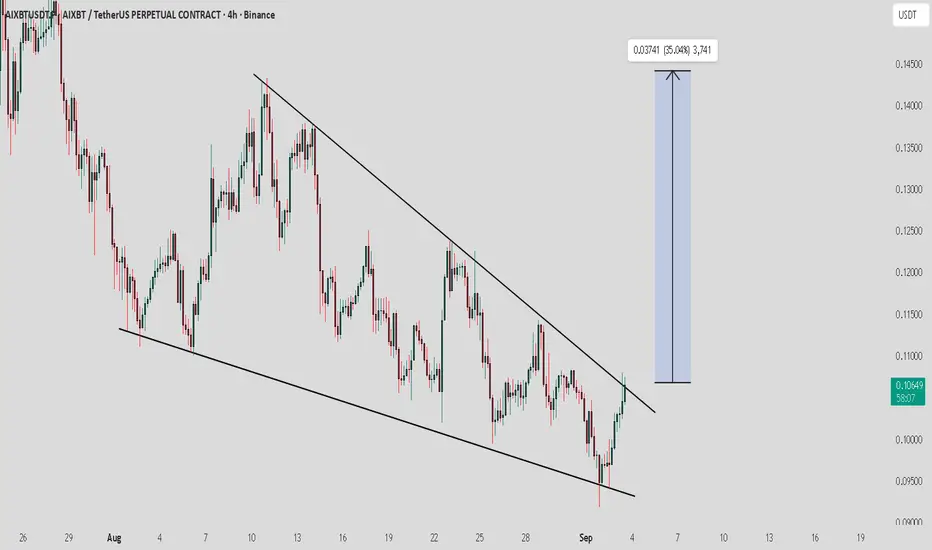
AIXBT / USDT : Attempting breakoutAIXBT/USDT is testing its trendline resistance and attempting a breakout. If this breakout confirms with strong momentum, we could see a rally toward $0.13 – $0.15 soon.
Best approach: Always wait for clear confirmation before entering. Manage risk properly and trade smart.
Bake / USDT : Strong rally aheadBake / USDT is currently trading at the bottom support and expecting big move soon..
