Dollar Off to Weak Start After Worst Year Since 2017. Now What?The US dollar rang in 2026 without much enthusiasm. No fireworks. No flex. Just a quiet shuffle out of the gate that felt eerily familiar to anyone who shoved cash in FX markets last year.
After logging its worst annual performance since 2017, the greenback has started the new year on the back foot — and traders are wondering whether this is merely a breather or the beginning of something more structural.
If currencies had personalities, the dollar currently looks like it stayed up too late in 2025 and is still reaching for its first coffee. After all, the US currency was the worst performer of all major currency indices last year, according to the currency index performance table .
💵 The Euro Holds the Line at $1.17
Front and center in the dollar’s early-2026 wobble is the euro, which has done a solid job containing the greenback’s attempts to regain swagger. The FX:EURUSD briefly dipped toward $1.1670, only to bounce smartly after running into two major moving averages — the kind of technical speed bump that gets traders’ attention.
The result? The euro stabilized near $1.17, flat on the year and comfortably above levels that once seemed ambitious.
📉 A Brutal Year in the Rearview Mirror
Let’s rewind.
In 2025, the dollar index TVC:DXY fell roughly 10% against a basket of major currencies, its steepest drop in nearly a decade. The early damage came fast and loud, triggered by President Donald Trump’s aggressive tariff campaign back in April, which rattled global markets and reignited concerns about US growth and trade stability.
At one point, the dollar was lower by 15%, before clawing back some ground. But the recovery never quite stuck.
What really kept the pressure on was the Federal Reserve’s pivot back to rate cuts in September, which undermined one of the dollar’s most reliable supports: yield advantage.
🏦 Rate Cuts Change the FX Equation
Currencies love interest rate differentials. They’re boring, mathematical, and extremely powerful.
As the Fed moved toward easing — and signaled more to come — that differential began to shrink. The market is now pricing in two to three quarter-point cuts by the end of 2026, a meaningful shift for a currency that spent years riding the “higher for longer” narrative.
Across the water, the picture looks different. ECB President Christine Lagarde recently reminded markets that “all options should remain on the table,” even as the central bank held rates steady and raised growth and inflation forecasts.
TLDR: Europe isn’t in a rush (or under pressure) to cut.
📈 Why Europe (and the UK) Are Benefiting
The euro was the biggest gainer among major currencies in 2025, rising nearly 14% to levels last seen in 2021. Wall Street banks now expect it to climb further — toward $1.20 by the end of 2026.
Sterling isn’t far behind. Analysts see the FX:GBPUSD rising from around $1.33 to $1.36, helped by relatively sticky inflation and fewer expectations for aggressive easing from the Bank of England.
👔 Politics Enter the FX Chat
Another wildcard looms over 2026: the next Fed chair.
Markets are keenly aware that President Trump’s eventual pick to succeed Jay Powell could influence the dollar’s trajectory. If investors believe the next chair will be more receptive to White House pressure for deeper rate cuts, the greenback could face additional headwinds.
Powell’s term ends in May, FYI.
🤖 Dollar Bulls Still Have a Case
What about the bull case? Dollar bulls’ argument rests on one powerful theme: AI-driven growth. The US economy continues to benefit from massive investment in artificial intelligence, data centers, and advanced manufacturing — sectors where America remains the global leader.
If that growth keeps the US economy outperforming Europe, the Fed may find it harder to cut aggressively, putting a floor under the dollar. In other words, the greenback’s obituary may be a bit premature.
🧭 So What Now?
Anyway, the dollar enters 2026 without its usual moat — pressured by rate expectations, policy divergence, and lingering doubts about its haven status, especially in the wake of gold OANDA:XAUUSD shattering records .
That doesn’t mean a straight-line decline. FX markets rarely move that neatly. But it does suggest that rallies may be sold rather than chased, and that traders are increasingly comfortable exploring alternatives.
Off to you : Where do you see the dollar heading next? Ready to buy high and sell low, or what? Share your views in the comments!
E-DOLLAR

Gold surges 2.75% on Venezuela, weak dollar! Eyes on new recordsGold has surged 2.75% on Monday and continues higher on Tuesday, now trading around $4,465 and eyeing a retest of record highs at $4,550. This rally is fuelled by Venezuelan tensions, a weaker US dollar, and soft manufacturing data—but is this a breakout or a trap before NFP?
We analyse why the weaker dollar—not pure safe-haven demand—is the dominant driver, as both gold and stocks are rallying together. We then map out the critical Fibonacci levels that will determine whether gold breaks to new highs or corrects back toward $4,400.
Key drivers
- Venezuela tensions & dovish Fed : Gold got a safe-haven bid following Trump's aggressive stance on Venezuela, but the real driver is dollar weakness after Fed Governor Kashkari's dovish comments about slow disinflation and rising unemployment risks.
- Weak Manufacturing PMI : US ISM PMI dropped to 47.9 from 48.4 expected, reinforcing the soft-landing narrative and pushing the dollar lower.
- Dead Cat Bounce invalidated : Price has broken above both the 50% and 61.8% Fibonacci retracements ($4,447), invalidating the bearish "dead cat bounce" scenario that suggested another leg down.
- Upside targets : The immediate hurdle is the 78.6% Fib at $4,490. A break here strongly suggests new record highs toward $4,550 before the NFP report on January 9. Above that, $4,600 and $4,750 are psychological targets.
- Downside risks : Key support is the weekly open at $4,430 (or gap fill at $4,455). A breakdown below the 50% Fib at $4,412 would shift sentiment bearish and open the door to deeper corrections.
- NFP wildcard : Markets are cautious heading into Thursday's jobs report. A weak NFP could fuel another leg higher, while a strong print may trigger profit-taking.
Are you buying the breakout toward $4,550 or waiting for a pullback? Share your gold strategy in the comments and follow for NFP coverage later this week.
This content is not directed to residents of the EU or UK. Any opinions, news, research, analyses, prices or other information contained on this website is provided as general market commentary and does not constitute investment advice. ThinkMarkets will not accept liability for any loss or damage including, without limitation, to any loss of profit which may arise directly or indirectly from use of or reliance on such information.

Gold (MGC) — HTF Bullish, Waiting on Acceptance for ContinuationHTF structure remains bullish with price printing higher highs and higher lows.
Yesterday produced a slow, rotational push higher, suggesting digestion rather than clean expansion.
Today’s session opened by testing yesterday’s high, followed by an immediate pullback into the 50% equilibrium of yesterday’s range. This area is now acting as a key decision zone.
For continuation, I want to see:
Displacement away from the 50% level
Reclaim and acceptance above yesterday’s high (not just a tag)
Clean follow-through without immediate rotation back into prior range
If price fails to reclaim and starts accepting below equilibrium, I’ll remain patient and wait for deeper value before considering continuation setups.
Bias stays bullish — execution depends on confirmation, not assumption.
Plan > Patience > Execution

Gold @ Yearly Highs — Pullback, Not Panic. Patience @ HTF LevelsNew year, fresh perspective. After a 2-month mental reset, I’m back watching Gold from a higher-timeframe lens.
Price has expanded into yearly highs and is now pulling back into prior weekly value — a normal rebalancing phase, not immediate weakness. Multiple Weekly FVGs below have already served as fuel for the move up, and current price action looks more like liquidity clearing and position adjustment than trend reversal.
With the Dollar under pressure and macro volatility elevated, I’m prioritizing location over prediction. I’m not chasing breakouts here — I’m waiting for sell-side runs into HTF zones, acceptance, and clean displacement before considering longs.
This is a patience environment. Best trades will come from pullbacks and reactions, not impulse.
Let price show its hand.

XAUUSD Strong Bull Trend, Watching for Continuation vs Shallow
Timeframes: 4H / 1H (Daily context)
Date: January 6, 2026
Bias: Bullish continuation with intraday consolidation risk
📌 Market Overview
Gold (XAUUSD) remains within a dominant bullish structure, supported by persistent safe-haven demand and strong technical momentum. After an exceptional rally throughout 2025, price is consolidating above the $4,400 region, suggesting acceptance at higher value rather than distribution.
Current price action reflects digestion before the next directional expansion.
📈 Trend & Market Structure
Daily trend: Strong bullish (higher highs / higher lows)
4H structure: Ascending channel remains intact
Recent pullback: Shallow and corrective, followed by a fast reclaim above $4,400
A previously observed 4H bear flag failed, increasing continuation probability
➡️ As long as price holds above the recent higher low, bullish structure remains valid.
📊 Technical Indicators
RSI (14):
Holding around 64–65
Bullish momentum, no bearish divergence
RSI above 55 supports trend continuation
MACD:
Daily MACD remains positive (no bearish cross)
4H MACD has turned upward again after consolidation
Momentum pause, not reversal
Moving Averages:
Price well above 50-day and 200-day MAs
Bullish MA alignment confirms trend strength
20-day MA acting as dynamic intraday support
Bollinger Bands:
Price trading near the upper band
Bands beginning to expand again → volatility expansion likely
No mean-reversion signal yet
Volume / VWAP:
High-volume acceptance around $4,395–$4,405
Price holding above VWAP = buyers in control
Thin volume above $4,440 increases breakout potential
🔑 Key Levels to Watch
Resistance
$4,441 — Immediate resistance / breakout confirmation
$4,475–$4,500 — Next upside expansion zone
Support
$4,403 — Intraday pivot / value area
$4,373 — Key short-term support (recent higher low)
$4,313 — Major structural support (bullish invalidation below)
🧠 Trade Scenarios
Scenario 1 — Bullish Continuation (Preferred)
Bias: Buy strength
Confirmation: Sustained break and hold above $4,441
Expectation: Continuation toward $4,475–$4,500
Rationale: Failed bearish pattern + bullish momentum + strong structure
Scenario 2 — Shallow Pullback (Counter-Trend / Neutral)
Failure near $4,440 combined with loss of $4,395
Retracement toward $4,373 possible
Still corrective unless $4,313 breaks
📌 Technical Conclusion
No topping or distribution signals present
Momentum indicators support continuation
Consolidation above former resistance is constructive
Bias remains bullish while price holds above $4,373

Global FX Overview: Dollar steady as policy expectations remain Dollar (USD): Waiting for confirmation from labor data
The US dollar traded cautiously as traders refrained from making large directional bets ahead of a crucial batch of US labor market data, with December’s Nonfarm Payrolls report firmly in focus. Employment data plays a central role in shaping US monetary policy expectations, as labor market strength feeds directly into wage growth, inflation persistence, and ultimately interest rate decisions. With uncertainty around whether the US labor market is cooling meaningfully or remains tight, investors are opting to wait for clearer confirmation before adjusting rate expectations. As a result, the dollar has remained range-bound, reflecting a pause driven by event risk rather than a decisive shift in sentiment.
Asia (JPY): Yield differentials continue to favor the dollar
In Asia, the concept of yield differentials continues to explain why the dollar remains strong against the yen despite Japan’s recent rate increase. In foreign exchange markets, currencies are driven less by the absolute level of interest rates and more by the relative difference between two economies’ yields. While Japan has begun normalising policy and long-term Japanese government bond yields have reached multi-decade highs, the gap between Japanese and US interest rates remains wide. US short-term and real yields are still significantly higher, making dollar-denominated assets more attractive to global investors. This sustained yield advantage keeps capital flowing into the dollar, while the yen remains a preferred funding currency for carry trades. Until this differential narrows meaningfully, incremental tightening by the Bank of Japan is unlikely to produce sustained yen strength against the dollar.
Europe (EUR): Softer inflation dampens long-term tightening expectations
The euro weakened modestly after German inflation slowed more than expected, reducing confidence that future policy tightening will be required. As Germany is the euro area’s largest economy, weaker-than-expected inflation there carries significant weight for broader eurozone policy expectations. While markets still anticipate that interest rates set by the European Central Bank will remain unchanged through 2026, traders have slightly scaled back expectations for a potential rate hike in 2027. This reassessment reflects reduced concern that inflationary pressures will re-emerge as strongly as previously thought, making the euro marginally less attractive on a forward-looking yield basis.
Australia (AUD): Sticky inflation supports a ‘higher for longer’ stance
In Australia, November CPI data came in softer than expected, signalling some easing in inflationary pressure. However, inflation remains above the Reserve Bank of Australia’s 2% to 3% target range and is not declining quickly enough to justify a shift toward rate cuts. While inflation is no longer accelerating, it has proven sticky, indicating that underlying price pressures remain persistent rather than resolved. This dynamic places the RBA in a “higher for longer” policy position, where rates are likely to remain restrictive for an extended period. As a result, expectations for near-term easing have been pushed back, helping to underpin the Australian dollar despite softer headline inflation data.
Key takeaway for readers
Across regions, currency movements continue to be driven less by individual data points and more by how those data shape relative interest rate expectations. Whether it is US labor market resilience, persistent yield differentials favoring the dollar, softer European inflation dampening future tightening, or sticky Australian inflation delaying rate cuts, foreign exchange markets remain firmly anchored to the outlook for monetary policy rather than short-term noise.

USDCHF RANGE TRADE LONGSUSDCHF has been trading in the range highlighted since July it looks like we have found support at the bottom of this and buyers have started the next leg up back to the upper bounds of the range

GBPUSD – H4 Supply & Demand | Bearish TrendGBPUSD has reacted into H4 supply and delivered a bearish Break of Structure, confirming a shift in market structure.
Price has swept internal sell-side liquidity but failed to reclaim bullish structure, suggesting continuation rather than reversal.
Bias: Bearish
Idea: Sell rallies into H4 or refined lower-timeframe supply
Targets: Liquidity lows below
Invalidation: Strong reclaim above H4 supply
As long as price remains below supply, the **path of least resistance remains to the downside**.

xauusd whats next?XAU/USD – Comprehensive Technical Indicator Review
Date: January 5, 2026
Spot Reference: ~$4,404
Primary Regime: Structural Bull Market
Secondary Regime: Short-term consolidation / digestion
1. Multi-Timeframe Market Structure
Weekly Timeframe
Structure: Higher highs and higher lows intact for 14 consecutive months.
Candle Anatomy: Recent weekly candles show large real bodies with shallow upper wicks, indicating strong acceptance of higher prices rather than exhaustion.
Market Phase: Late-stage trend expansion, not distribution.
Key Observation: No weekly bearish engulfing, no volume climax, no trendline violation.
Conclusion (Weekly): Bull trend intact; pullbacks are corrective unless $4,200–$4,250 breaks.
Daily Timeframe
Channel: Ascending channel remains valid; price is currently trading in the upper half, not at channel resistance.
Impulse vs Correction: The 2025 rally leg was impulsive; current action is corrective but shallow (bullish characteristic).
Daily Candle Behavior: Small-bodied candles with overlapping ranges = consolidation, not reversal.
Conclusion (Daily): Bullish continuation bias with consolidation flagging, not topping.
4H Timeframe
Micro-Structure: Higher low at ~$4,373 confirmed.
Bear Flag Failure: The flagged pattern failed due to lack of follow-through volume and rapid reclaim of VWAP and mid-range.
Acceptance: Price holding above prior breakout zone suggests re-accumulation.
Conclusion (4H): Neutral-to-bullish, with breakout risk skewed upward.
2. Momentum Indicators
RSI (14)
Current: ~64.7
Interpretation:
In strong bull trends, RSI often oscillates between 60–75.
RSI has reset from overbought without breaking below 55, a classic continuation signal.
Divergence: No bearish divergence on Daily or 4H.
Signal: Bullish momentum remains intact; no exhaustion yet.
Stochastic RSI
Daily: Cycling between 40–70 range.
4H: Recently exited oversold and crossed upward.
Key Point: In trending markets, Stoch RSI staying elevated is bullish, not bearish.
Signal: Momentum is rebuilding rather than rolling over.
MACD (12,26,9)
Daily MACD
Histogram: Contracting but still positive.
MACD Line: Above signal line; no bearish cross.
Slope: Flattening, not reversing.
4H MACD
Recent Bullish Cross: Occurred near $4,380–$4,390.
Histogram Expansion: Mild but improving.
Signal: Consolidation pause within trend, not momentum breakdown.
3. Trend & Volatility Indicators
Moving Averages
MA Level Interpretation
20-DMA ~$4,385 Dynamic intraday support
50-DMA ~$4,350 Strong trend confirmation
100-DMA ~$4,295 Structural support
200-DMA Much lower Long-term trend unquestioned
MA Stack: Bullishly aligned (short > medium > long).
Distance from 50-DMA: Elevated but acceptable given macro regime.
Signal: Trend strength confirmed; no mean-reversion trigger yet.
Average True Range (ATR)
Daily ATR: Elevated relative to 6-month average.
Implication: Wider stop placement required; tight stops vulnerable.
Behavior: Volatility expansion favors continuation, not range collapse.
Signal: Expect large candles post-breakout.
Bollinger Bands (20, 2)
Price Position: Riding upper band, not snapping back.
Band Width: Expanding again after brief contraction.
Mean Reversion Risk: Low while bands expand upward.
Signal: Volatility expansion favors upside continuation.
4. Volume & Participation
Volume Profile (Visible Range)
Point of Control (POC): ~$4,395–$4,405
High Volume Node: Current price area.
Low Volume Above: Thin liquidity between $4,440 and $4,520.
Implication: Once $4,441 breaks, price can move quickly.
On-Balance Volume (OBV)
Trend: Making higher highs with price.
Divergence: None.
Interpretation: Institutions are accumulating, not distributing.
VWAP (Anchored)
Monthly VWAP: Below current price.
Weekly VWAP: Acting as intraday support.
Behavior: Price respecting VWAP from above = bullish control.
5. Market Internals & Correlations
Gold vs USD Index (DXY)
Correlation: Inverse, but weakening.
Key Insight: Gold rising even on stable USD = safe-haven dominance.
Gold vs Real Yields
Decoupling Observed: Gold holding gains despite mildly firm yields.
Interpretation: Structural demand overriding rate mechanics.
6. Fibonacci Analysis (Last Major Leg)
0.236 Retracement: ~$4,365
0.382 Retracement: ~$4,310
0.5 Retracement: ~$4,265
Price has not even tested 0.236, a strong trend characteristic.
7. Probability Assessment (Technical Only)
Scenario Probability
Bullish continuation above $4,441 ~65%
Range consolidation $4,370–$4,440 ~25%
Deeper correction below $4,313 ~10%
8. Technical Bottom Line
From a pure technical standpoint:
No topping signals are present
Momentum is consolidating, not reversing
Volume and volatility favor expansion
Failed bearish patterns increase upside odds
Any dips above $4,370 remain buy-the-dip territory

USDJPY: Breakout & Bullish Continuation 🇺🇸🇯🇵
There is a high probability that USDJPY will rise more,
following a confirmed breakout of a key daily horizontal resistance.
The next strong key level is 157.6.
It will most likely be the next goal for the buyers.
❤️Please, support my work with like, thank you!❤️
I am part of Trade Nation's Influencer program and receive a monthly fee for using their TradingView charts in my analysis.

Bullish Dollar98.50 resistance overhead.
If DXY pushes above that it will signal a potential bulltrend restarting. We are on huge multi-decade support. Been forming a scooping bottoming formation since the summer, with RSI positive divergences building.
Wall Street consensus says the yellow path will happen.
The USD will be weak in Q1 and Q2 2026 and then rebound in the last half of the year.
- Are they wrong?
- I think they are, and the green path is in play catching people off guard.

Dollar Index Respects Trend Support — Buyers in Control💵 DXY DOLLAR INDEX | Swing Trade Setup 📊
Strategic Bullish Recovery with Multi-Layer Entry Strategy
📈 CURRENT MARKET STATUS
Current Price: 98.02 - 98.36 USD 📍 | Bias: BULLISH SWING TRADE 🟢 | Timeframe: 4H-Daily Swing Trade ⏰ | Market Condition: Pullback to Support Zone 💪
🎯 TECHNICAL SETUP
Plan: Bullish breakout from triangular moving average pullback with strong support confirmation from the 97.50-97.90 demand zone. 📉➡️📈
📍 MULTI-LAYER ENTRY STRATEGY (Thief Strategy)
Using Limit Order Layering - Scale-In Approach for Risk Management
Utilize multiple buy limit orders to reduce entry risk and maximize fill probability:
🔵 Layer 1 @ 97.60 📍 - 30% Position Size - Initial Entry at Strong Support ✅
🔵 Layer 2 @ 97.70 📍 - 30% Position Size - Secondary Level Confirmation ✅
🔵 Layer 3 @ 97.80 📍 - 25% Position Size - Tertiary Entry Momentum Build 📈
🔵 Layer 4 @ 97.90 📍 - 15% Position Size - Final Layer Aggressive Entry 🚀
✅ Pro Tip: Adjust layer prices based on your risk tolerance and account size. Scalable entry reduces overall trade risk and improves entry quality significantly. 💡
🛑 STOP LOSS
🔴 Hard SL @ 97.50 📍 - Below demand zone for protection 🛡️
📊 Risk: -50 pips maximum per trade 📉
⚠️ NOTE: Stop loss placement is your personal risk decision. Dear Ladies & Gentleman (Thief OG's) - Manage your own risk parameters accordingly. This is YOUR choice, YOUR responsibility, YOUR profit or loss. 🎯
🎁 PROFIT TARGETS
🟢 Target 1 (Easy Win) @ 98.30 📍 - +50 pips 💰 - Take 25% profit and lock in gains immediately ✅
🟢 Target 2 (Main Target) @ 98.60 📍 - +80 pips 💵 - Take 40% profit at moving average resistance zone 📊
🟢 Target 3 (Extended) @ 98.80 📍 - +100 pips 🤑 - Trailing stop on remaining 35% position for momentum capture 🚀
🟢 Target 4 (Aggressive) @ 99.00+ 📍 - +130+ pips 🎊 - Let your winners run with intelligent trailing stops for maximum profit 📈
⚠️ NOTE: High voltage electric gate acts as STRONG RESISTANCE + overbought zone detected at 98.50-98.70. This is a potential market TRAP zone - please take profits responsibly and don't get greedy. Final TP is YOUR personal choice based on YOUR strategy and risk appetite. 🎲
💡 TECHNICAL ANALYSIS BREAKDOWN
Bullish Confluence Factors ✅:
✅ Strong support from 97.50-97.90 demand zone (Historical reaction area proven) 📍
✅ Triangular moving average confirmation (Key technical indicator) 📊
✅ Pullback from overbought conditions (Healthy correction setup) 🔄
✅ Potential base formation pattern (Accumulation zone visible) 🏗️
⚡ 52-week range: 96.22 - 110.18 (Plenty of room for upside movement) 📈
Risk Factors to Monitor ⚠️:
⚠️ Overbought signals at 98.50-98.70 (Strong resistance overhead) 🚧
⚠️ Market trap potential (Price rejection very possible) 🪤
⚠️ Thin year-end trading volumes (Additional volatility risk) 📉
🌍 RELATED PAIRS TO WATCH (Dollar Correlation Analysis)
HIGH NEGATIVE CORRELATION 🔴 (Inverse to DXY - If DXY up, these go down):
🔗 EUR/USD - Correlation: -0.95 ⚡ (STRONGEST HEDGE PAIR) - EUR is 57.6% of DXY weight, watch for BrexitNews & ECB statements 📢
🔗 Gold (XAUUSD) - Correlation: -0.90 ⚡ (Safe-haven inverse) - Precious metals rise when USD weakens, strong economic indicator 💛
🔗 Crude Oil (XTIUSD) - Correlation: -0.75 ⚡ (Commodity proxy) - Weaker dollar = higher oil prices, OPEC decisions matter 🛢️
🔗 Silver (XAGUSD) - Correlation: -0.88 ⚡ (Precious metals) - Follows gold closely but with more volatility, watch industrial demand 🏭
🔗 Bitcoin (BTCUSD) - Correlation: -0.65 ⚡ (Crypto hedge) - Dollar weakness = crypto strength, watch Fed policy closely 🪙
OTHER MAJOR PAIRS 📊 (Direct constituents of DXY Index):
🔗 USD/JPY - DXY Weight: 13.6% 📊 - Currently 156.44 - Watch BOJ (Bank of Japan) statements + Yen carry trades 🇯🇵
🔗 GBP/USD - DXY Weight: 11.9% 📊 - Brexit dynamics remain + BoE policy movements important 🇬🇧
🔗 USD/CAD - DXY Weight: 9.1% 📊 - Oil-sensitive pair, commodity correlations + BoC rate decisions 🇨🇦
🔗 USD/SEK - DXY Weight: 4.2% 📊 - Nordic economy barometer + Riksbank policy 🇸🇪
🔗 USD/CHF - DXY Weight: 3.6% 📊 - Safe-haven currency pair, SNB decisions matter 🇨🇭
📰 FUNDAMENTAL FACTORS & ECONOMIC DRIVERS
🔴 HIGH IMPACT CATALYSTS (Coming Up)
📌 FOMC Minutes Release ⏰ - CRITICAL for USD direction 🚨 - Expected guidance on 2026 rate cuts (2 cuts currently priced in by markets) 📉 - Dovish bias would support DXY weakness, hawkish would support strength 📊
📌 Fed Chair Announcement (Early January 2026) - Trump administration to announce Powell's successor 👔 - Market uncertainty = potential big USD volatility swings 💥 - Could change entire policy expectations for 2026 🎯
📌 US Non-Farm Payroll (NFP) (First Friday of Each Month) 👥 - Strong employment data = Bullish for USD 📈 - Weak employment data = Bearish for USD 📉 - Previous trend showing mixed signals, watch closely 🔍
📌 US CPI Release (Mid-month Inflation Data) 📊 - Inflation currently at 2.7% (Dec 18, 2025 data) 📍 - Below Fed target of 3%, supports rate-cut narrative 🎯 - This weakens USD support structure 📉
📌 US Pending Home Sales 🏠 - Already jumped +3.3% in November = Bullish economic indicator ✅ - Consumer strength supports USD flows 💪
🟠 MACRO HEADWINDS PRESSURING DXY (Current Environment)
💨 2025 Dollar Decline - Already down -9.6% year-to-date (worst year since 2017!) 📉 - This is a major structural weakness signal for USD
💨 Trump Tariff Uncertainty - Aggressive tariff policies creating significant dollar weakness 📉 - Protectionism narrative reduces USD safe-haven demand 🚫
💨 Fed Independence Concerns - Political pressure on Federal Reserve reduces hawkish USD support 📢 - Powell successor uncertainty adds volatility 🎲
💨 Rate Differential Narrowing - Other central banks holding rates higher relative to US expectations 📊 - Makes USD less attractive on yield basis 💰
💨 Fiscal Deficit Concerns - US government spending pressures mounting 🏛️ - Structural USD weakness risk for 2026 ⚠️
🟢 BULLISH DXY FACTORS (Supporting Our Trade)
💪 Stronger GDP - Q3 GDP data came in strong, showing economic resilience 📈 - Manufacturing sector showing signs of recovery 🏭
💪 Labor Market Resilience - Despite recent volatility, employment remains relatively stable 👥 - Fewer major job losses than expected 📊
💪 Safe-Haven Demand - Geopolitical tensions support USD flows into safe assets 🛡️ - Middle East conflicts, Russia-Ukraine ongoing ⚠️
💪 Real Yield Attractiveness - US 10Y Treasury yield at 4.13% is attractive vs. peer nations 💰 - Investors seeking better returns flowing to USD 📈
💪 Month-End Flows - Potential technical bounces from dollar repositioning happening now 📊 - Year-end rebalancing creates support zones 🎯
📊 HISTORICAL CONTEXT & KEY LEVELS
🔵 96.22 - 52-week LOW (October 2025) - Major support zone 📍
🔵 97.50-97.90 - DEMAND ZONE (Our current trade setup area) ✅ - Strong historical reaction level 📊
🔵 98.30-98.70 - RESISTANCE ZONE (Strong overbought area with trap potential) 🚧 - Take profits here, don't be greedy 💡
🔵 99.00 - Psychological round number resistance 📍 - Major price target for aggressive traders 🎯
🔵 110.18 - 52-week HIGH (February 2025 event-driven spike) - Distant target for extended bull 🚀
🎲 RISK MANAGEMENT CHECKLIST (Must Do)
✅ Only risk 1-2% of your account per single trade 💰 - Never go all-in, always protect capital 🛡️
✅ Use stop loss without ANY exceptions 🛑 - No emotional decisions, pre-set your exit 📍
✅ Scale into positions with limit orders 📊 - Don't chase market price, let price come to you 🎯
✅ Monitor FOMC announcements closely 📢 - Set alerts for important economic releases 🔔
✅ Watch geopolitical news (Fed, Trump statements) 📰 - Breaking news can reverse markets instantly ⚡
✅ Take profits at resistance levels 💹 - Lock in gains, don't let winners turn into losers 📈
✅ Don't add to losing positions 🚫 - Patience is key, better opportunities always come 🎯
✅ Keep detailed records of all entries/exits 📝 - Track your performance and improve continuously 📊
⚡ TRADE PLAN SUMMARY
🎯 Setup: Swing trade LONG on DXY from demand zone 97.50-97.90 📍
🎯 Entry Method: 4-layer limit order strategy (Scale-in approach recommended) 📊
🎯 Stop Loss: Hard stop at 97.50 (No exceptions, no moving it) 🛑
🎯 Profit Targets: 98.30 (T1) → 98.60 (T2) → 98.80 (T3) → 99.00+ (T4) 🎁
🎯 Risk/Reward Ratio: Approximately 1:1.6 to 1:2.6 depending on which layer you enter 💹
🎯 Timeframe: 4H-Daily swing trade (3-7 trading days typical duration) ⏰
🎯 Conviction Level: MEDIUM-HIGH (Technical confluence + demand zone + economic setup) 📈
🟢 PROBABILITY EDGE SUMMARY
This setup combines multiple confluence factors for higher probability:
📊 Technical Setup - EMA pullback + demand zone confirmation
🏗️ Structural Setup - Triangular pattern + base formation
😊 Sentiment Setup - Oversold conditions creating bounce opportunity
📈 Fundamental Setup - Rate expectations + economic data supporting
Estimated Win Rate: 55-60% (Based on confluence factors, not guaranteed) 📈
Risk/Reward Ratio: Minimum 1:2.0 target recommendation 💰
Best Trading Sessions: New York + London overlap (9am-12pm EST) ⏰
💬 FINAL THOUGHTS FOR TRADERS
Dear Ladies & Gentleman (Thief OG's) 🎩 - This is a carefully crafted setup based on real market data and technical confluence. However, markets are always unpredictable. Your discipline in following your trading plan matters MORE than being right 100% of the time.
Trade responsibly. Manage your risk. Take your profits. Protect your capital. 💪
The best traders aren't the ones who win every trade - they're the ones who survive and profit over time through disciplined risk management and emotional control. 🎯
Good luck traders! May your profits flow like the currency you're trading! 📈💰
Remember: Your broker, your rules. Your strategy, your risk. Adjust all levels to match YOUR trading plan perfectly. ✅

DXY dollar index YEARLY ANALYSISDXY or Dollar index suggestets that it is in a very critical position. and movement to the up or down will be a breakout.

Interesting action in DXYCould we be in for a long decrease in dollar value as DXY rejects new level?

XAUUSD Gold - Gann Square of Nine Chart DailySome price and time projections using june to dec solstice time period via gann square of nine method. (lite finance)
6227.74 price level correlates to 1.618 fib extension.
Support at 4314, 4301, 3886, 3872.
should we correct before going to past 5K
TZ at 4430-4380 (unlikely transient zone->possible recurrent price action)
Price is likely to return to 4430-4380 but doesn't mean it will-

EURUSD: Support & Resistance Analysis for Next Week 🇪🇺🇺🇸
Here is my latest structure analysis and important
supports & resistances for EURUSD for next week.
Consider these structures for pullback/breakout trading.
❤️Please, support my work with like, thank you!❤️
I am part of Trade Nation's Influencer program and receive a monthly fee for using their TradingView charts in my analysis.

XAUUSD Gold to 5K
Another breakout amist a growing pattern of buildup- major conflict inbound and the USD is being tested. The world will not pay (inflation) by supporting it's debt system (bond market)
The dollar is being dumped. The debt bubble is popping. (Potentially) The conflict is causing the issue and the issue is causing (by) the global criminal syndicate of power. (the banking system)
He who controls the most debt controls the world; Proverbs Chapter 22:7 The Rich Rule Over the Poor and the Borrower (the Government) is Slave to the Lender (the Central Bank)
The national debt is the debt (infinite) issued by the bond holders- which is simply currrency for the slaves. They don't issue out stock- they sell the country's resources. And as such- War is a Racket- (Smedley Darlington Butler) It flips countries so they can plunder thier resources.
The CIA works for them; not for you, you pay with your blood through war. They directly tax (income tax) you like kings- they own you. (slaves/borrowers) (George Carlin) they own the government, the government is there to keep you in line and give you the illusion of control.
They own the system; they own every member (your representatives) and if they don't; they have the power to get rid of them. Every corporate news piece is there to keep you in the dark. Nothing gets out beyond the system. (cults) They're infested in virutally every neighborhood (police) and now they're leveraging technology to further thier power.
And now they want full control, they want systems to govern your every step and they will scare you into them as they please. They want full control of the world. The end.

USDSGD LongHello traders, I just noticed this setup. It seems the price for second time breaks the trendline. We have also a good support formed on levels between 1.2915/1.2935. In my opinion it will be a fake double top pattern which already formed by breaking the trendline, thus I remain long on this pair.

DXY Bullish Continuation Inside Ascending ChannelThe U.S. Dollar Index is trading within a clear ascending channel showing a sustained bullish structure after forming a strong low near 97.87. Price respected the lower trendline and printed multiple CHoCH and BOS signals confirming a shift from bearish to bullish momentum. Currently DXY is consolidating around 98.62–98.65 holding above the key 0.382–0.5 Fibonacci retracement zone which acts as a strong demand area.
The recent pullback looks corrective targeting liquidity before continuation. As long as price holds above 98.20–98.30 the bias remains bullish with upside targets toward the weak high near 99.00–99.20 aligned with the -0.382 and -0.618 Fibonacci levels. A clean breakout above this zone could accelerate further upside while a breakdown below channel support would weaken the bullish outlook.
Note
Please risk management in trading is a Key so use your money accordingly. If you like the idea then please like and boost. Thank you and Good Luck!

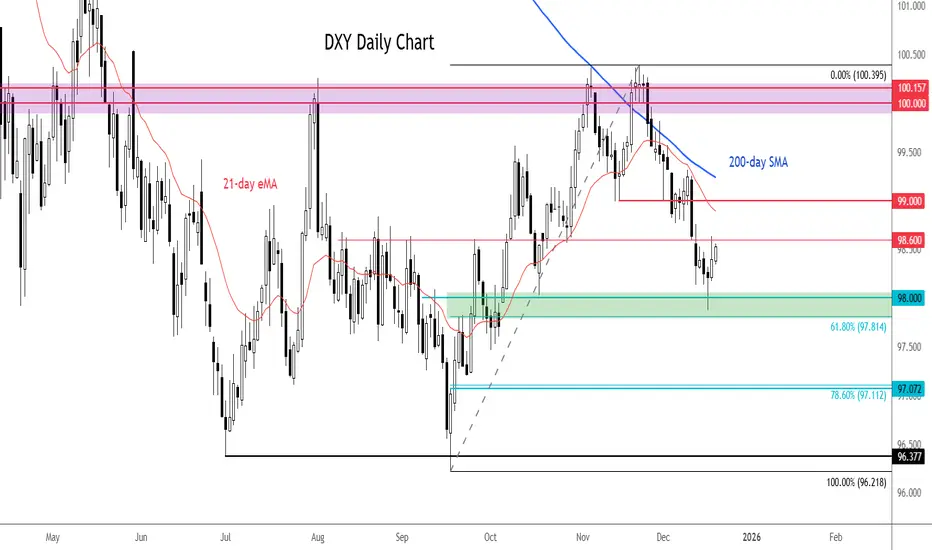
Dollar index levels to watch ahead of CPI, ECB and BOJAhead of today's release of US CPI and the upcoming rate decisions by the ECB and BOJ, the dollar index has stabilised slightly this week, although the broader picture remains one of consolidation with a downside bias.
The failure to break above the 100.00–100.40 resistance zone in November — an area that also capped gains in August — reinforced a pattern of lower highs and lower lows.
Since then, the index has broken below former support at 99.00 and 98.60, both of which now act as near-term resistance. As long as price remains below these levels, downside risks remain dominant despite recent stabilisation.
Initial support sits around 98.00, close to the 61.8% Fibonacci retracement at 97.81. A sustained break lower would expose the 97.00 level, with the next key support zone around the July–September lows near 96.20–96.40. Overall, rallies continue to look corrective unless the index can reclaim 99.00 decisively.
By Fawad Razaqzada, market analyst with FOREX.com
US DOLLAR ANALYSISOn the weekly chart, the US Dollar Index is clearly trading in a long-term bearish structure. Price has been moving under a strong descending trendline that has capped every major rally since the 2022 high, showing that sellers remain active at higher levels. After the sharp rejection near the 110 area earlier in 2025, the dollar dropped aggressively and broke below the important 100–101 support zone, which had previously acted as a strong demand area. Although price attempted to stabilize and briefly retested this zone, it failed to reclaim it, confirming that former support has now turned into resistance. The recent candles show weak upside momentum and consolidation below this key level, which signals continuation weakness rather than strength. As long as the index remains below the descending trendline and the 100–101 resistance zone on a weekly closing basis, the broader bias stays bearish, with downside pressure still dominant and no clear sign of a long-term reversal yet.

SHORT ON NZD/USDNZD/USD has given us a choc to the downside after breaking a nice rising channel which is a bearish reversal pattern.
I will be selling N/U looking to make 150-200 pips.

What's ahead for the NEW YEAR 26'?TVC:DXY
Becoming Profitable in the Auction, is a choice only chosen by the 'PROFITABLE'...
As of today the U.S. Dollar Index (DXY) has fallen significantly around -9.5% to -10% year-to-date, marking its worst performance in decades due to expectations of U.S. interest rate cuts and a strengthening global economy. Now the question is, What's ahead for the DOLLAR? Will it continue to weaken for the year of 2026 or gain back strength? What are your thoughts, lmk in the comments...
Continued Success,
TreyHighPwr
