GOLD Sellers In Panic! BUY!
My dear friends,
Please, find my technical outlook for GOLD below:
The price is coiling around a solid key level - 4164.3
Bias - Bullish
Technical Indicators: Pivot Points Low anticipates a potential price reversal.
Super trend shows a clear buy, giving a perfect indicators' convergence.
Goal - 4176.6
Safe Stop Loss - 4157.5
About Used Indicators:
The pivot point itself is simply the average of the high, low and closing prices from the previous trading day.
Disclosure: I am part of Trade Nation's Influencer program and receive a monthly fee for using their TradingView charts in my analysis.
———————————
WISH YOU ALL LUCK
E-signal

GOLD Consolidation Starts (Correction zone) Buyers Slow ExitNow after the all time high of 3482.
GOLD enters into a Consolidation zone Starts or (Correction zone) Buyers Slow Exit.
So at current market price 4180 Sell and again buy at 4000 and again sell at 4170 range and again buy at 3890 and again sell at 4050 and again buy at 3890 and again sell at 4160 and again buy at 3737.
This is for Education Purpose only, am still testing WD Gann theory!

GOLG SMC BUY IDEA 4160 DEMAND ZONE📌 SMC Buy-Side Idea (XAUUSD) — Entry 4160
Bias: Bullish
Timeframe: 15m
🔍 Market Structure
Market has broken previous structure with a clean BOS, confirming bullish order flow.
Price retraced back into the 15m Demand Zone (IDM).
4160 is sitting inside discount pricing, aligned with HL formation.
🟦 Entry Plan
Buy Limit: 4160 zone (inside 15m Demand)
Stop Loss: Below HL / Below the demand rejection
Take Profit: Three partial exits
🎯 Targets (3-Stage TP Distribution)
TP1: 4175
TP2: 4185
TP3 (Final): 4200
💡 Why Buy at 4160?
4160 = Perfect discount level
Confluence with 15m demand + IDM
Bullish BOS already printed
Liquidity above HH targeting 4200
📈 Expectation
If bulls defend 4160 demand, price should move toward 4175 → 4185 → 4200, sweeping all buy-side liquidity.

BTCUSDT.P - November 28, 2025Bitcoin is in a short‑term uptrend, riding a rising trendline after breaking out from prior consolidation and now pressing into a well‑defined resistance band around 92,100–92,600.
The chart outlines a tactical long setup with support around 90,100–90,200 as the key pivot; holding above this zone favors continuation toward the higher resistance/target region near 94,500–95,000, while a clean break back below the trendline would invalidate the bullish structure and open room for a deeper pullback.

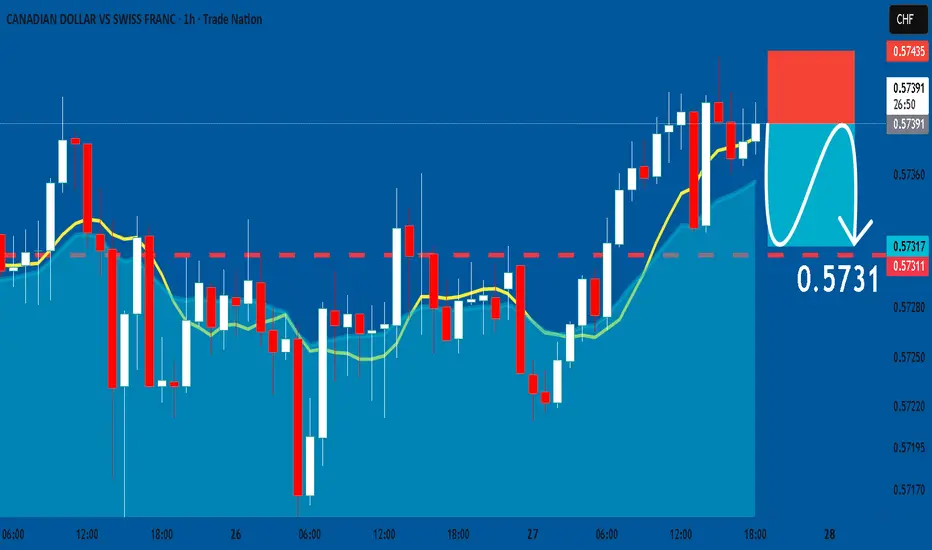
CADCHF: Bearish Continuation & Short Signal
CADCHF
- Classic bearish formation
- Our team expects pullback
SUGGESTED TRADE:
Swing Trade
Short CADCHF
Entry - 0.5739
Sl - 0.5743
Tp - 0.5731
Our Risk - 1%
Start protection of your profits from lower levels
Disclosure: I am part of Trade Nation's Influencer program and receive a monthly fee for using their TradingView charts in my analysis.
❤️ Please, support our work with like & comment! ❤️
AUDJPY Trading Opportunity! BUY!
My dear followers,
I analysed this chart on AUDJPY and concluded the following:
The market is trading on 100.92 pivot level.
Bias - Bullish
Technical Indicators: Both Super Trend & Pivot HL indicate a highly probable Bullish continuation.
Target - 101.16
Safe Stop Loss - 100.81
About Used Indicators:
A super-trend indicator is plotted on either above or below the closing price to signal a buy or sell. The indicator changes color, based on whether or not you should be buying. If the super-trend indicator moves below the closing price, the indicator turns green, and it signals an entry point or points to buy.
Disclosure: I am part of Trade Nation's Influencer program and receive a monthly fee for using their TradingView charts in my analysis.
———————————
WISH YOU ALL LUCK

CADJPY Will Collapse! SELL!
My dear followers,
This is my opinion on the CADJPY next move:
The asset is approaching an important pivot point 111.45
Bias - Bearish
Safe Stop Loss - 111.62
Technical Indicators: Supper Trend generates a clear short signal while Pivot Point HL is currently determining the overall Bearish trend of the market.
Goal - 111.13
About Used Indicators:
For more efficient signals, super-trend is used in combination with other indicators like Pivot Points.
Disclosure: I am part of Trade Nation's Influencer program and receive a monthly fee for using their TradingView charts in my analysis.
———————————
WISH YOU ALL LUCK

GBPNZD Massive Long! BUY!
My dear subscribers,
My technical analysis for GBPNZD is below:
The price is coiling around a solid key level - 2.3126
Bias - Bullish
Technical Indicators: Pivot Points Low anticipates a potential price reversal.
Super trend shows a clear buy, giving a perfect indicators' convergence.
Goal - 2.3243
About Used Indicators:
By the very nature of the supertrend indicator, it offers firm support and resistance levels for traders to enter and exit trades. Additionally, it also provides signals for setting stop losses
Disclosure: I am part of Trade Nation's Influencer program and receive a monthly fee for using their TradingView charts in my analysis.
———————————
WISH YOU ALL LUCK

GBPAUD Technical Analysis! BUY!
My dear friends,
My technical analysis for GBPAUD is below:
The market is trading on 2.0266 pivot level.
Bias - Bullish
Technical Indicators: Both Super Trend & Pivot HL indicate a highly probable Bullish continuation.
Target - 2.0284
Recommended Stop Loss - 2.0253
About Used Indicators:
A pivot point is a technical analysis indicator, or calculations, used to determine the overall trend of the market over different time frames.
Disclosure: I am part of Trade Nation's Influencer program and receive a monthly fee for using their TradingView charts in my analysis.
———————————
WISH YOU ALL LUCK

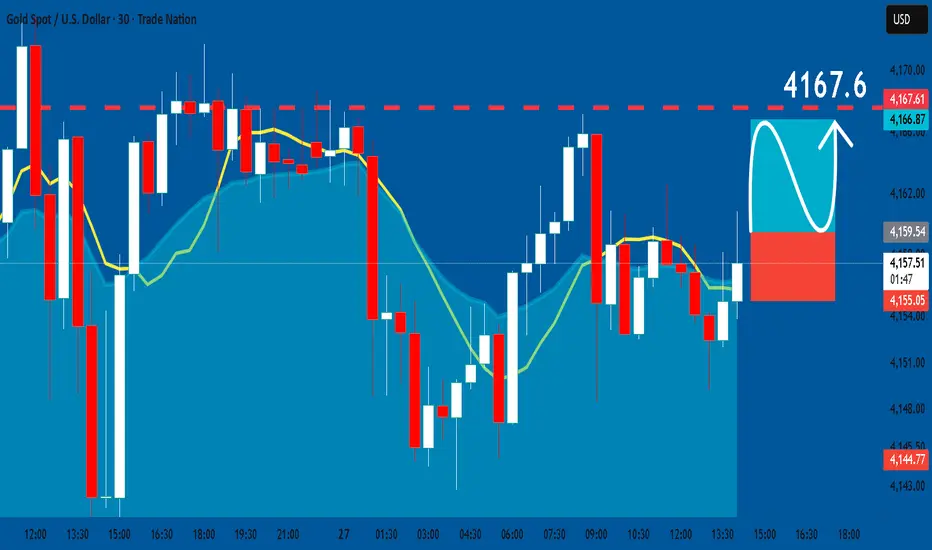
GOLD: Long Trade with Entry/SL/TP
GOLD
- Classic bullish formation
- Our team expects growth
SUGGESTED TRADE:
Swing Trade
Buy GOLD
Entry Level - 4159.5
Sl - 4155.0
Tp - 4167.6
Our Risk - 1%
Start protection of your profits from lower levels
Disclosure: I am part of Trade Nation's Influencer program and receive a monthly fee for using their TradingView charts in my analysis.
❤️ Please, support our work with like & comment! ❤️
EURUSD My Opinion! SELL!
My dear followers,
I analysed this chart on EURUSD and concluded the following:
The market is trading on 1.1593 pivot level.
Bias - Bearish
Technical Indicators: Both Super Trend & Pivot HL indicate a highly probable Bearish continuation.
Target - 1.1569
About Used Indicators:
A super-trend indicator is plotted on either above or below the closing price to signal a buy or sell. The indicator changes color, based on whether or not you should be buying. If the super-trend indicator moves below the closing price, the indicator turns green, and it signals an entry point or points to buy.
Disclosure: I am part of Trade Nation's Influencer program and receive a monthly fee for using their TradingView charts in my analysis.
———————————
WISH YOU ALL LUCK

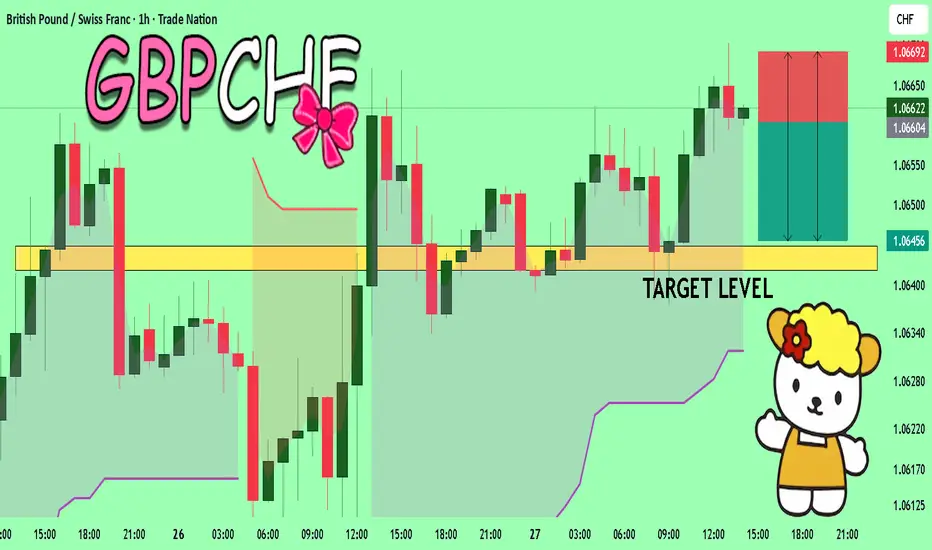
GBPCHF Set To Fall! SELL!
My dear subscribers,
GBPCHF looks like it will make a good move, and here are the details:
The market is trading on 1.0660 pivot level.
Bias - Bearish
My Stop Loss - 1.0669
Technical Indicators: Both Super Trend & Pivot HL indicate a highly probable Bearish continuation.
Target - 1.0644
About Used Indicators:
The average true range (ATR) plays an important role in 'Supertrend' as the indicator uses ATR to calculate its value. The ATR indicator signals the degree of price volatility.
Disclosure: I am part of Trade Nation's Influencer program and receive a monthly fee for using their TradingView charts in my analysis.
———————————
WISH YOU ALL LUCK
AUDJPYHello Traders,
We are waiting for a confirmation from CPI news! Any big surprise means we should not trade against it!
This is out Daily Chart!
A bullish chart it really is!
We are searching for middle of the channel to react!
The trend-line could be used as Liquidity hunt!


BTCUSDT.P - November 27, 2025On the 15-minute chart for Bitcoin, price is in a strong short-term uptrend, marked by a steep series of higher highs and higher lows culminating in a parabolic push into local resistance around 91,800–92,300. The latest candles show upper wicks and a loss of follow-through, indicating fading bullish momentum and the risk of a pullback. A corrective move toward the nearest intraday support band around 89,700–90,100 would be a normal retracement within the broader advance, and aggressive longs may look to reduce risk while conservative traders wait for a reaction at that support zone before re-entering.

Gold baby !!!Back with quick gold prediction for the next couple of hours
Looking for gold to at least take out that low that I have illustrated on my chart using the line arrow tool
I set a weighted vwap on the demand zone to see where it could possibly go before my predicted drop
Good luck traders !!! Don't forget a SL

EURUSD My Opinion! BUY!
My dear friends,
Please, find my technical outlook for EURUSD below:
The instrument tests an important psychological level 1.1515
Bias - Bullish
Technical Indicators: Supper Trend gives a precise Bullish signal, while Pivot Point HL predicts price changes and potential reversals in the market.
Target - 1.1553
About Used Indicators:
Super-trend indicator is more useful in trending markets where there are clear uptrends and downtrends in price.
Disclosure: I am part of Trade Nation's Influencer program and receive a monthly fee for using their TradingView charts in my analysis.
———————————
WISH YOU ALL LUCK

EURJPY A Fall Expected! SELL!
My dear friends,
EURJPY looks like it will make a good move, and here are the details:
The market is trading on 181.10 pivot level.
Bias - Bearish
Technical Indicators: Supper Trend generates a clear short signal while Pivot Point HL is currently determining the overall Bearish trend of the market.
Goal - 180.59
Recommended Stop Loss - 181.39
About Used Indicators:
Pivot points are a great way to identify areas of support and resistance, but they work best when combined with other kinds of technical analysis
Disclosure: I am part of Trade Nation's Influencer program and receive a monthly fee for using their TradingView charts in my analysis.
———————————
WISH YOU ALL LUCK

EURAUD Technical Analysis! SELL!
My dear subscribers,
EURAUD looks like it will make a good move, and here are the details:
The market is trading on 1.7884 pivot level.
Bias - Bearish
Technical Indicators: Both Super Trend & Pivot HL indicate a highly probable Bearish continuation.
Target - 1.7835
About Used Indicators:
The average true range (ATR) plays an important role in 'Supertrend' as the indicator uses ATR to calculate its value. The ATR indicator signals the degree of price volatility.
Disclosure: I am part of Trade Nation's Influencer program and receive a monthly fee for using their TradingView charts in my analysis.
———————————
WISH YOU ALL LUCK

USDCHF: Bullish Continuation & Long Trade
USDCHF
- Classic bullish formation
- Our team expects pullback
SUGGESTED TRADE:
Swing Trade
Long USDCHF
Entry - 0.8041
Sl - 0.8030
Tp - 0.8062
Our Risk - 1%
Start protection of your profits from lower levels
Disclosure: I am part of Trade Nation's Influencer program and receive a monthly fee for using their TradingView charts in my analysis.
❤️ Please, support our work with like & comment! ❤️

USDCAD Expected Growth! BUY!
My dear friends,
USDCAD looks like it will make a good move, and here are the details:
The market is trading on 1.4039 pivot level.
Bias - Bullish
Technical Indicators: Supper Trend generates a clear long signal while Pivot Point HL is currently determining the overall Bullish trend of the market.
Goal - 1.4080
About Used Indicators:
Pivot points are a great way to identify areas of support and resistance, but they work best when combined with other kinds of technical analysis
Disclosure: I am part of Trade Nation's Influencer program and receive a monthly fee for using their TradingView charts in my analysis.
———————————
WISH YOU ALL LUCK

CHFJPY: Short Trading Opportunity
CHFJPY
- Classic bearish pattern
- Our team expects retracement
SUGGESTED TRADE:
Swing Trade
Sell CHFJPY
Entry - 194.10
Stop - 194.40
Take - 193.61
Our Risk - 1%
Start protection of your profits from lower levels
Disclosure: I am part of Trade Nation's Influencer program and receive a monthly fee for using their TradingView charts in my analysis.
❤️ Please, support our work with like & comment! ❤️

NZDUSD The Target Is DOWN! SELL!
My dear subscribers,
This is my opinion on the NZDUSD next move:
The instrument tests an important psychological level 0.5677
Bias - Bearish
Technical Indicators: Supper Trend gives a precise Bearish signal, while Pivot Point HL predicts price changes and potential reversals in the market.
Target - 0.5640
About Used Indicators:
On the subsequent day, trading above the pivot point is thought to indicate ongoing bullish sentiment, while trading below the pivot point indicates bearish sentiment.
Disclosure: I am part of Trade Nation's Influencer program and receive a monthly fee for using their TradingView charts in my analysis.
———————————
WISH YOU ALL LUCK
