BTCUSDT.P - November 19, 2025Price is retesting the short-term resistance trendline and struggling to hold above the 93,000 area, suggesting weakening bullish momentum. A bounce toward the 94,000–95,500 resistance zone is possible, but failure to break higher may trigger a continuation of the broader downtrend toward the 89,000 support region.
E-signal

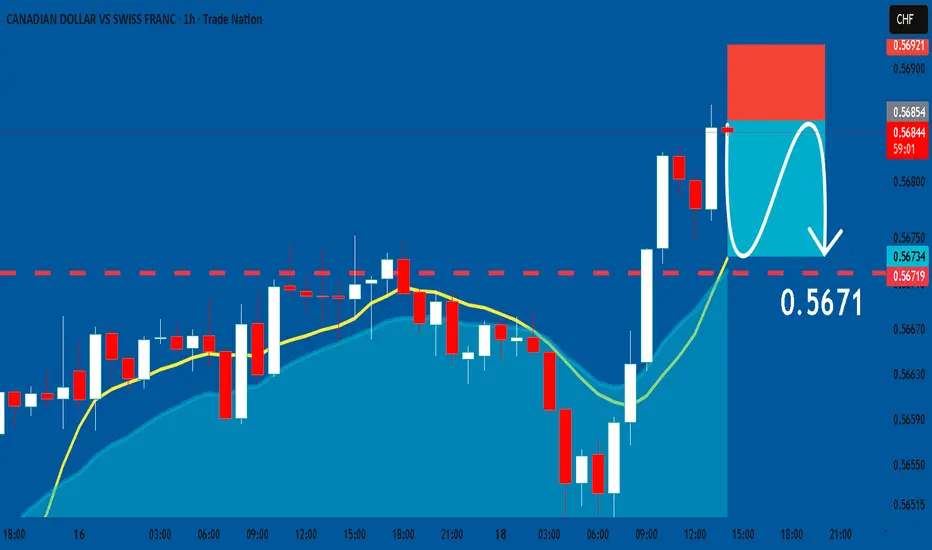
CADCHF: Short Signal with Entry/SL/TP
CADCHF
- Classic bearish formation
- Our team expects pullback
SUGGESTED TRADE:
Swing Trade
Short CADCHF
Entry - 0.5685
Sl - 0.5692
Tp - 0.5671
Our Risk - 1%
Start protection of your profits from lower levels
Disclosure: I am part of Trade Nation's Influencer program and receive a monthly fee for using their TradingView charts in my analysis.
❤️ Please, support our work with like & comment! ❤️
AUDCAD Set To Grow! BUY!
My dear subscribers,
My technical analysis for AUDCAD is below:
The price is coiling around a solid key level - 0.9117
Bias - Bullish
Technical Indicators: Pivot Points Low anticipates a potential price reversal.
Super trend shows a clear buy, giving a perfect indicators' convergence.
Goal - 0.9143
About Used Indicators:
By the very nature of the supertrend indicator, it offers firm support and resistance levels for traders to enter and exit trades. Additionally, it also provides signals for setting stop losses
Disclosure: I am part of Trade Nation's Influencer program and receive a monthly fee for using their TradingView charts in my analysis.
———————————
WISH YOU ALL LUCK

GBPCAD Will Explode! BUY!
My dear friends,
Please, find my technical outlook for GBPCAD below:
The price is coiling around a solid key level - 1.8446
Bias - Bullish
Technical Indicators: Pivot Points High anticipates a potential price reversal.
Super trend shows a clear buy, giving a perfect indicators' convergence.
Goal - 1.8468
Safe Stop Loss - 1.8434
About Used Indicators:
The pivot point itself is simply the average of the high, low and closing prices from the previous trading day.
Disclosure: I am part of Trade Nation's Influencer program and receive a monthly fee for using their TradingView charts in my analysis.
———————————
WISH YOU ALL LUCK

AUDNZD: Bullish Continuation & Long Trade
AUDNZD
- Classic bullish formation
- Our team expects growth
SUGGESTED TRADE:
Swing Trade
Buy AUDNZD
Entry Level - 1.1465
Sl - 1.1458
Tp - 1.1479
Our Risk - 1%
Start protection of your profits from lower levels
Disclosure: I am part of Trade Nation's Influencer program and receive a monthly fee for using their TradingView charts in my analysis.
❤️ Please, support our work with like & comment! ❤️

BTCUSDT.P - November 6, 2025BTCUSDT is currently consolidating above a rising trendline, with potential breakout zones at $104,496 for a bullish move targeting $106,659, or below $102,684 for a bearish continuation toward $101,164. The setup suggests a breakout-driven trade depending on which level is breached first.

QuyetP | Careful Selling JPY Pairs — EURJPY Is Going ATH!Selling /JPY pairs right now just looks wrong.
Momentum is one-way, and OANDA:EURJPY shows it clearly.
Pullbacks get bought almost instantly.
Higher lows keep building — clean, steady pressure.
Intermarket checks line up the same direction:
-Global yields stay elevated → JPY remains weak.
-Risk sentiment stable → yen demand stays low.
-BOJ still hesitant → market keeps pressing the upside.
No drama. No noise. Just a pair that wants higher ground.
QuyetP’s view :
Bias is strongly bullish.
I’m avoiding any sell idea on JPY pairs until this structure breaks — and right now, it’s not even close.
Careful out there — fading this move is a tough bet.

ASTERUSDT.P - November 18, 2025Price is trading within a broad range, with clear resistance around 1.27–1.28 and major support near 1.18–1.19. A descending trendline from recent highs suggests weakening bullish momentum, and the chart implies a possible retest of resistance before a move back toward support.

BTCUSDTP. - November 18, 2025Price is pulling back toward a clear support zone around 93,000, with a deeper support level near 92,000, while the nearest resistance sits around 96,200 along a descending trendline. The chart suggests a possible bounce from support toward resistance, but a break below 93,000 could open the way toward 92,000.
If trading this setup, the long scenario is higher-risk, as price is currently trending downward into support and could continue lower before reversing.

GBPNZD: Bearish Continuation & Short Trade
GBPNZD
- Classic bearish pattern
- Our team expects retracement
SUGGESTED TRADE:
Swing Trade
Sell GBPNZD
Entry - 2.3248
Stop - 2.3287
Take - 2.3187
Our Risk - 1%
Start protection of your profits from lower levels
Disclosure: I am part of Trade Nation's Influencer program and receive a monthly fee for using their TradingView charts in my analysis.
❤️ Please, support our work with like & comment! ❤️

EURUSD Sellers In Panic! BUY!
My dear subscribers,
EURUSD looks like it will make a good move, and here are the details:
The market is trading on 1.1601 pivot level.
Bias - Bullish
My Stop Loss - 1.1593
Technical Indicators: Both Super Trend & Pivot HL indicate a highly probable Bullish continuation.
Target - 1.1617
About Used Indicators:
The average true range (ATR) plays an important role in 'Supertrend' as the indicator uses ATR to calculate its value. The ATR indicator signals the degree of price volatility.
Disclosure: I am part of Trade Nation's Influencer program and receive a monthly fee for using their TradingView charts in my analysis.
———————————
WISH YOU ALL LUCK

GOLD: Long Signal Explained
GOLD
- Classic bullish formation
- Our team expects pullback
SUGGESTED TRADE:
Swing Trade
Long GOLD
Entry - 4077.1
Sl - 4066.2
Tp - 4094.8
Our Risk - 1%
Start protection of your profits from lower levels
Disclosure: I am part of Trade Nation's Influencer program and receive a monthly fee for using their TradingView charts in my analysis.
❤️ Please, support our work with like & comment! ❤️

EURNZD Massive Long! BUY!
My dear subscribers,
This is my opinion on the EURNZD next move:
The instrument tests an important psychological level 2.0428
Bias - Bullish
Technical Indicators: Supper Trend gives a precise Bullish signal, while Pivot Point HL predicts price changes and potential reversals in the market.
Target - 2.0477
About Used Indicators:
On the subsequent day, trading above the pivot point is thought to indicate ongoing bullish sentiment, while trading below the pivot point indicates bearish sentiment.
Disclosure: I am part of Trade Nation's Influencer program and receive a monthly fee for using their TradingView charts in my analysis.
———————————
WISH YOU ALL LUCK

GBPJPY Trading Opportunity! SELL!
My dear followers,
This is my opinion on the GBPJPY next move:
The asset is approaching an important pivot point 203.70
Bias - Bearish
Safe Stop Loss - 203.93
Technical Indicators: Supper Trend generates a clear short signal while Pivot Point HL is currently determining the overall Bearish trend of the market.
Goal - 203.35
About Used Indicators:
For more efficient signals, super-trend is used in combination with other indicators like Pivot Points.
Disclosure: I am part of Trade Nation's Influencer program and receive a monthly fee for using their TradingView charts in my analysis.
———————————
WISH YOU ALL LUCK

EURAUD What Next? SELL!
My dear friends,
EURAUD looks like it will make a good move, and here are the details:
The market is trading on 1.7810 pivot level.
Bias - Bearish
Technical Indicators: Supper Trend generates a clear short signal while Pivot Point HL is currently determining the overall Bearish trend of the market.
Goal - 1.7730
About Used Indicators:
Pivot points are a great way to identify areas of support and resistance, but they work best when combined with other kinds of technical analysis
Disclosure: I am part of Trade Nation's Influencer program and receive a monthly fee for using their TradingView charts in my analysis.
———————————
WISH YOU ALL LUCK

AUDUSD The Target Is UP! BUY!
My dear followers,
I analysed this chart on AUDUSD and concluded the following:
The market is trading on 0.6519 pivot level.
Bias - Bullish
Technical Indicators: Both Super Trend & Pivot HL indicate a highly probable Bullish continuation.
Target - 0.6545
About Used Indicators:
A super-trend indicator is plotted on either above or below the closing price to signal a buy or sell. The indicator changes color, based on whether or not you should be buying. If the super-trend indicator moves below the closing price, the indicator turns green, and it signals an entry point or points to buy.
Disclosure: I am part of Trade Nation's Influencer program and receive a monthly fee for using their TradingView charts in my analysis.
———————————
WISH YOU ALL LUCK

BTCUSD On The Rise! BUY!
My dear friends,
My technical analysis for BTCUSD is below:
The market is trading on 94419 pivot level.
Bias - Bullish
Technical Indicators: Both Super Trend & Pivot HL indicate a highly probable Bullish continuation.
Target - 98381
About Used Indicators:
A pivot point is a technical analysis indicator, or calculations, used to determine the overall trend of the market over different time frames.
Disclosure: I am part of Trade Nation's Influencer program and receive a monthly fee for using their TradingView charts in my analysis.
———————————
WISH YOU ALL LUCK

XAU/USD – Rebalancing Structure, Support Zone Holding Steady⏰ Timeframe: 30m
📅 Update: 17/11/2025
🔍 Market Context
After the extended decline late last week, gold is gradually stabilizing around the 4,050–4,080 USD zone, showing a positive reaction at the structural support zone.
The recent Break of Structure (BOS) sequence indicates that the selling momentum is gradually weakening, while the newly formed Order Block is acting as a temporary balance for the market.
The current structure slightly leans towards a technical recovery, as buying flows are returning around the main support zone.
📊 Technical Structure
Support Zone (4,049–4,080 USD): a critical support zone, confluencing with the previous liquidity bottom.
Order Block (4,096–4,115 USD): a short-term supply-demand area, potentially a retest point before the price expands higher.
Resistance Zone (4,145 USD): the first intermediate level to overcome to confirm upward momentum.
Target Zone (4,210 USD): the upper liquidity zone, corresponding to the potential expansion mark of the recovery wave.
🎯 Market Outlook
Priority scenario for the day:
1️⃣ Gold may retest the Order Block zone 4,096–4,115 USD before forming the first push up to 4,145 USD.
2️⃣ If buying pressure is maintained and this resistance zone is broken, the expansion momentum may head towards 4,210 USD, corresponding to a higher liquidity zone.
3️⃣ Losing the 4,049 USD mark will invalidate the recovery structure and bring the market back to a lower balance zone.
🧠 Analyst’s View
The market is currently in a reaccumulation phase after a strong correction.
Buyers still maintain a technical advantage as long as the price remains above the 4,049 USD support zone.
Observing price behavior around the Order Block and the 4,145 USD zone will be key signals to confirm the strength of this recovery wave.
🛡️ Risk Note
The current phase is a “pullback phase” within the larger structure.
Traders should wait for clear price behavior confirmation at technical zones rather than predicting movements in advance.

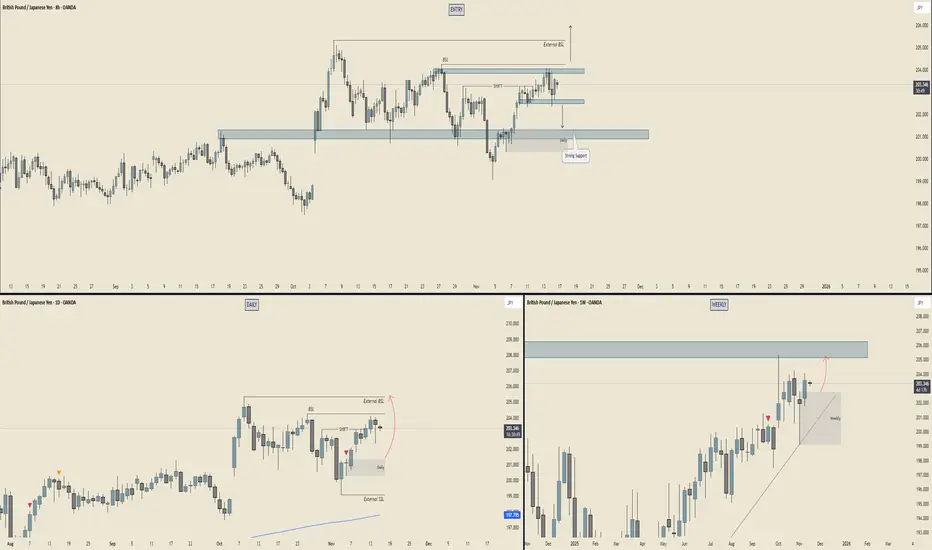
GBP/JPY - Multi Timeframe Analysis⭐ 8H CHART – Mid-Range Chop But Setting Up a Sneaky Play
📍 Current Situation
Price is chilling just under that internal BSL, repeatedly tapping a mini supply shelf. You’ve got a SHIFT marked and a clear reaction zone sitting underneath (your grey + blue combo).
💡 Key Levels
Internal BSL → Gets run, we go hunting for External BSL above.
Strong support block below → Price keeps respecting this like a trampoline.
Market is compressing between:
🔼 8H supply above
🔽 Bullish support block below
📌 Interpretation:
This looks like accumulation under liquidity → classic build-up for a sweep + pop.
If price dips first, your grey demand is the reload zone before any upper raid.
⭐ DAILY CHART – Clean Buyside Above, Built For a Run
📍 Structure
Daily is holding bullish order flow. You’ve got:
Daily BSL close overhead
External BSL even further up
A beautiful Daily demand block (highlighted) that caused the last impulsive leg.
📌 Interpretation:
The arrow you drew says it all — Daily wants that buy-side.
Sweep the daily demand → send price into external liquidity.
Momentum = bullish unless that daily block breaks.
⭐ WEEKLY CHART – HTF Premium Zone Waiting Above
📍 The Big Picture
Weekly demand held weeks ago and price has been climbing ever since.
Key details:
That massive weekly supply / inefficiency block above 205-207 is the magnet.
Price is stair-stepping higher with clean bullish candles.
Arrow toward weekly imbalance = HTF target.
📌 Interpretation:
Weekly is bullish and wants that macro supply fill.
Shorts inside here = countertrend until we hit the big zone.
🎯 SUMMARY – What’s the Play?
🔥 Bias : Bullish on all timeframes
📌 What the market wants:
A tiny correction to demand (8H or Daily)
Run internal liquidity
Push toward 205-207 weekly supply
🧨 What invalidates this?
A clean break and close below daily demand — then the bullish engine loses fuel.
ETHUSDT.P - November 17, 2025Price has broken below the rising trendline from the ~3,000 area and is now likely to retest it from underneath, showing potential continuation toward the next support near 3,020. A rebound remains possible if price reclaims 3,140, with major resistance sitting at 3,240. Overall, the market is trading between 3,020 support and 3,240 resistance, with momentum currently favoring the downside unless the trendline is regained.

BTCUSDT.P - November 17, 2025BTCUSDT is still in a short-term downtrend, but price is holding above the support zone around $94,300–$94,500 while the next major resistance sits near $96,500–$96,600. The chart suggests a potential rebound toward resistance if support continues to hold, but a break below $94,300 would likely send price back toward the lower support near $93,250.
With a stop level around $93,250 and a target near $96,600, the setup offers a favorable reward-to-risk profile, but remains moderate-risk due to the prevailing downtrend.

TESLA Technical Analysis! BUY!
My dear friends,
Please, find my technical outlook for TESLA below:
The price is coiling around a solid key level - 404.39
Bias - Bullish
Technical Indicators: Pivot Points Low anticipates a potential price reversal.
Super trend shows a clear buy, giving a perfect indicators' convergence.
Goal - 426.96
About Used Indicators:
The pivot point itself is simply the average of the high, low and closing prices from the previous trading day.
Disclosure: I am part of Trade Nation's Influencer program and receive a monthly fee for using their TradingView charts in my analysis.
———————————
WISH YOU ALL LUCK

GBPCHF: Short Signal Explained
GBPCHF
- Classic bearish setup
- Our team expects bearish continuation
SUGGESTED TRADE:
Swing Trade
Short GBPCHF
Entry Point - 1.0454
Stop Loss - 1.0473
Take Profit - 1.0423
Our Risk - 1%
Start protection of your profits from lower levels
Disclosure: I am part of Trade Nation's Influencer program and receive a monthly fee for using their TradingView charts in my analysis.
❤️ Please, support our work with like & comment! ❤️
