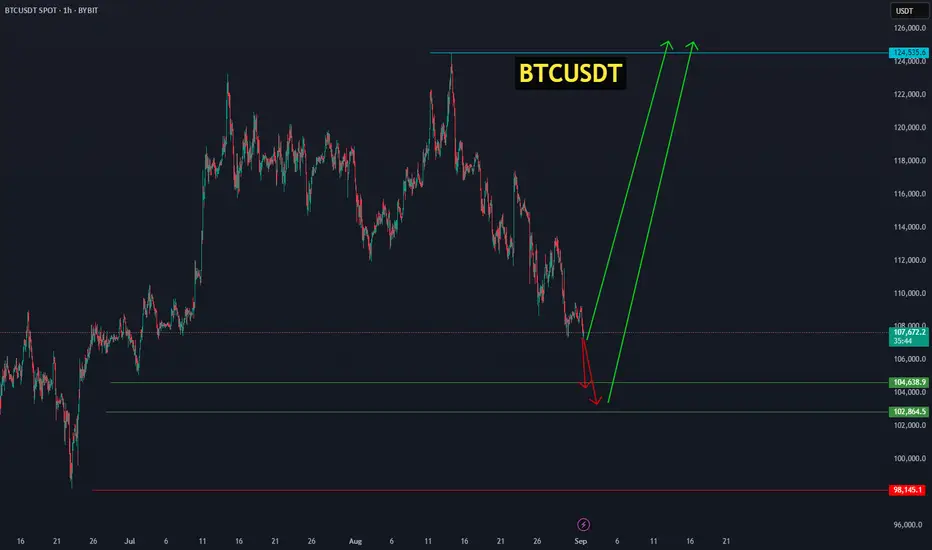
Bitcoin from the 102,864 zone is set to ignite its next bullish Bitcoin will either start its upward move from the current price or from the range of 104,638.9 – 102,864.5, aiming for targets between 118,000 and 124,535. BINANCE:BTCUSDT
Economic Cycles
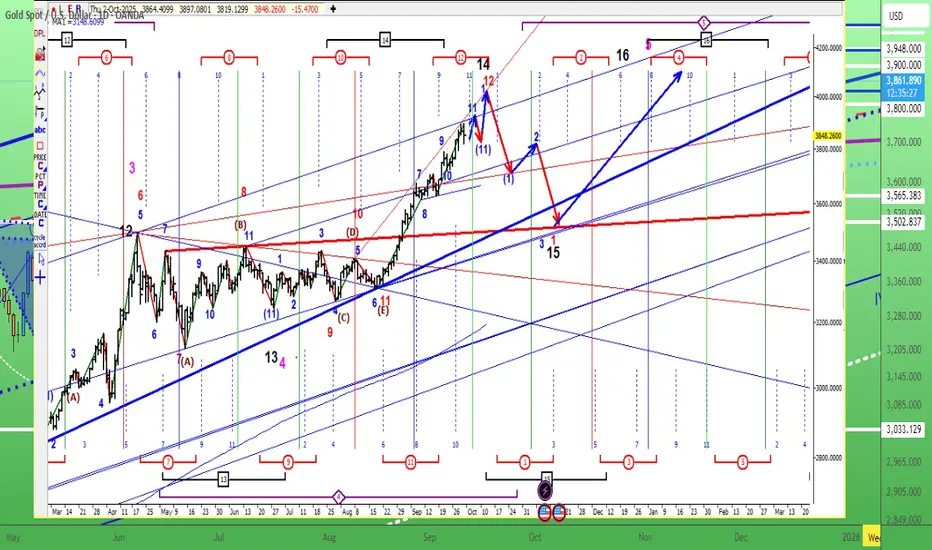
Gold's cycle analysis. 3/Oct/25XAUUSD both medium term cycle number 14 (bold balck ) AND short term cycle number 12 ( Red Bold) are due anytime on October. Probably after hitting 4000 psychological level.
YieldBricks | $YBR | Real world asset accumulation zone This #RWA gem YieldBricks ( MEXC:YBRUSDT ) is still trading inside the accumulation zone, and we are in the end of a healthy pullback → a good time to DCA.

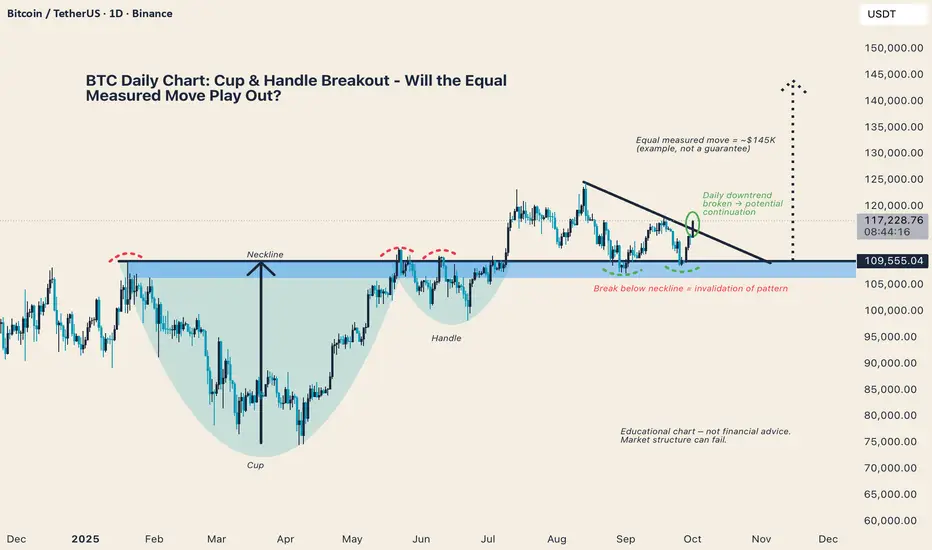
BTC Daily Chart: Cup & Handle Breakout - Will the Equal MeasuredBitcoin has broken above its daily downtrend while holding above the neckline of a Cup & Handle formation.
Equal Measured Move Example: ~$145K (for educational purposes, not a guarantee)
Key Structure: Sustained closes above the neckline support continuation
Invalidation Level: A decisive break back below the neckline would negate the setup
⚠️ Educational Chart - Market structure can fail. This analysis is for learning purposes only, not financial advice.
What do you think - is this the breakout that pushes BTC into its next leg higher, or will neckline support fail?
Gold (Rose ) and SPX ( Jack ) relationship. 1/Oct/25XAUUSD ( Rose ) and SPX ( Jack ) since dunno when they are in closed relationship on "Titanic Ship".. But.. That "shxx" is obviously tilting heavily into 1 side.untill early/mid Oct at 7000 and 4000 nautical And when.Jack and Rose probably have to perform "you jump I jump"..But after that they will "ride" different "ships"..Where one still on sinking ship , the other is riding into "Titanic" sky ship"...

Gold cycle analysis. 30/Sept/2025 Gold parabolic rocket launching was much difficulty to catch then falling knife. Gold medium cycle Number 15 probably Only will be due by last week of Oct 2025. at around 3500 a fibo 0.618 plus multi trendline confluence zone which "matched" tradingview Mod idea as well. A daily pin bar could be formed again on today closed daily bar.

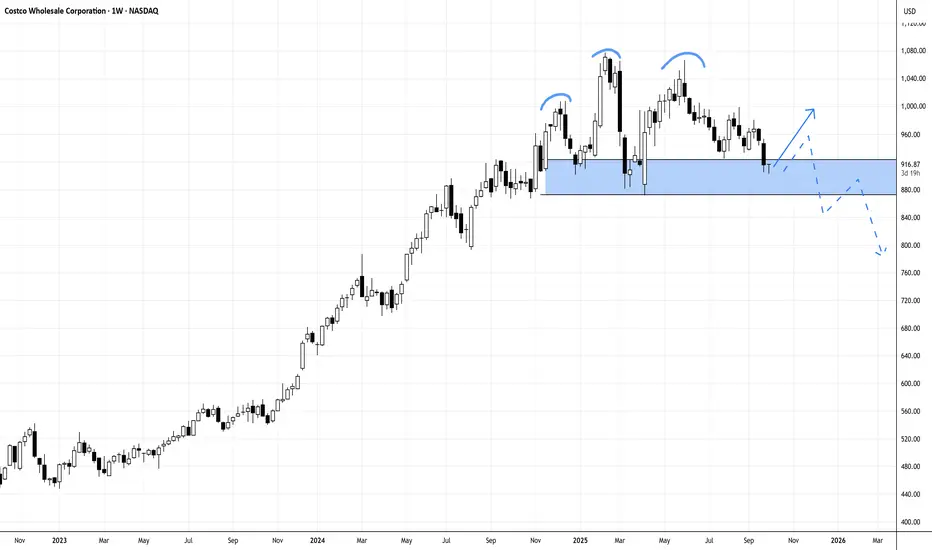
COSTCO NEEDS TO AVOID BREAKING H-n-S TO CONTINUE ITS UPSIDE RALLCostco (COST) has posted another strong fiscal year, with revenue climbing to $86.2B and net income up to $5.49B. However, the weekly chart is showing a developing head-and-shoulders pattern threatens the upside momentum, and price must hold above 871 with a rejection candle this week to avoid a deeper breakdown. A close below that level could confirm bearish continuation, despite Costco’s solid fundamentals.
N.B!
- COST price might not follow the drawn lines . Actual price movements may likely differ from the forecast.
- Let emotions and sentiments work for you
- ALWAYS Use Proper Risk Management In Your Trades
#cost
#nasdaq
#nyse
$BTC Following $GOLD - Parabola Incoming !P.S. CRYPTOCAP:BTC still on track to follow the TVC:GOLD parabola with this 10-12 week fractal which we should see between Thanksgiving and Christmas 🦃🎅
Will be following GOLD a bit more closely as Total Global Liquidity gave its first real fake-out showing ATH at EOM.

Gold's cycle analysis. 28/Sept/25 XAUUSD's medium cycle is trending down toward medium cycle number 15 ( bold black ) which is due at around mid of Oct 2025.. "Buying deep" price would be around 3468 - 3478...

SOLUSDT 1D - Bulls back in control with Golden Cross and channelOn the daily chart, SOLUSDT is forming a bullish continuation structure. After the Golden Cross (MA50 crossing MA200), the price is now pulling back toward the midline of the ascending channel and the 0.5 Fibonacci level at 166.38. This confluence with the broken trendline and 200 EMA makes this zone a prime technical area of interest.
Support: 166.38 (0.5 Fibo), EMA200 (161.77), broken trendline
Resistance: 182.84–189.67 (Fibo 0.705–0.79), 206.54, target - 255.93 (Fibo 1.618)
This retracement looks healthy, supported by higher volume during the prior bullish leg. As long as the 166.38–161.77 zone holds, continuation toward 206.54 and potentially 255.93 is on the table.
Fundamentally, Solana remains a key L1 narrative with strong traction in DePIN and AI-linked dApps. The rising TVL and investor sentiment support the trend.
Watch price action around 166 for confirmation - this is the battleground.

Gold trade Plan Here’s the **clean trading plan** you can post with this chart:
📈 Gold (XAU/USD) Trade Plan – 30M Chart
Entry (Executed):** 3,735 – 3,736 (Buy Zone)
Stop-Loss:** 3,728
Take Profits:**
* 🎯 **TP1:** 3,748
* 🎯 **TP2:** 3,753
* 🎯 **TP3:** 3,765
* 🎯 **TP4:** 3,779
Trade Management
* TP1 is very close – once hit, **move SL to breakeven**.
* Holding above 3,740 keeps structure bullish.
* Momentum targets liquidity pools at **3,753 & 3,765**.
* If price falls **below 3,735**, setup invalidates.

Treasury General Account MAJOR Impact on $BTC PriceI’ll be the first to admit I failed to closely follow and analyze the impact of the Treasury General Account (TGA).
We all know it’s a liquidity suck on ₿itcoin and cryptocurrencies, which are the most highly sensitive assets to liquidity, but have you ever dove into the data to see just how impactful it is?
I went through all the refills and calculated how much it drew down the CRYPTOCAP:BTC price.
Note how TGA refills also marked cycle tops in 2017 and 2021.
This really is something to closely monitor going forward alongside Total Global Liquidity (TGL).
What I have found is when TGA refills are occurring, they have more impact on the price of BTC than TGL.
We can see this in the current state of market, where TGL is at an ATH and the TGA is currently being refilled.
GOOD NEWS: The TGA refill is just about complete 🏁
Moon on brave soldiers 🌛

GBPJPY Sell Limit Order BreakdownHeres a video of why I placed my limit order for a sell on GBPJPY. Thank you for watching.

AUDUSD BuyDaily cycle and Lit cycle. Price also reacted from a POI from the left and is reacting within NY session which is apart of the timing.

Gold SellFor Gold, there is bad order flow and price reacted from a counter POI which is in play with the weekly cycle.

BTCUSDT- 250924 - LONG - Bitstamp - Cycle Top - 1WBTCUSDT- 250924 - LONG - Bitstamp - Cycle Top - 1W
Market Cycle Top: 134k
Look to take profits around 134k

Rejection Before 3800: A Final Window for ShortsDriven by market sentiment, gold has now reached a high of around 3792, just one step away from the 3800 mark. Judging from the current structure, gold is undoubtedly in a unilateral bull trend and has completely replicated the rising pattern of the previous wave, with almost no decent retracement during the rise.
Now gold continues to break through historical highs and enter unknown areas. In addition, due to the promotion of market sentiment, the current technical level has been distorted, so there is no good reference target at present. It can only be calculated based on space and cycle; the foreseeable upper limit area in the short term is in the 3820-3830 area; but because there are obvious signs of stagnant growth before reaching the 3800 mark, gold may be the first to experience a pullback.
Because gold is in an extreme rising mode, most funds may not have the opportunity to participate in long transactions, so in order to increase liquidity, gold also has a need for a retracement; however, because the current market enthusiasm remains unabated, it can be expected that the retracement space for gold is limited. The foreseeable retracement area is in the 3760-3750 area, and the second is in the area near 3730.
In addition, look at it according to the cycle. It is not difficult to see from the financial calendar that China, a major gold holder, will usher in the National Day holiday. Before the holiday, some funds may take profits, which will also lead to a decline in gold prices. After the holiday, gold may end its retracement and return to the upward trend.
So if you hold a short position, then when gold falls back to the 3760-3750 area, or even around 3730, it will be an opportunity for gold bears to get out of trouble. Once gold retreats to this area and escapes the predicament, it could be a good opportunity to re-enter the long position!

Crypto Market Bullish Structure Remains to HoldLooking at the Total Market Cap chart, the answer is: not yet.
✅ The daily uptrend line is still intact.
✅ The 2025 cycle neckline is holding as support.
⚠️ If either breaks to the downside, that’s when the structure flips bearish.
For now, the big picture remains bullish until proven otherwise.


Bitcoin reach bottom cycle 8 Nov 2025Bitcoin’s recovery has stalled at the 50-day moving average, and the overall price structure still looks bearish.
It may test the ฿100,000-฿101,000 uptrend line, but a deeper drop to ฿94,000 is also possible.
Cycle Analysis
Based on price cycle analysis, the market is expected to reach a bottom around November 8, 2025.

Minimum specified modificationMinimum correction specified
The target that should be hit, of course, using Bit May analysis, sees a minimum of 103
EURUSD BuyPrice took out a low and then immediately came up and broke internal structure which is a sign of a sweep known as Liquidity Grab. Also, This potential inducement happened during Asia session which could be the LIT cycle for the day(major inducement) and continue upward to complete the Daily cycle as well.
