Grand Silver SupercycleI present the Grand Silver Supercycle. Silver has followed Elliott Wave Theory nicely through the years. The price hit a century low during The Great Depression, beginning what I believe to be the first wave of a supercycle. There is a clear five wave pattern up from this low, peaking in 1980. This is supercycle wave 1. Then, we see a five wave corrective pattern down, bottoming out in the early 90s. Alternatively, a three wave ABC pattern could be drawn. This is where supercycle wave 3 begins. Wave 3 is typically much more prominent than wave 1 in Elliott Wave Theory. For this reason, it makes sense that the next five wave pattern ending in 2011 is only the first subwave of supercycle wave 3. The second subwave corrected to the 2020 low, and we are currently on the third subwave. Within this subwave, we could either be starting a third wave (as shown in the chart) or still be on the corrective second wave. I believe the former is much more likely due to fundamentals.
Price targets within the current subwave were estimated as follows:
wave 3 length = 1.618 X wave 1
wave 3 target = $48
wave 4 length = 38.2% retracement of wave 3
wave 5 length = 1.618 X (wave 3 end - wave 1 start)
I'm more confident on wave 3 ending near $48 than I am of wave 5 ending near $95. There is strong resistance at $50, which coincides with the Elliott target zone. Wave 5 length can vary significantly. For silver at least, fifth waves have traditionally been long ones.
Fundamentals
Elliott Wave Theory is only a tool. It needs to be backed up by fundamentals when forecasting on long time frames. Silver is undervalued due to many years of supply outstripping demand, creating cheap prices. That is in the early stages of changing as now demand outpaces supply. Global silver demand was expected to hit an all time high of 1.21 billion ounces in 2022 (www.silverinstitute.org). This is largely due to increases in demand in both industry (Green Revolution) and personal investment (stackers hedging against inflation). Silver reserves currently stand at 530,000 metric tons (www.statista.com). The current demand is 38,000 metric tons per year. A simple calculation shows existing reserves could be depleted in 14 years. However, this calculation doesn't take into account new discoveries and recycling, which have so far kept pace with demand. Estimates of time to depletion of reserves vary wildly from a couple decades to a few centuries. At the moment, the prime driver of price (in addition to inflation) will be the deficit, not depletion of reserves.
Inflation is a totally different animal that is much harder to forecast long term due to its close relationship to government and Federal Reserve policy. It is more likely that when presented the choice, our leaders choose high inflation over debt default and depression. How this all is going to play out is anyone's guess. It seems for now our leaders are trying to kick the can down the road for as long as possible. If hyperinflation hits, the silver price will reach extraordinary heights.
Economic Cycles

FET - Bear Market Bottom Repeat Pattern - Very bullish on FET!!To me, FET is repeating a bear market bottoming pattern now.
We are on the 4D chart.
As you can see from the previous market cycles, FET shoots up sharply from its market cycle bottom. It then does a .50 fib retracement of the move off of the market cycle bottom, and establishes a strong level of support. These areas can be seen in the light blue boxes: Sep 2020-into Q1 of 2021, and then in May of 2023 - October of 2023.
When you look at what FET does in each of its market cycles; It bottoms right in that first area of support that we just discussed.
When you take a look at what FET just did, it actually fell into that area of support that we established off of the 2022 market cycle bottom. That is, the level of support that we formed from May - Oct of 2023.
We also have a repeat pattern on the 4D RSI. The 4D RSI will have 3 heavily overbought waves during its bull market, and then 3 heavily oversold waves during its bear market. We just completed a 3rd oversold data point on the 4D RSI for FET. This occurrence and the last occurrence both formed an inverse head and shoulders pattern on the 4D RSI.
We're actually in an extended period of bearishness for this FET bear market, too. We took a bit longer since we did a premature 200-ish percent bounce off of the bottom in April.
With the Bitcoin dominance chart not having completed a market cycle of its own - I do think that altcoins will still have a nice run within a lengthened cycle for the first time ever.
There are more repeat patterns, but I just don't have the time to discuss them right now.
Thank you!

SILVER $70.00My silver 5 year / 1 Week Chart!
Silver will rise to the resistance line at $35
If it breaks it resistance line at $35
The next resistance trendline is around $37.50
If it breaks the resistance trendline around $37.50
It could blast around $70.00 lol
I am making monthly videos on YouTube
I called this move 2 months ago!
I forgot to upload my idea on tradingview :(
Tradingview blocked my last silver idea 6 days ago for putting my youtube links! lol

SOL (Long) 10-19-2025Just got in SOL around $190.00
Stop Losses at the support level around $172.50 around -10%
First Resistance level around $212.00
Target around $253.00 Next target around $285.00 Profits around +33%-+50% by 12-31-2025!

Xauusd outlookGold has had a 9 week bullish run based on historical data this has only occured 6 prior times .
This is a strong indication that this might be the last leg of the run for gold .
With China finding mines of gold and south Africa having a massive reseve in gold up to 1. Trillion , we might see the supply increase if these countries decide to utilize these reserves .
Outlook gold closes previous week high creating the top wick for the coming week and selling off to follow ,
Gold can either continue with this run to month end breaking history where gold has only ever traded once for 10-12 consecutive bullish Weeks .
With us still looming in a shutdown , and no economic data release yet such as NFP. causing more uncertainty.

BTC Still bullish looking forwardThere is some juice left, the 'last hooray'.
My very subjective likelihood of happing in percent.
Manage your risk.

Today is 12 nov 2017The 2017 cycle is here again. Last cycle failed but the actual ATH would be 110.000. That´s why end of 2024 that ATH was broken. Maybe 4 to 5 weeks to the new top.

WHAT IS THE EXPECTED RETURN and DURATION of this GOLD Bull Run?Well, when measured against the DXY index, a clear trend becomes apparent.
A Golden Bull typically lasts about 40 quarters, which is essentially 1 decade (give or take a quarter).
Similar to #Bitcoin and its cyclical bull markets within a larger secular bull, the returns tend to decrease over time.
However, it seems that a triple-digit Gold price relative to the DXY is on the horizon at the very least.
What would that look like if the DXY were to hit a new low around 69? This would suggest a Gold price of $6900 at a ratio of 100:1.
A Gold price of $12K with a DXY of 80 only requires a ratio of 150...
Thus, a five-digit Gold price is certainly within the realm of possibility.
I have forecasts that extend as high as $12K.

WILL GBPUSD CORRECTION ENDS WITH SIMPLE WXY OR WXYXZ?Cable is undergoing a weekly having successfully break above the 1.34342 resistance now turned support level to extend its impulse trend. Will the pair's trend continue after a simple wxy correction, or a more complex wxyxz or even breakdown?
N.B!
- GBPUSD price might not follow the drawn lines . Actual price movements may likely differ from the forecast.
- Let emotions and sentiments work for you
- ALWAYS Use Proper Risk Management In Your Trades
#gbpusd
#cable

Bitcoin. Oh mine! On Par with Gold by 2027? 17/Oct/25BTCUSD probably completed its cycle 7 (purple) high and now trending multi year low until till near 2027 which is cycle 8 (purple ) low. Based on EW pattern BTC could form a long-term flat pattern which price could go down to 3000 +/- by the time Gold which could be at around 3000?

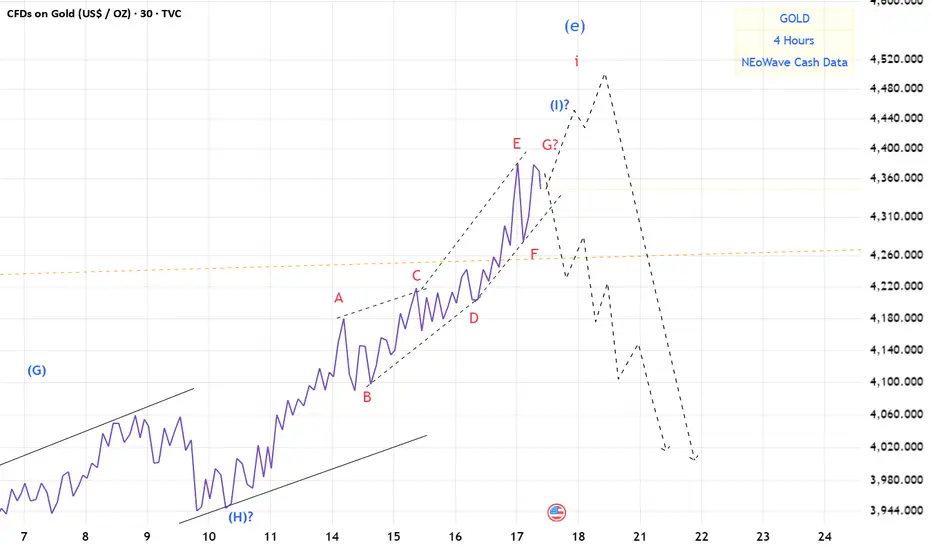
Gold(based on NEo wave)maybe here is the end of wave i.
based on Dow theory good news on top.
crazy people are buying gold.
I think soon we will see crash of gold.
market will not be bullish forever.
BITCOIN ACCUMULATIONS MAY START <= 100KFor those planning to buy Bitcoin (BTC), you could wait for the price to decline to the $100,000 level or below.
Currently, the price chart shows a "double top" formation, which is a potential bearish reversal signal. I suspect this could evolve into a "head and shoulders" pattern. A break below the neckline could push the price toward the discount or value area.
N.B!
- BTCUSD price might not follow the drawn lines . Actual price movements may likely differ from the forecast.
- Let emotions and sentiments work for you
- ALWAYS Use Proper Risk Management In Your Trades
#ethusd
#crypto
#btcusd

$10,000 Gold, around the 2040'sMacro Long-Term View!
$600 Silver & $10,000 Gold around the 2040's
DCA! HODL!

$600 Silver around the 2040'sMacro Long-Term View!
$600 Silver & $10,000 Gold around the 2040's
DCA! HODL!

BTC Symmetry <Danger Zone>Considering the low shadow in Bitcoin, this upper zone is my entry area, and if I get confirmation, I’ll enter a sell position.
Symmetry will definitely occur — it’s just a matter of time, sooner or later.
864

Rotation Gold to BTCEvery time gold reaches the top, Bitcoin has a 20% correction. Then money flows from gold to the Bitcoin market, and Bitcoin starts a rally.

Bitcoin’s Bloodbath Was a Setup Smart Money Knows ItBitcoin remains structurally bullish despite the recent market turmoil. The monthly chart clearly shows that the main ascending trendline continues to hold firm acting as the backbone of the current bull cycle.
The recent drop was nothing more than a controlled retest of this key support zone. As long as Bitcoin stays above $103,000 and the trendline remains intact, the bull market stands strong.
Next upside projections:
First target: $126K – $165K
Extension target: $200K+
Only a confirmed monthly close below $103K would invalidate the bullish structure. Until then, this phase remains a buyers’ market, not a sellers’.
Share your thoughts below do you believe this trendline can carry BTC to new highs?
Like & share if you agree.

Copper and Oil: A Rare Divergence in the Commodity ComplexThe chart compares Copper (brown) and TVC:USOIL (blue) — two of the most cyclical commodities, both highly sensitive to global growth.
Historically, they tend to move in tandem: when economic momentum improves, both rise; when demand weakens, both fall.
But today we see an unusual divergence —
-Copper holding near multi-year highs, supported by structural deficits and energy transition demand.
-Oil trading below $60, its lowest since 2021, signaling cyclical slowdown and weak liquidity.
This gap rarely lasts long. Either copper is too optimistic, or oil is too pessimistic — one of them is likely “lying.”
Which one will be right this time?

CONCENTRIX (CNXC) POTENTIAL DOUBLE BOTTOM LIKELY A BUY SIGNALCNXC stock price that has been heavily beaten down by market due to the fear over AI disrupting their business models. While the stock has seen a significant price drop, a compelling investment case is forming at these depressed levels, combining both the company's strong fundamental story and a potential technical buy signal. A weekly double bottom (or HL) price formation, will be a BUY confirmation.
FUNDAMENTALS
- Strong Financials: Despite the negative sentiment, CNXC continues to generate significant cash flow (a ~20% FCF yield).
- Cheap Valuation: Trading at a forward P/E ratio of around 4.5x, the stock is priced as if it's in terminal decline, which seems disconnected from its stable operational performance.
- Resilient Business: Only a small portion (~7%) of CNXC's business is the "low-complexity" work truly at risk of AI which is causing negative sentiment. But now, the company is actively integrating AI into its offerings, turning a threat into a high-margin opportunity.
N.B!
- CNCX price might not follow the drawn lines . Actual price movements may likely differ from the forecast.
- Let emotions and sentiments work for you
- ALWAYS Use Proper Risk Management In Your Trades
#cncx
#nasdaq
#nyse

ALT SEASON - Thoughts and timingALT SEASON!
We’re all waiting for it like 8-year-olds waiting for Christmas. 🎄
No one can promise it’ll come — but this chart is a reminder that if it does, it can be over very quickly.
Check out last year’s short period from Nov–Dec, when USDT.D dropped fast and we got that mini alt season. From today’s level to the anticipated alt-season low back then was just 30 days.
Just wowow!

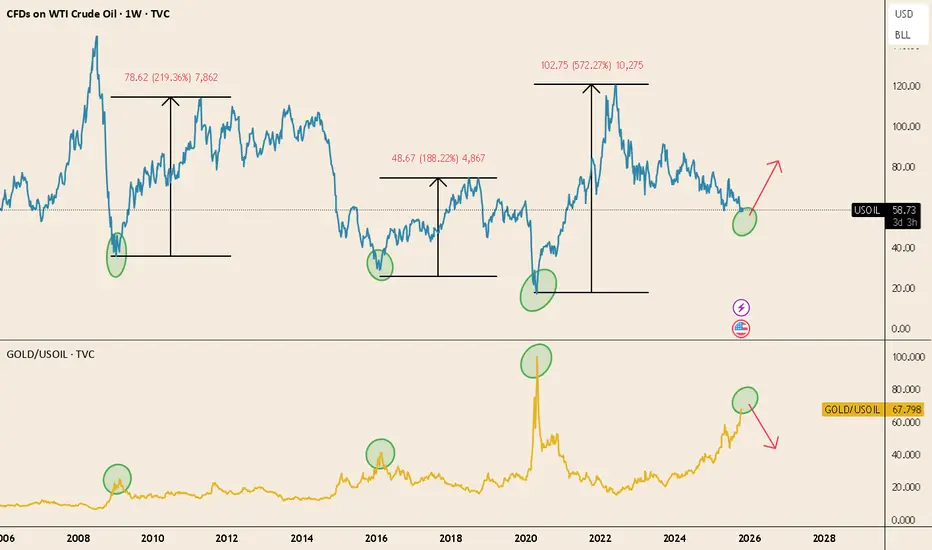
Oil vs Gold: Transition to the Next Commodity CycleThe chart compares WTI crude (top) and the Gold/Oil ratio (bottom) on a weekly basis.
Historically, when the Gold/Oil ratio spikes — meaning gold becomes very expensive relative to oil — it tends to mark the end of the precious metals phase and the beginning of the broader commodity cycle.
In the past three cycles:
-2009 → 2011: Oil +219%
-2016 → 2018: Oil +188%
-2020 → 2022: Oil +572%
We’re seeing the same setup again:
TVC:USOIL sits at long-term support.
Gold/Oil ratio has reached historical extremes.
In each of these cases, gold had already led the move — followed by silver, industrial metals, and finally oil — the last to rally as growth and inflation expectations picked up.
If history rhymes, this could mark the rotation point where energy begins to outperform within the commodity complex.
Anticipating a Stronger DollarThe U.S. dollar ( TVC:DXY ) has been strengthening since the 2008 crisis, and I expect this trend to continue. I anticipate the Dollar Index (DXY) could reach a target of 120 by the next election or even sooner.

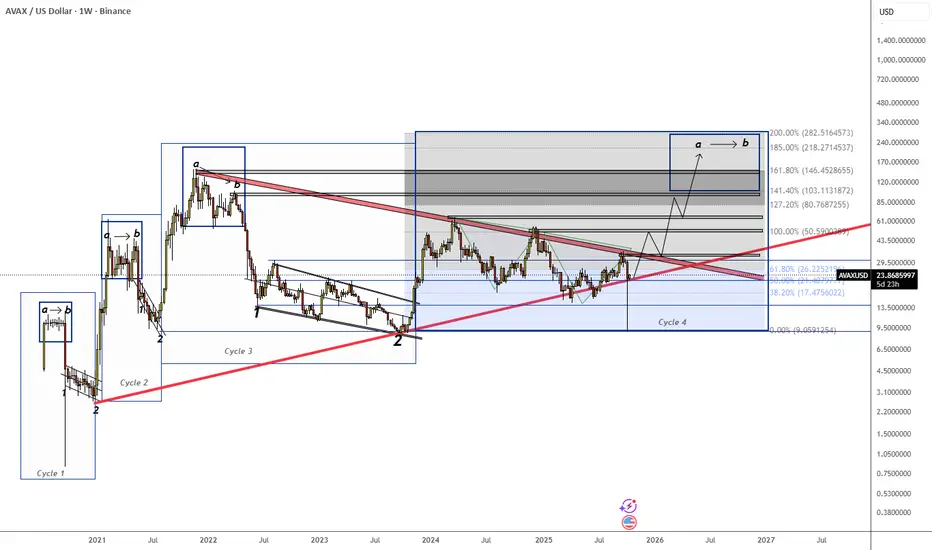
AVAX/USD - Projection idea - Cycle 4AVAX its about to break its downtrend to start an expansion cycle 4.
If history repeats again, we could see BNB between 146$ - 282$ with an average price of 218$ aprox.
Weekly Chart so updates will be slow. Just keep an eye on it.
Most cryptos have a similar cycle style.
Meaning the altseason might have just set off with the BTC Dominance dropping.
Any likes, boost, and share with your people its appreciated!