BITCOIN Market Resilience Amid the BloodbathDespite yesterday’s broad market massacre, Bitcoin continues to demonstrate exceptional structural strength. The sell-off wasn’t random, it was a precisely engineered liquidity flush designed to test the integrity of the primary ascending trendline that has defined this bullish cycle.
That deep retest tapped directly into the historic accumulation zone, the same area from which every significant rally in this macro uptrend has emerged. This region now acts as the ultimate bullish defense line, where smart money typically re-positions before the next expansion phase.
As long as Bitcoin maintains a daily close above $102,000, the bullish projection remains fully valid. The next key target sits around $126,000, followed by the extended leg projection towards $168,000, which remains technically achievable within this cycle.
Every revisit to the base structure should be viewed as a strategic buying opportunity, not a signal of weakness, but a reaffirmation of strength within a controlled market reset.
Do you agree with this outlook or not?
Share your thoughts below, hit the like, and share this analysis if it aligns with your perspective.
Economic Cycles

$BTC / Global Liquidity Acceleration with Business Cycle Today’s PA confirmed an interesting theory I’ve had where liquidity reaches risk assets faster as the business cycle picks up.
I wrote about this in depth in my “Twin Peaks” cycle top thesis (pinned tweet).
We were charting Total Global Liquidity with a 12-week lead against CRYPTOCAP:BTC before the rate cut in September, and then we got a 1-point higher reading in the ISM PMI, which I believe accelerated the liquidity cycle by a couple weeks.
I think for every 25 bps rate cut, we will see TGL accelerate by 2-weeks.
The next rate cut is expected at the October 29th FOMC.
It will be interesting to track liquidity flows and the ISM PMI after the next rate cut to see how they adapt to markets.
The GOLD / BTC chart confirms this acceleration, as GOLD typically has a near 1:1 ratio with TGL.
I was one of the first analysts to point out this signal earlier in year before all your favorite large accounts ran with it (go figure).
This acceleration in TGL would mark our local bottom near perfectly.
If this theory is correct and liquidity does accelerate by another 2 weeks, based on TGL, we would have the cycle’s first top somewhere around November 11th.
Currently it’s the 25th with a 10-week lead.
That would coincide with my OG ₿itcoin cycle analysis that I put out over 1.5 years ago, where I said the cycle top would be between OCTOBER 6th, which was already a local top, and NOVEMBER 9th.
However, there is a discrepancy with the GOLD / BTC chart. The local top would be around December 3rd. It’s currently the 17th with a 10-week lead.
I think GOLD has overshot TGL simply based on bull market mechanics creating a parabola.
To sum it up, stay vigilant over these next few months, and take nothing for granted.
The first peak will for sure come sooner than you think.
Going to be fascinating to follow these liquidity flows, at the very least.

THE ULTIMATE CHESS MATCH...THE FINANCIAL MARKETSHey hey everybody JosePips here!!! Just wanted to drop a fire video about how we as retail traders should be approaching these markets, what they truly represent, & how we are witnessing the ultimate chess match take place...so let's dive in to what I go through in this video
1. The mindset behind the markets: People & Money
2. What the markets represent: the ultimate chess match
3. The chess match between buyers & sellers
4. The RETAIL ADVANTAGE: 3rd party witnesses
5. The business of the markets
6. How WE as RETAIL participants can UTILIZE this chess match to create our trading/business decisions with PROBABILITY
OK guys! I dropped some heat in this video! Hope you all enjoy & REMEMBER...EMOTIONAL trading is not trading..it's just hope :)
Cheers!!

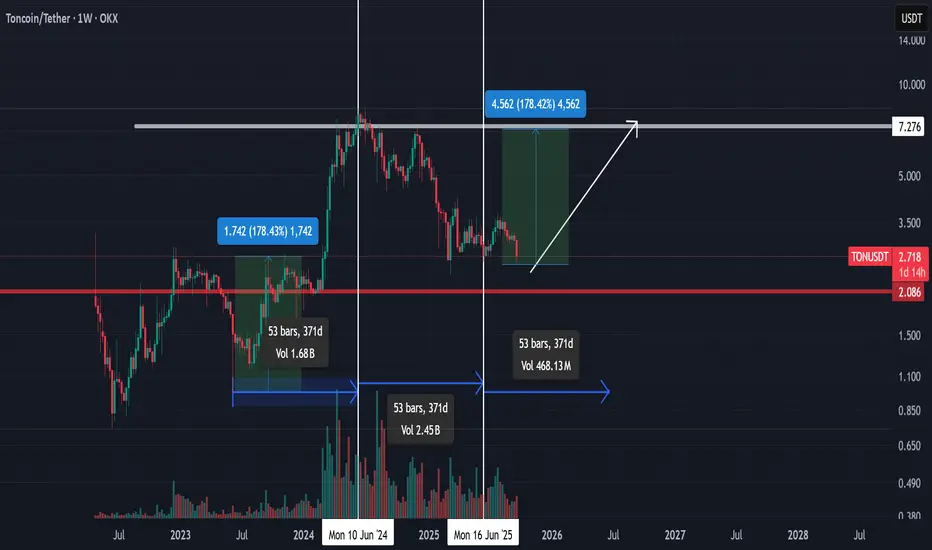
Possible setup for TON to retest 7$Currently, we are seeing a very exhausted multi-month downtrend. Just like in 2023, it’s very possible that with some sort of positive news injection, TON could start a big explosive move to the upside.
Technically, it’s forming a triple-bottom formation and a higher low on the weekly chart. The TON/BTC chart is also showing a potential double bottom.
In my opinion, money will start flowing from XRP, SOL, ETH, and BTC into coins like this over the next few months.
The plan is simple: I’ll buy a 30% spot position here and DCA every 10% drop until $2. Below $2, I’ll double my longs and go 2x. (I highly doubt it breaks under $2.5, but it’s better to play safe than sorry.)
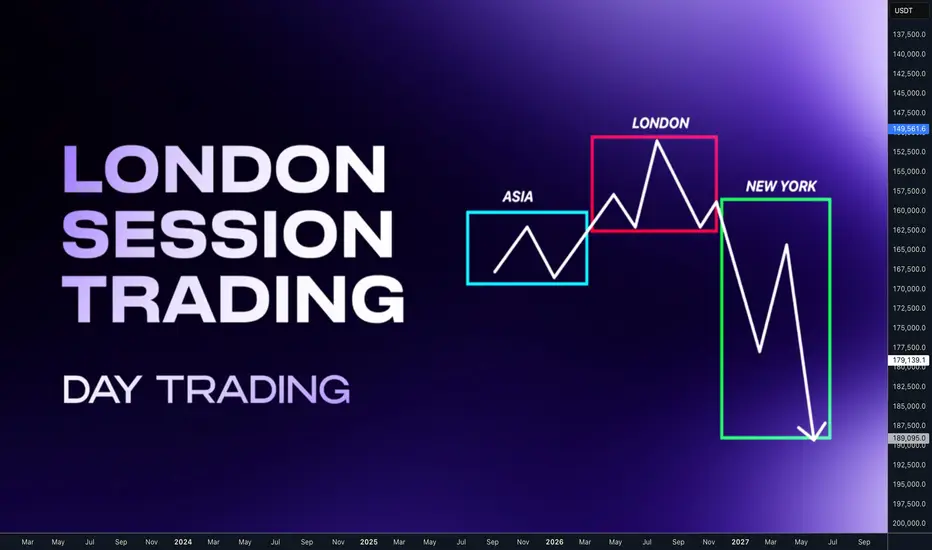
High probability strategies for the London SessionHey traders, let's break down the London session trading . In my opinion key session for the forex trading mainly for the EUR, GBP and CHF. I ll show you two high probability setups and its conditions to trade and when not to trade. Make notes and backtests so you got statistics and you can improve yourself over time. You will find out, that if you focus only on these 2 setups on 3 mentioned currencies. You will have 3-5 high probability opportunities per week.
Which is enough to make 6R gains in a week. Which is 3% on prop account with risk 0.5% per trade. And it's enough to make trading your main income.
📌 Asian Session
Low volatility & accumulation phase — the market usually consolidates inside a tight range after the previous New York close. If the Asia session is trending, London will be continuation setup.
📌 London Session
The highest-probability setups often occur during this session.
If Asia was tight range, London usually manipulates the Asian range sweeping stops above or below then reverses and starts the true daily move. London will be Reversal setup. Often sets the daily high or low of the day
📌 New York Session
Brings in the highest volume and often continuation or reversal of the London move. Based what has happen in London and on relationship with key levels and market phases. We can build market narrative for our trades.
🧪 London Continuation Bearish setup
•Narrative: Asia did the manipulation → London does the continuation.
• Asia session already made a manipulation into a key level
• Price displaced away from that level
• CIOD / OB on M15 or H1 before London open
• H1: Asia runs above the stops above H1 high into a key level
• It gets rejected and followed by order block and displacement
• At London open, price retraces into M15 premium key level and continues in the same direction
❌Invalidation: the manipulation high/low from Asia session
🧪 London Continuation Bullish setup
• Narrative: Asia did the manipulation → London does the continuation.
• Asia session already made a manipulation into a key level
• Price displaced away from that level
• CIOD / OB on M15 or H1 before London open
• H1: Asia runs bellow the stops above H1 high into a key level
• It gets rejected and followed by order block and displacement
• At London open, price retraces into M15 discount key level and continues in the same direction
❌Invalidation: the manipulation high/low from Asia session
🧪 London Reversal Bearish setup
• Narrative: London performs the manipulation → price reverses.
• Asia session consolidates near a higher timeframe key level
• London open initiates the manipulation into the key level
• Price reject at the key level and created M15 order block • H1: Asia consolidates Bellow Key Level
• London opens, price runs Asia high into that Key Level
• M15 breaks down → Change in order flow → clean short setup
• Target: higher timeframe draw on liquidity (e.g., previous day low)
❌Invalidation: the London session high (manipulation point)
🧪 London Reversal Bullish setup
• Narrative: London performs the manipulation → price reverses.
• Asia session consolidates near a higher timeframe key level
• London open initiates the manipulation into the key level
• Price reject at the key level and created M15 order block • H1: Asia consolidates above the Key Level
• London opens, price runs Asia high into that Key Level
• M15 breaks up → Change in order flow → clean short setup
• Target: higher timeframe draw on liquidity (e.g., previous day low)
❌Invalidation: the London session low (manipulation point)
🧩 to trade this method successfully you need to understand Order Blocks
🔗 Click the picture below to learn more 👇https://www.tradingview.com/chart/BTCUSD/LJ69Z8r4-Order-Block-Powerful-Key-level-and-Entry-confirmation/ 🕐 Timing is important
1️⃣Continuation setup can occur in first part of the London session. during the start of the settlement 2️⃣ Reversal setup needs a bit more time. I suggest don't enter before the 10 CET
wait for clear change in order flow after the manipulation 🧩 Day Trading doesn't mean trading every day. For highest probability setups trade only within the higher timeframes H4/D1/W1 trends.
📌 Down Trend - Trade Stop hunts above the highs
Trade London continuation or Reversal if the H4 Downtrend has run above the highs (stop hunt) It will give you chance to catch big expansion moves 📌 Up Trend - Trade Stop Hunt below the lows
Trade London continuation or Reversal if the H4 Downtrend has run below the lows (stop hunt) It will give you chance to catch big expansion moves. 🧩 In other words you want be buying loses and Selling highs.
🔗 Click the picture below to learn more 👇 I have explained how to do it in this post bellow Trend is your friend so H4 is minimum trend requirement for the London session traders. But if you want to take it to next level and enter on the sniper entries during the London session, you should also know daily and weekly trends within the monthly range. This opens a whole new world where you can catch London session model with HTF range move and it can be +10RR trades if you patient enough.
📈 Bullish LTF Ranges within HTF Range
Analyze HTF range (monthly) and define daily ranges, and wait for the London setups on the lows of the previous days within HTF trend. Always follow the same process in the London session on LTF. Asia either make manipulation - go with continuation setup or Asia consolidates and wait for the manipulation during the London session - go with London Reversal setup. 📉 Bearish LTF Ranges within HTF Range
Analyze HTF range (monthly) and define daily ranges, and wait for the London setups on the highs of the previous days within HTF trend. Always follow the same process in the London session on LTF. Asia either make manipulation - go with continuation setup or Asia consolidates and wait for the manipulation during the London session - go with London Reversal setup. ‼️ In trading, you make most money by making precisely best decisions and controlling your risk. Hence understanding the different probabilistic scenarios we can start focusing on quality over quantity by avoiding lower probability conditions. The aim is to improve our decision making process by knowing when it's better to trade and when not.
❌ Low Probability London Session Conditions
• After a series of 3 consecutive bullish daily candles - Avoid Longs.
• After a series of 3 consecutive bearish daily candles - Avoid Shorts.
• After FOMC event that produces an extreme range.
• Ahead of NFP and CPI data release
• Multiple high and medium impact news events.
• The Asian Range is has been trending and is larger than 40 pips.
• If the Asian Range is not visually consolidating.
• Absence of a candle range
✅ High Probability London Session Conditions
• The market has recently reacted off of Daily /H4 key level
• The Asian Range is visually a consolidating and smaller than 40 pips.
• Presence of a clean visual candle range
• Presence of a higher timeframe key level.
• Clean higher timeframe draw on liquidity.
✅ High Probability Intraday Setups
The highest importance is placed on the H TF Daily or 4h direction:
• Clean orderflow.
• Clean higher timeframe draw on liquidity and directional bias.
• Strong price based narrative.
• Strong time based narrative.
• 4h candle range
• 4h Key level.
• Key time
Adopt this simple concept and master it. You will not need to pay any signals group and other nonsense anymore. Just sacrifice 6 months to one strategy in one time window and find repetitiveness. Build confidence based on statistical data. Become independent.
✨ Trading Mastery is reflection of your life
Have a longterm plan, No Alcohol & Drugs, Ignore others, Focus on your journey , Backtest regularly, Review your weeks, Journal mistakes, Exercise, Sleep well, Read books, Walks in nature (no phone) , Meditate, Reduce social media time, Spend time with family, Live Life.
Trading is hard, but not impossible. I believe in you 💪
David Perk aka Dave Fx Hunter
RENEWED US-CHINA TRADE TENSIONS COULD DRAG S&P500 TO ITS MEANWith renewed trade tensions between the US and China creating market uncertainty, the S&P 500 could be pushed significantly lower. The key support level to watch is the 6255 - 6468 range (1), which may act as a buffer. A break below this level could accelerate the move down toward the Feb - Apr 2025 monthly pullback zone (2). In either scenario, this volatility could cause a repricing of many stocks toward their perceived fundamental values.
N.B!
- ES! price might not follow the drawn lines . Actual price movements may likely differ from the forecast.
- Let emotions and sentiments work for you
- ALWAYS Use Proper Risk Management In Your Trades
#S&P500
#nasdaq
#nyse

GBP JPY - Wave D forming?Daily chart image shows my thought pattern and an opportunity I am waiting for price to revert to.
I'm referring to the Daily price chart and key counts are in line with Wave counting and supply and demand curve trading levels based on fair value gap intervals of weekly trading sessions plotted to a daily chart at intervals of 60.
Current wave -
Wave A: The first correction test (200+) - where a rejection into the impulse high - to form a weekly supply.
- Wave B: Deep testing of the lows into 184 territory, but keeps the rising channel weekly in tact.
- Wave C: Technical rebound exactly to the higher wick on the max top of the supply and settled in the marked zone - of a large volume of sell orders.
- Now to Wave D formation: 190? or below 189*? showing the weekly trend down to where the wav could end?
Master Key for zones
Red = Three Month
Blue = Monthly
Purple = weekly
Pink = Consolidative box example (Daily)
Orange = Daily
Risk Warning
Trading leveraged products such as Forex, commodities and CFDs, carries with it a high level of risk and so may not be suitable for every investor. Prior to trading the foreign exchange, commodity or CFD market, consider your investment objectives, level of experience and risk appetite. You should never risk more than you can afford to lose. If you fail to understand or are uncertain of the risks involved, please seek independent advice and remember to conduct due diligence as criteria varies to suit the individual.
Below are some of the take aways from the video - please listen again incase any detail is missed.
Do you enjoy the setups?
Professional analyst with 8+ years experience in the capital markets
Focus on technical output not fundamentals
Focus on investing for long term positional moves
Provide updates where necessary - with new updated ideas tracking the progress.
If you like the idea, please leave a like or comment.
To all the followers, thank you for your continued support.
Thanks,
LVPA MMXXIV

Gold. Cycle analysis 12/Oct/25XAUUSD's Cycle number 14 ( black bold ) is overdue, probably a big dive of gold price just before/after postponed many weeks NFP news?

$BTC Double Top - Business Cycle & Global Liquidity Analysis TWIN PEAKS 🎄🌲
How the Business Cycle Supercharges Liquidity (and Crushes Cycles
Many of you may remember my BTC cycle thesis I wrote ~1.5 years ago. It was based solely on technical analysis covering previous cycles and did not take into account macro conditions such as global liquidity and the business cycle.
While that has been a guiding light to get me to this point, after further macro analysis, my views have changed a bit.
Based on my technical analysis, a price target north of $200k remains for CRYPTOCAP:BTC , but I now believe we will see some sort of a DOUBLE TOP like we did in 2021; this time in mid-December 2025 and late-March / early April 2026.
The December 2025 top will fulfill the “4-Year Cycle prophecy” which has been fueled by the current boom in global liquidity.
Whereas the March / April 2026 top will come from a booming business cycle (measured by the ISM PMI); something we have yet to see.
As you can see in the 2017 and 2021 cycles, the business cycle cues Alt Season.
I don’t think we see a real one without it.
That’s where people spend the money they made through safer assets such as Gold > Stonks > ₿itcoin etc.
We saw Altcoins, NFTs, Sports Cards, Sneakers, Watches, Collectibles etc go parabolic during this time in 2021. And it just so happened that the market for a lot of these high-risk assets topped around that time.
Here's a link to a Michael Jordan rookie card in PSA 9 condition that peaked around February 2021 right before the business cycle topped.
www.psacard.com
I think Altcoins went on for a bit longer after the business cycle topped because they were native on-chain and had less friction to transact (crime season anyone?).
NFTs saw sustained speculation because of the novelty and innovation they were bringing to the space. NFTs should act more like traditional risk assets this time around, and top slightly after the business cycle.
THE FURTHER WE ARE IN THE BUSINESS CYCLE, THE FASTER LIQUIDITY REACHES RISK ASSETS.
Think about it… everyone and their mother are making a ton of money from a booming business cycle ie hairdressers, uber drivers, personal trainers etc and dumb money finds high-risk assets near instantly. We see this with an uptick in google searches, youtube views etc.
This is why global liquidity with a 10-12 week lead overshoots cycle tops in the past.
An immense amount of Global QE in 2021 created an outlier for a continued pump in liquidity, even after the business cycle topped.
Then in the bear market, liquidity deviates from risk assets again as money moves back to safe havens first such as GOLD, which is a near 1:1 injection, and we see ₿itcoin lag by 10-12 weeks.
We should continue to see large caps do well for the remainder of the year as money slowly rotates out of BTC into ETH, SOL, BNB etc, but small caps don’t start to outperform until the business cycle starts convincingly rising well above 50.
Alternative investments such as sports cards are starting to see a similar rotation. Michael Jordan is the ₿itcoin of sports cards, and many of his cards are well above 2021 all-time highs. Other high-end cards from GOATs such as Tom Brady, Mickey Mantle, Wayne Gretzky etc continue to shatter prior records.
NFTs are also starting to see a resurgence with high-end collections such as Crypto Punks, X-Copy etc.
I’m not completely sure if the first or second top will be higher for CRYPTOCAP:BTC yet, but I’m leaning towards the first one in December.
The aforementioned riskier assets should get the lion’s share of business cycle capital in March / April.
At this nexus we will see the Treasury General Account refill suck liquidity out of markets due to tax season. TGA refills have marked previous tops in 2017 and 2021, so I see no reason for this time to be different.
Yes, this will be a much shorter business cycle, which is caused by a historic amount of money printing during the pandemic. The outcome left the US economy in a high-inflation / high-interest rate environment.
The business cycle represents Main Street, and it is clear that the aftermath of the pandemic has crushed middle and lower income households.
~FIN~
JK
POST REFERENCES:
-The 4-Year Boom and Bust Cycle is by design
-Synchronized Bear Market Bottoms
-If you want to dive deeper into the current macro landscape, you should definitely read the playbook I wrote ~10 months ago. It’s been playing out near-perfectly.

Bitcoin 130,000 – Correction AheadBitcoin
Around the $130,000 level, there is a possibility of a deep correction toward the $74,000 zone.
Do not panic, and do not get carried away by emotions.
This is the market — it plays with your psychology.
The market is geometric. BYBIT:BTCUSDT

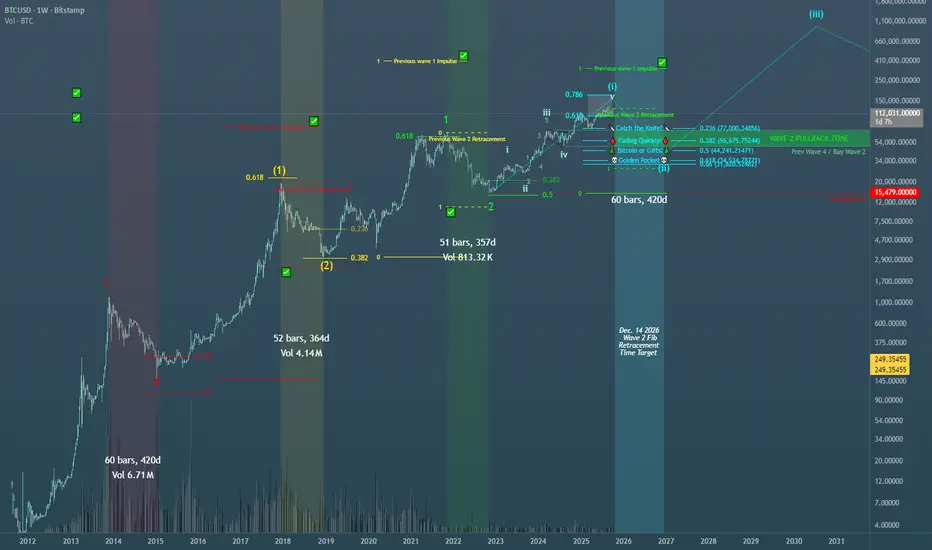
Bitcoin Multi 1,2 Elliott Wave Cycle Analysis: Wave 2 Decryption Shown on the chart is BTCUSD:BITSTAMP on the Weekly Timeframe. This is a breakdown of the Multi 1,2 Elliott Wave Scenario plotted on the chart. This is by far my most bullish scenario for Bitcoin, as we haven't even reached the main wave 3 thrust up, i know its hard to fathom BTC over 1 million dollars, but this is one way to get us beyond that.
Historically the 1,2 pattern has mimicked past 1,2 fractals, usually returning smaller gains and retracements compared to its past 1,2 structure. This is only a guideline for the 1,2 pattern and not a hard rule, although BTC has maintained the right look for this Multi 1,2 Structure throughout its cycle. We are already on the 4th 1,2 pattern continuing the bullish movement to the upside. I have this degree of trend as the final 1,2 before the wave 3 thrust up. Probabilities get lower the more 1,2s we build leading to the 3rd of 3rd of 3rd of 3rd wave thrust, this is already a dream scenario on the Weekly Timeframe, not often do we see these "Rare Unicorn" patterns play out on a HTF, but more often on <15 min TF the rare pokemon are spotted more frequently.
I have highlighted my preferred buy area for the coming wave 2 pullback. The 2nd waves have reached higher fib ratios while still remaining smaller than the previous 1,2 ratios, showing the right look between impulsive and corrective structures thus far. Considering this, wave 2 could surprise us all (MMs known for this) and retrace to the .618 - .66 Golden Pocket area, while still remaining smaller than its past 1,2 fractal. I hope someone finds this useful or at least interesting! Happy Trading
DKNG Update | Crash AheadOne of the best fractal overlays I've seen with some Elliott Waves to go with it.
Price is still in a uptrend but with growing sellers It'll come to an end similar to the last fractal.
During the 3rd wave in the last pattern price experienced its first pullback at (B), and its second at correction wave 4 and the third after the last wave before we witnessed the last push in buyers.
This current cycle price is in a similar stage with a swing low at (b) meaning that we could see another run-up towards major resistance ($63).
This would be the final blow-off-top in general markets. TVC:RUT is already showing signs of weakness which works well with this TA example.
When the time is right I'll do another TA for the downfall. For now I'm bullish but for the horizon I'm very bearish.

BTC: Prepare for 2026Following the 4 year cycle, The Top is almost in.
Tapping an uptrend and sitting at 111K the 21 Weekly MA. Holding this level i find very important. Although i believe an we will see higher prices in Q4, the top could also be in.
Following the 4 year cycle, after the TOP comes "Crypto Winter". Everything cools off. Emotionally, many will reach the state off Despair and Capitulation. You should not be in that state because at that time you have "Zero" holdings in crypto (at the end off Q1 2026 you should have close to zero crypto exposure) , probably sooner.
We can extrapolate when the next BUY TIME is. We don't know the exact price, hence the big range. But we do know +- the Time. Currently marked 28 september - 21 December. Wherever the price is there, is probably a good Longer Term investment, for that next cycle.
While the last hands are selling there crypto, we will slowly start buying them. setting up the stage for the next 4-year cycle.
Price wise i'm looking at 73K is the minimum target and 35K is the maximum target. There was huge institutional buying between 30K and 70K. If there are many institutional outflow in the coming year, then lower targets are probable. If they keep their holdings, they'll want to protect the rice and create a floor somewhere..
So yeah. 73K - 55K - 42K - 35K

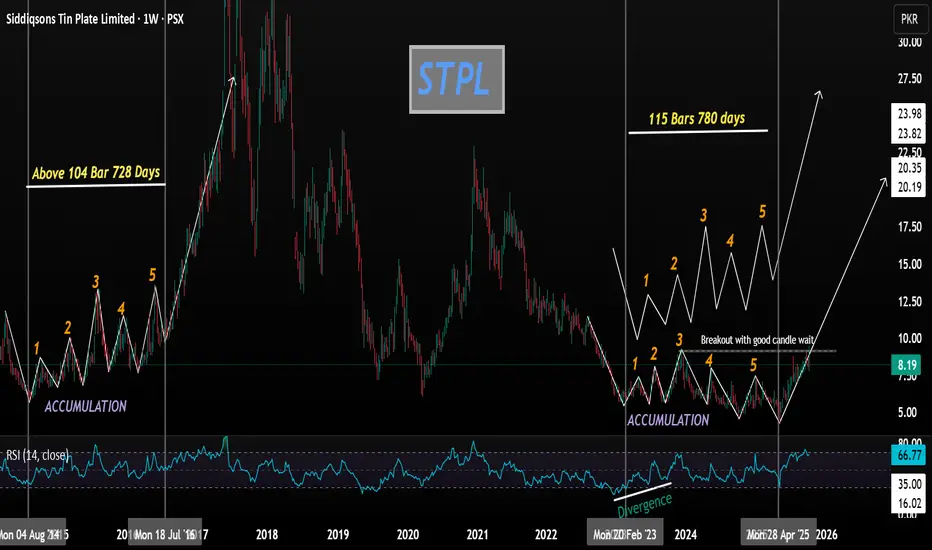
STPL Technical Analysis (Pakistan Stock Exchange)STPL Technical Analysis (Pakistan Stock Exchange)
Based on a thorough analysis of STPL's time cycles and price structure, the stock exhibits a pattern similar to the one observed between 2014 and 2016. During that period, STPL spent significant time forming a structured five-point pattern (1, 2, 3, 4, 5), where point 3 marked a key high that eventually broke out, reaching a peak of 40.
Currently, the stock is forming an almost identical pattern, again showing a clear five-point structure (1, 2, 3, 4, 5), with point 3 acting as a crucial high—mirroring the previous cycle.
The key resistance at 9.3 (corresponding to the previous point 3 high) was recently tested, and the price touched 9.45 with significant volume on the last weak candle. Following this, the price pulled back, creating a potential entry zone. A strong candle formation at this level would confirm a favorable entry opportunity.
Based on this analysis:
First target: 20
Second target: 30
Ultimate target: 40
All indications suggest that the stock is likely to achieve these targets smoothly, following the same cycle and character as the previous accumulation and breakout pattern.
Bitcoin Weekly Cycle Analysis (BTC/USD) Understanding the Halving Cycle Through the “Cycle Repetition Model”
This chart represents the Bitcoin (BTC/USD) weekly timeframe, illustrating a detailed view of the price cycles driven by Halving events.
The structure follows a “Cycle Repetition Model” — where each phase mirrors the previous one both in time symmetry and price amplitude.
Below is a complete technical breakdown in terms of structure, timing, and market behavior.
🧭 Bitcoin Halving Cycle Structure
Bitcoin has shown remarkably consistent cyclical behavior — repeating major bull and bear phases roughly every 1,064 days (≈ 152 weekly bars, or about 3 years).
Each full cycle can be divided into two primary phases:
Expansion Phase (Bull Market): lasts around 1,000 days, typically fueled by the Halving narrative and liquidity inflows.
Correction Phase (Bear Market): lasts roughly 364 days (~1 year) after the peak, driven by exhaustion and profit-taking.
📊 Market Structure
Each Bitcoin cycle follows an almost identical structural rhythm — the same psychological progression through four distinct phases:
1. Accumulation Phase
After a major crash of 80% or more, Bitcoin builds a narrow sideways base for 6–12 months.
Smart money starts accumulating while public interest declines sharply.
2. Expansion Phase (Bull Market)
Price breaks above long-term resistance, triggering a parabolic rally.
Volume surges as new participants flood in and mainstream attention returns.
3. Distribution Phase (Late Bull Stage)
Volatility increases. Price may make marginal new highs, but RSI and Momentum diverge.
Institutional investors and early holders begin taking profits gradually.
4. Correction Phase (Major Reset)
Bitcoin retraces 75–85% from its cycle high.
This downtrend typically lasts around 52 weekly bars (~1 year) before a new base forms.
🔍 Time Symmetry (Cycle Timing)
Each Bitcoin cycle has demonstrated almost perfect time symmetry — roughly 1,064 days up followed by 364 days down.
The blue dotted arcs on the chart mark the “Cycle Arcs,” connecting each Halving event with the subsequent market peak.
If historical rhythm persists, the current cycle (2023–2026) is expected to unfold as follows:
Cycle Peak: around mid-2025
Next Major Low: around mid-to-late 2026, potentially marking the bottom of the next accumulation phase
⚙️ Key Price Levels
Primary Support: $31,500 — the current mid-point of the active cycle.
A confirmed break below this zone could signal entry into the full Correction Phase.
Potential Accumulation Zone (if -75% correction repeats)
Key Resistance Levels: $65,000 and $100,000, both previous cycle peaks and major psychological barriers.
🧩 Technical Outlook
Trend: Long-term uptrend remains intact, but the structure is showing signs of late-cycle weakness.
Momentum: Bearish divergence forming — similar to the late stages of 2017 and 2021.
Volume: Declining throughout the recent rally, indicating fading buyer strength.
Pattern: The overall structure resembles a Double Distribution Top, hinting at potential macro consolidation or correction ahead.
🎯 Forecaster’s View
“Bitcoin appears to be entering the final stage of its expansion cycle.
If the historical rhythm holds, the market could experience another major correction in 2026 — before beginning a new accumulation phase post-Halving.”

Symmetry <Danger Zones>BTC follow Symmetry
just wait for entry signal
Price symmetry refers to comparing the size of past and current price movements to identify balance or repeating patterns.
It assumes that the market tends to make similar upward and downward moves in terms of price distance (such as wave length or correction size).
Analysts measure previous price swings and compare them with the current move to identify potential reversal or continuation points.

EURUSD 4H – Testing Strong Demand ZoneFX:EURUSD
Structure | Trend | Key Reaction Zones
Market remains in a downtrend channel, but price is now approaching a strong demand zone near 1.1570–1.1600.
The falling wedge structure suggests potential bullish reversal soon if liquidity sweeps the lows.
Mid-range resistance lies near 1.1658 and 1.1769.
Market Overview
EURUSD continues to respect its descending structure after rejection from the 1.1870 zone. However, buyers may soon step in as the pair nears a high-demand region, historically known for strong reversals. A clean reaction or double-bottom pattern could trigger a short-term bullish rally back toward mid-zone resistance.
Key Scenarios
✅ Bullish Case 🚀 → Rejection from 1.1570 zone → 🎯 Target 1.1658 → 🎯 Target 1.1769 → 🎯 Extended 1.1870
❌ Bearish Case 📉 → Break below 1.1570 → 🎯 Target 1.1500
Current Levels to Watch
Resistance 🔴: 1.1658 / 1.1769
Support 🟢: 1.1570 / 1.1500
⚠️ Disclaimer: This analysis is for educational purposes only. Not financial advice.

BITCOIN ENDING DIAGONAL: $160K OR $120K? (1HR CRITICAL UPDATE)While I typically avoid short-term CRYPTOCAP:BTC analysis, this 1hr setup is too critical to ignore. Price is painting a textbook Elliott Wave pattern that could deliver a explosive move.
CURRENT STRUCTURE:
• Waves 1 & 2 ✅ COMPLETE
• Wave 3 (extended) now forming an ENDING DIAGONAL
• Current trading near critical "BUY BACK Area"
IMMEDIATE SCENARIOS:
BULL CASE (70%):
• Bounce from current BB-Zone → Push to complete Wave 3 at $129K-$130K
• Brief Wave 4 correction to $125K
• Wave 5 launch toward $136K+
• Final blow-off top: $140K-$160K
BEAR INVALIDATION:
• Break below $123K → Drop to $120K
• This invalidates the diagonal pattern
KEY LEVELS:
• Must Hold: $123K
• Buy Zone: $121K-$123K
• Wave 3 Target: $129K-$130K
• Wave 4 Pullback: $125K
• Wave 5 Target: $136K+
The next few hours are CRITICAL. This ending diagonal suggests exhaustion in the current move, we either get one final push to $130K or breakdown to $120K.
Like if you're watching these levels! Share if you agree with this analysis! Comment with your take!

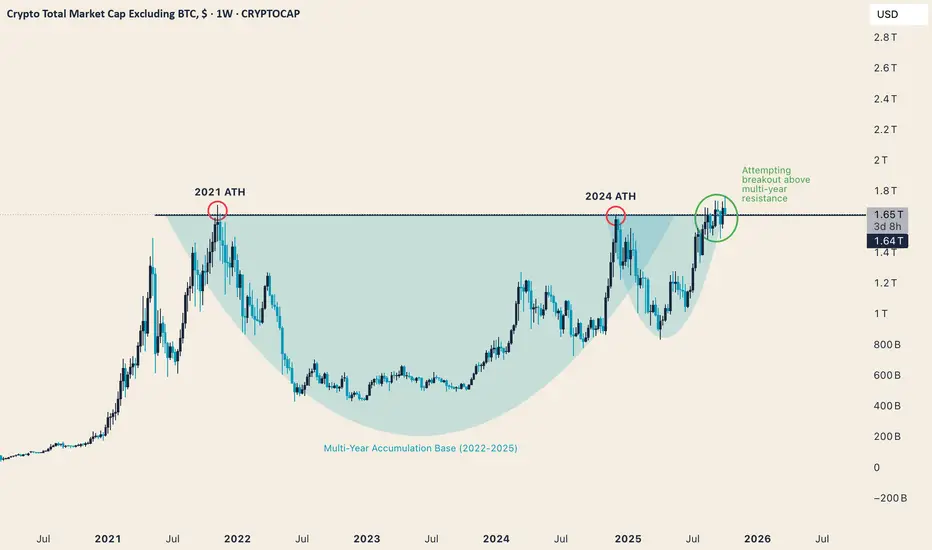
TOTAL2 (Altcoin Market Cap) - Multi-Year Resistance TestThe altcoin market is retesting the 1.7T level, aligning with both the 2021 and 2024 all-time highs.
This marks the first confirmed attempt at price discovery since the last cycle top.
Key Observations:
TOTAL2 remains structurally bullish above the 2024 higher low.
2021 + 2024 ATHs = confluence resistance.
Sustained weekly closes above = breakout confirmation.
Rejection could signal another consolidation before expansion.
If confirmed, this would be the start of a macro expansion phase for alts - but structure confirmation remains essential.
📊 Educational chart. Not financial advice. Past performance ≠ future results.
Bitcoin (BTC), End of Cycle Season Based on Cycle DurationBINANCE:BTCUSDT
Bitcoin appears to have already formed its peak within the current bullish cycle and may now be preparing for a correction.
Alternatively, if BTC makes another attempt to reach a new all-time high within October, that period could mark the final peak of this cycle.
Looking at historical data, Bitcoin has shown a repeating pattern —
an uptrend lasting approximately 3 years and 11 months (1,065 days) from the bottom,
followed by a downtrend of about 1 year (365 days) from the peak.
During down cycles, the cycle low has typically formed between the EMA 50 and EMA 100.
Backtesting monthly charts shows that Bitcoin often breaks below the EMA 50, finds support above the EMA 100, and then breaks through the Ichimoku Cloud, signaling the start of a new bullish cycle.
Become an early follower and be part of the journey.🚀
I am Korean and I used Google Translate.

Gold Price: Time to Sell?Gold Price: Time to Sell?
Analysis from Chart Review: October 9, 2025
The Spot Gold (XAU/USD) chart suggests the current massive uptrend, following an Elliott Wave structure, is in its final phase.
We are currently tracking the extension of Wave (5).
The Current Outlook
Final Target Zone (Potential Peak): The technical projection for the peak of this move is around $4,059 to $4,750.
Initial Sell Signals: The price is currently challenging the upper boundary of the long-term channel. We see initial resistance targets at:
$3,990 (near current level)
$4,059 (main Wave (5) target)
Key Caution Points
The market is showing signs of fatigue as it reaches the blue channel's limit. Caution is advised as the price tests this major resistance level.
A correction is expected upon completion of Wave (5). Initial support levels for any sharp correction are seen at the Fibonacci retracements:
(a): $3,700
(b): $3,390
In short: We are in the final push of a multi-year bull run. The selling window is opening soon.

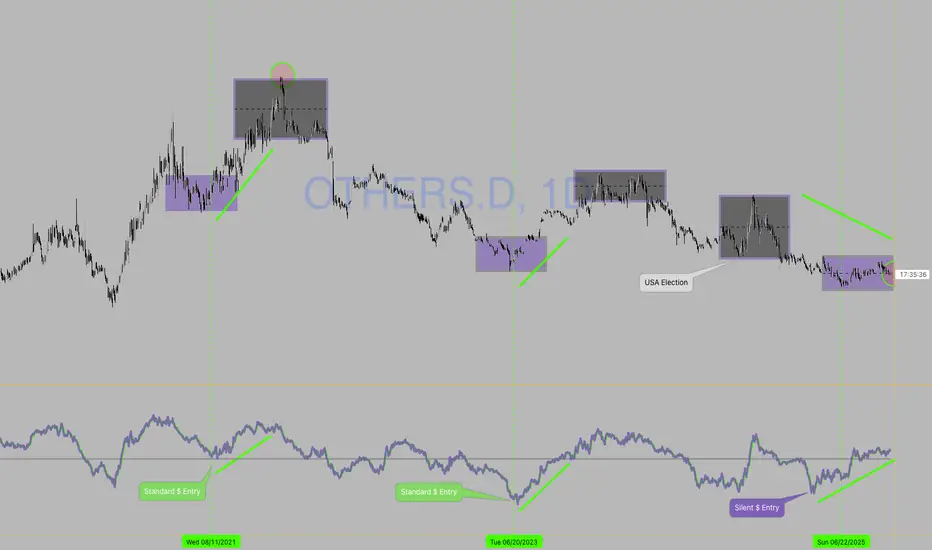
Macro Alert: The Stealth Flight 2 Alts (Tariffs, Gold & Privacy)🚨 MACRO ALERT: The Silent Surge — Altcoins Accumulating Undetected Since April
Chart: CRYPTOCAP:OTHERS.D
━━━━━━━━━━━━━━━━━━━━━━━━━━━━━━━━━━━━━━━━
📊 The Setup
While the mainstream remains fixated on Bitcoin's swings, a quiet but significant capital rotation into altcoins is underway. This move, largely undetected by the broader market, is being fueled by shifting global macroeconomic tides and a growing institutional hunt for wealth preservation and financial privacy .
━━━━━━━━━━━━━━━━━━━━━━━━━━━━━━━━━━━━━━━━
🔴 THE CRISIS: Multiple System Failures Converging
🏦 BIS Warning: Global Liquidity Crisis
↓
🇯🇵 Japan: Unsustainable debt from fiscal stimulus
🇫🇷 France: 0.6% growth in 2025, economic stagnation
↓
💸 Coordinated failure of fiat monetary policy
⛓️ Government Attacks on Safe Havens
↓
🇺🇸 U.S. Gold Tariffs: 39% on major imports
Physical metals face capital controls & taxation attacks
Traditional assets no longer safe from state control
🔒 Even Crypto Has Centralization Issues
↓
📜 GENIUS Act: Stablecoins expand M2 money supply (monetizing debt via blockchain)
🏢 XRP: Concentrated token control raises manipulation concerns
━━━━━━━━━━━━━━━━━━━━━━━━━━━━━━━━━━━━━━━━
🟢 THE SOLUTION: Where Capital Is Flowing
Smart money is seeking assets with:
• TRUE decentralization
• Privacy features
• Fixed supply
• Institutional-grade infrastructure
The Data Confirms It:
🔐 Privacy Coins (XMR, ZEC): +71.6% in 2025
📊 CRYPTOCAP:BTC: +27.1%
📊 CRYPTOCAP:ETH: +33.4%
📈 OTHERS.D: Rising quietly
This is sophisticated money moving in, not retail FOMO.
━━━━━━━━━━━━━━━━━━━━━━━━━━━━━━━━━━━━━━━━
💥 The Macro Catalyst: Why This Is Happening Now
⚡ Gold Under Attack: The recent 39% U.S. tariff on major gold imports has rattled the traditional safe-haven market, creating artificial scarcity and signaling a broader trend of government control over monetary assets . When even physical metals face intervention, capital seeks alternatives outside increasingly controlled systems.
🚨 The BIS Warning Nobody Is Discussing:
The Bank for International Settlements is quietly sounding alarms on global liquidity risks:
• 🇯🇵 Japan's fiscal stimulus → unsustainable debt levels
• 🇫🇷 France → 0.6% growth (stagnation)
• 💸 Result: Coordinated fiat monetary policy failure
🪤 The Stablecoin Trap:
The U.S. GENIUS Act is expanding M2 money supply through the back door via stablecoins:
→ Legitimizing stablecoin issuance backed by Treasury bonds
→ Monetizing debt while calling it "innovation"
→ This isn't decentralization—it's the Fed with a blockchain wrapper
━━━━━━━━━━━━━━━━━━━━━━━━━━━━━━━━━━━━━━━━
🎯 Macro Pressure → Altcoin Opportunities
😰 Worried About: Wealth Confiscation/Control
💡 Consider: Financial Sovereignty & Privacy
🔍 Examples: CRYPTOCAP:XMR , CRYPTOCAP:ZEC
📈 Catalyst: Zcash surged 150%+ on institutional demand (Grayscale Trust)
😰 Worried About: Currency Devaluation & Inflation
💡 Consider: Scarce, Decentralized Stores of Value
🔍 Examples: Altcoins with fixed supplies + robust decentralized governance
🔑 Key: Assets that can't be inflated or controlled by single entities
😰 Worried About: Traditional Finance Instability
💡 Consider: Institutional-Grade Blockchain Infrastructure
🔍 Examples: HBAR (corporate governance) & XRP (cross-border payments)
⚠️ Note: Focus on real-world utility beyond speculation
━━━━━━━━━━━━━━━━━━━━━━━━━━━━━━━━━━━━━━━━
What to Watch For
✅ Confirmation: Strong, high-volume breakout above recent range high on CRYPTOCAP:OTHERS.D
🔍 The Privacy Pulse: Continued strength in privacy coins ( CRYPTOCAP:XMR , CRYPTOCAP:ZEC , XVG.D) is a key leading indicator. Note: Privacy coins face regulatory challenges and have been delisted from some major exchanges.
❌ Invalidation: Break and close below key support zone (April low structure) would suggest macro fears haven't overcome broader market uncertainty.
━━━━━━━━━━━━━━━━━━━━━━━━━━━━━━━━━━━━━━━━
🎯 The Bottom Line
The gold tariff is a symptom of a larger disease: eroding trust in neutral, non-government monetary assets . This is forcing a "regime change" in capital allocation.
As this realization dawns on more investors, the quiet accumulation in altcoins—particularly those offering privacy, sovereignty, and real-world utility —could explode into the next major market narrative.
💭 Smart money is moving early. The question is: will you recognize this shift before it becomes obvious?
━━━━━━━━━━━━━━━━━━━━━━━━━━━━━━━━━━━━━━━━
⚠️ Disclaimer: This is macroeconomic observational analysis and is not financial advice. Always conduct your own research (DYOR) and manage risk appropriately.
Cheers!
Etoro - Technical laggard reversal Ahead? Etoro has experienced a bad beating since its IPO - predominantly a result of its poor financial numbers, poor laggard to its peers (IBKR / HOOD which have undoubtedly done very well in drumming up attention).
What I am seeing here is the potential of a laggard reversing within short - mid-term horizon.
Below is a quick summary for its poor share performance by Mr AI.
1. Weaker Sequential Earnings and Profit Normalization
The company’s Q2 results, while beating headline expectations, showed a nearly 50% quarter-over-quarter drop in net profit and a sequential decline in adjusted EBITDA and net contribution. This signaled that the surge in trading seen around the IPO was not sustainable, raising concerns that strong Q2 results were more of a one-off event than a new baseline for growth.
2. Decline in Trading Activity and Revenue Dependency on Crypto
Trading volumes and activity “normalized” after April’s volatility, with total trades slipping year-over-year despite a brief revenue boost. Notably, over 90% of eToro’s revenue comes from crypto trading, making its performance highly sensitive to swings in crypto market sentiment—a risk that became clear as the retail trading boom cooled and Bitcoin’s new record high failed to drive a lasting spike in engagement.
3. Rising Expenses and Margin Pressure
Heavy marketing expenditure and increased investment in platform enhancements post-IPO have led to a surge in operating costs, calling into question future profitability margins even as revenues grow.
4. Analyst Downgrades and Lowered Price Targets
Several investment banks (Mizuho, KBW, Jefferies, UBS) cut eToro price targets and estimates, often citing weaker trading revenue per account and a lower overall take rate. These moves weighed further on investor sentiment, despite some analysts maintaining positive long-term views.
In summary, with so much negativity being priced into the stock, short interest wearing off, selling pressure cooling off and potential postive rerating ahead, there should be more upside potential than downside risk within the next 3 month.
Entry: ~$40
Exit:~$53
Holding Period: 3 month
Upside: 32.5%
APR: 207.7%
