NVIDIA – Bumping Up Against Record HighsNVIDIA’s share price is experiencing an interesting run into the end of September as traders try and work out whether it can extend its run of gains through all time highs sitting just above the 184 level (184.55 Sept 22nd), a line in the sand that has capped the upside since the start of August (more on this in the technical update below).
With NVIDIA being the biggest company in the world by market capitalisation, currently sitting at a huge $4.34 trillion (No.2 Microsoft, $3.79 trillion), and it being the bellwether for AI performance, it’s not short of news flow to create periods of volatility.
Only on Monday, the company announced a $100 billion link up with Open AI to build new data centres and expand AI infrastructure together, which sent its stock price up 4% towards that 184 resistance, only for Federal Reserve Chairman Jerome Powell in a speech on Tuesday to send it back lower again as investors banked profits, when he offered a more cautious outlook towards future Fed rate cuts into the end of the year.
Looking into the end of the week, the focus may be on US economic data again, with the release of the final US Q2 GDP reading at 1330 BST today, and perhaps more importantly, the PCE index, which is the Fed’s preferred inflation gauge, due tomorrow at 1330 BST. Traders seem to be very sensitive to these inflation readings, given that they could determine whether the Fed is able to cut interest rates again before the end of 2025. Any deviation from expectations, to the up or downside could have an outsized impact on sentiment towards the NVIDIA stock price into the Friday close.
Technical Update: Watching Record Highs
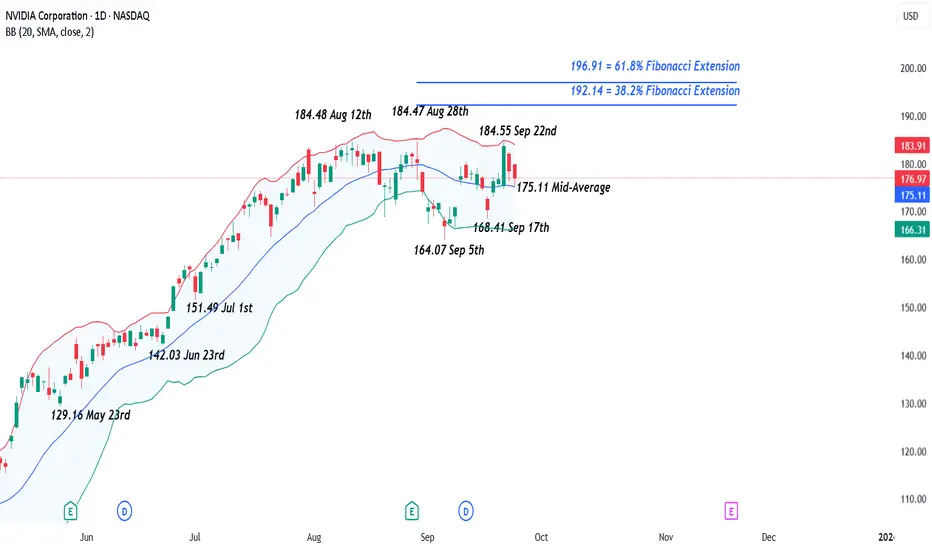
Since reaching its 184.48 high on August 12th, NVIDIA has twice attempted to break and close above this resistance, on August 28th and September 22nd. The latest attempt did set a new intraday high of 184.55, but as the chart below shows, resistance held again by the close, triggering another sell-off from that level.
This price action confirms the 184.48/184.55 range as a potentially key resistance area. A successful close above it could lead to a further phase of price strength.
While not a guarantee of continued upside, a closing break above 184.48/184.55 could open the path to 192.14, a level equal to the 38.2% Fibonacci extension. If this level were to also give way on a closing basis, the next resistance may prove to be 196.91, which is the higher 61.8% extension.
Of course, with resistance at 184.48/184.55 still capping price strength, there's also the risk that support levels could give way, possibly suggesting further downside in price activity.
Initial support may now be marked by 175.11, the Bollinger mid-average, which is currently containing the latest pullback in price. While a close below here may not confirm extended price weakness, it might open the door to test lower supports at 168.41, which is the September 17th low, possibly even 164.07, a level equal to the September 5th extreme.
The material provided here has not been prepared accordance with legal requirements designed to promote the independence of investment research and as such is considered to be a marketing communication. Whilst it is not subject to any prohibition on dealing ahead of the dissemination of investment research, we will not seek to take any advantage before providing it to our clients.
Pepperstone doesn’t represent that the material provided here is accurate, current or complete, and therefore shouldn’t be relied upon as such. The information, whether from a third party or not, isn’t to be considered as a recommendation; or an offer to buy or sell; or the solicitation of an offer to buy or sell any security, financial product or instrument; or to participate in any particular trading strategy. It does not take into account readers’ financial situation or investment objectives. We advise any readers of this content to seek their own advice. Without the approval of Pepperstone, reproduction or redistribution of this information isn’t permitted.
Community ideas
The Options Mirage: The Jackpot That’s Rigged Against YouMost retail traders fall in love with options because they seem to offer the impossible: with just a few hundred dollars you can dream of outsized returns. Fast money, easy money—at least that’s the story. With the right broker account and a handful of trades, the dream of becoming rich feels just around the corner.
What you’re not told—and what few truly understand given the complexity of the product—is that the “explosive payout” is not an opportunity. It’s a price. A very high one. And often inflated by the industry itself, knowing that the average investor (or rather, gambler) has no real way to calculate what they’re actually paying for. What you’re really buying is access to an extremely low probability of success, dressed up as a sophisticated strategy.
Yes, it’s the same psychology that drives lotteries and sports betting. And in finance, the odds aren’t any kinder.
The Baseline: the Where
At its simplest, speculation is about anticipating an up or down move in price.
Think it’s going up? Buy and aim to sell higher.
Think it’s going down? Sell and aim to buy back lower.
It sounds simple, but anyone with more than a month of trading experience can tell you it’s anything but. No one can predict the future with certainty. Still, this is at least a binary game: two mutually exclusive outcomes, like flipping a coin.
In technical terms, the market starts as a 50/50 distribution. With skill, analysis, and discipline, you might bias those odds slightly—say, 60/40 in your favor. That bias, repeated consistently, is what we call an edge. And with an edge, the path to long-term success is paved.
The Illusion of Acceleration
But let’s be honest: who wants to grind out a 60/40 edge slowly? We’re here for the Lamborghini, right? And the sooner the better.
That’s where the industry steps in with its “solution”: options. The promise is seductive—leverage the process, accelerate the outcome. With little money down, you can aim for massive returns. What’s not to like?
The problem is that the acceleration doesn’t come for free. To deliver those explosive payouts, the game adds layers of complexity.
From Where… to How and When
In options, you don’t just need to be right about where price is going.
You also need to be right about how it moves. That’s volatility—the speed and amplitude of the move. Even if you guess the direction correctly, if the move isn’t strong enough to beat strike + premium, you lose.
And then comes the when. Options expire. Time works against you. With the rise of 0DTE options, this window has shrunk to a single day. You might be perfectly right on direction and volatility—but if it happens tomorrow instead of today, your trade is worthless.
Now here’s the key point: this isn’t additive complexity. It’s multiplicative. Each layer collapses your probability of success exponentially. Even though the mathematical proof could be enlightening, I have promised not to use heavy math in this blog. All you need to know is this: in the majority of cases, that collapse in probability is not evenly compensated by the outsized payout. And this is exactly what most retail traders fail to perceive.
It’s not just that you’re playing a harder game—it’s that you’re playing a biased one, where the odds are stacked even further against you.
The Lottery Bias: The Cognitive Trap
Here’s where psychology plays its cruelest trick. The lower the probability of success, the higher the payout offered. In fact, it’s not even the full payout you deserve—it’s a discounted, haircut payout, cleverly packaged so you don’t notice because the potential number is so large. And that number lights up the brain like a jackpot.
The industry knows this. It builds its business on the fact that humans systematically overestimate tiny probabilities and underestimate the certainty of losing. Retail traders convince themselves they’re being clever: risking little for the chance at something huge. But the math is merciless—the expected value is brutally negative.
The market is not handing you an edge. It’s dismantling any possibility you had of one. That giant payout you see? It’s not a gift—it’s a warning label.
And yes, I know you can point to stories about the guy who hit the jackpot, who “proved the math wrong.” But let me ask you this: do you know what survivorship bias is? If you don’t, and you’re trading options, here’s some professional advice for free—go and read about it before you place your next trade.
The Real Path to the Lambo
What gets sold as “smart leverage” is, in truth, just a lottery ticket wearing a suit. The Lambo doesn’t come from hitting jackpots. It comes from consistency—from repeating disciplined decisions with positive expectancy until compounding does its quiet but powerful work.
And yes, I know most traders are in a hurry. The good news? The process can be accelerated—but not by gambling on options with negative expectancy. It can be accelerated using technical, rational tools. Once an edge is established, leverage makes sense. That’s where concepts like the Kelly criterion come in: scaling growth aggressively, but without walking straight into ruin. (I’ve already written about Kelly earlier in this blog: here.)
Conclusion
We’ve stripped the illusion bare: more conditions don’t make you smarter, they make you less likely to succeed. What feels like a shortcut is nothing more than a statistical mirage—the financial equivalent of a lottery ticket, marketed to you as a “highway to riches,” exploiting your belief that complexity equals intelligence.
Unfortunately, the narrative is powerful, because it preys directly on cognitive bias. I know I’m swimming against the tide here. I know this post won’t go viral. I don’t expect many to believe what the math has to say about options trading.
But maybe, just maybe, a small number of traders reading this will see beneath the surface and save their time, energy, and money for better pursuits. If that’s you, then this post has already done its job.
If you can resist the mirage and stick to building real edges, you’ve already won a key battle—and most likely saved yourself a costly trading lesson.

The Bear Market Isn't Coming? Old BTC Playbook is a TrapFor years, traders have relied on Bitcoin's predictable cycles. We look for the same clues, the same topping signals, and the same patterns. But what if the market has evolved? What if the playbook we've all been studying is now a trap?
This analysis dives deep into key indicators across all three major bull runs, comparing the RSI, MACD, Volume, and especially the Bollinger Band Width Percentile (BBWP). The data suggests that while some classic bearish signals are flashing, the market's underlying structure is telling a very different, and potentially much more bullish, story.
A Tale of Two Cycles: The Historical Baseline
To understand where we are, we must first look back.
The First Bull Run (2015-2017): This cycle was defined by raw, explosive power. The weekly RSI crossed above 80 a staggering four times. However, the end was confusing. We had bearish RSI divergences fighting against bullish MACD. The primary exit signals were a massive spike in selling volume and a BBWP reading that finally hit 94%, signaling trend exhaustion. It was effective, but messy.
The Second Bull Run (2018-2021): This cycle top was much clearer and became the "classic" model for many traders. The RSI crossed 80 only twice, and the end was signaled by a textbook combination of:
Classic bearish divergences on the RSI and MACD.
Obvious selling pressure at the top.
Crucially, the BBWP spectrum crossed 90% three separate times, screaming trend exhaustion before the final downturn.
The Current Cycle: A New Breed of Bull 📈
Now, let's analyze our current cycle, which began in November 2022. On the surface, some things look familiar, but the engine of this trend is behaving in a completely unprecedented way.
The Familiar Signs (The Bear Case):
Yes, we can see a classic bearish divergence forming on both the RSI and MACD. Furthermore, the recent buying volume, while still okay, is showing signs of weakness compared to the explosive start of the rally. This is what is causing many analysts to call for a cycle top, just like before.
The Unprecedented Anomalies (The Bull Case):
This is where it gets interesting and why the old playbook may fail.
No BBWP Exhaustion: Unlike the (2015-2017) (2018-2021) bull runs, the BBWP spectrum has not crossed 90% a single time during this entire uptrend. The volatility has never reached the levels of euphoria and exhaustion that marked previous tops. The trend, while strong, has not shown signs of being "finished."
The Contraction Anomaly: This is the most compelling signal on the chart. Historically, a major BBWP contraction (the indicator squeezing down) signals that energy is building for a massive expansion in price. This event has almost always marked the beginning of a new bull phase or the start of a major move up. Yet, here we are at the supposed end of the cycle, and the BBWP is contracting again. This has never happened at a cycle peak before. This odd behavior suggests that instead of winding down, the market could be coiling up for another powerful move, Also the number of contractions in this cycle is much higher than the pervious cycles which explains the elliot waves unexpected targets
Elliott Wave Strength: While I have not drawn the Elliott Wave count here because every trader's interpretation can be subjective, my personal count indicates that the current wave structure is targeting prices significantly higher than the current all-time high.
Summary and Final Thoughts
To summarize, while we have some classic, textbook bearish signals that would have marked the top in (2018-2021), we also have powerful, unprecedented evidence suggesting this cycle is different.
The lack of a BBWP exhaustion signal (>90%) is a major deviation from the last 2 cycle top.
The current BBWP contraction at a "cycle end" is a massive anomaly. This is typically a pre-trend signal, not an end-of-trend signal, and could be hinting at a major breakout ahead.
This is not a guarantee of a continued bull run, but rather a data-driven observation that the market is showing a structure we haven't seen before. Relying solely on the old playbook could be a mistake. The market is evolving, and our analysis must evolve with it.
I have marked every anomaly and pattern on the chart, You can zoom in and analyze for yourself
I'm open to all discussions and opinions in the comments
Trade safe and keep an open mind.

QE and YCC: What does it all mean?ECONOMICS:USCBBS
CBOT:ZB1! CBOT:ZN1! CME_MINI:NQ1!
There is growing market speculation that the Fed may tolerate inflation above 2% for longer, consistent with its Average Inflation Targeting (AIT) framework introduced in 2020.
This also implies that real rates i.e., nominal rates minus inflation are likely to fall significantly. Given this, we anticipate gold to continue trending higher as the U.S. dollar's purchasing power erodes with mounting debt, persistently higher inflation, and falling real yields.
What is QE?
Quantitative Easing (QE) refers to the Fed injecting liquidity into financial markets by purchasing large quantities of assets such as Mortgage-Backed Securities (MBS) and U.S. Treasuries, especially during periods of economic stress like the Global Financial Crisis (2007–2008) and the COVID-19 downturn.
How Does QE Work?
Asset Purchases: The Fed buys large volumes of Treasuries and MBS from financial institutions.
Balance Sheet Expansion: These purchases expand the Fed's balance sheet (now hovering near $6.6 trillion, per FRED).
Increased Liquidity: Banks receive excess reserves in exchange, increasing system-wide liquidity.
Lower Interest Rates: Demand for bonds pushes prices higher and yields lower.
Economic Stimulus: Lower borrowing costs promote credit creation, investment, and consumer spending.
However, a key drawback of QE is asset price inflation. As seen between the GFC and the COVID-19 pandemic, low rates and excess liquidity drove significant appreciation in equities, housing, and other financial assets, even while consumer inflation remained near target.
QE vs. Stimulus Checks
If traditional interest rate policy is Monetary Policy 1 (MP1), then QE is MP2. Stimulus checks, or government handouts, fall under MP, a fusion of monetary and fiscal policy.
While QE primarily injects liquidity into financial institutions, stimulus checks inject purchasing power directly into households. This approach where the Treasury issues debt and the Fed purchases that debt, stimulates demand for real goods and services. We saw this during the post-COVID recovery, which brought a sharp rebound in consumer activity but also a surge in inflation, reaching a peak of 9.1% in June 2022 (CPI YoY).
QE impacts Asset Price Inflation
Stimulus Checks impact Goods & Services Inflation
What is YCC? (Yield Curve Control)
Yield Curve Control (YCC) is a policy whereby the central bank buys government debt across various maturities to control yields not just at the short end (via rates), but across the entire yield curve.
A prime example is the Bank of Japan, which has used YCC since 2016 to anchor 10-year JGB yields near zero. The Fed has not formally adopted YCC, but market participants believe it may lean in that direction in the future especially during crises where long-end rates rise undesirably. Mounting US debt and rising long end yields may prompt the Fed to step in and adopt YCC like BoJ has done previously.
Front-End Control: Managed via policy rates
Long-End Control: Central bank buys 5Y, 10Y, 20Y, 30Y Treasuries to anchor yields
Potential Risks of YCC:
Credibility Risk: If inflation rises while the central bank suppresses yields, it may lose market trust.
Currency Pressure: Artificially low yields may trigger speculative pressure on the currency (as seen with the yen under BoJ YCC).
We’ve kept this concise and digestible for now, but there’s more to unpack—especially on the long-term implications of coordinated monetary-fiscal policy (MP3), debt sustainability, and central bank credibility.
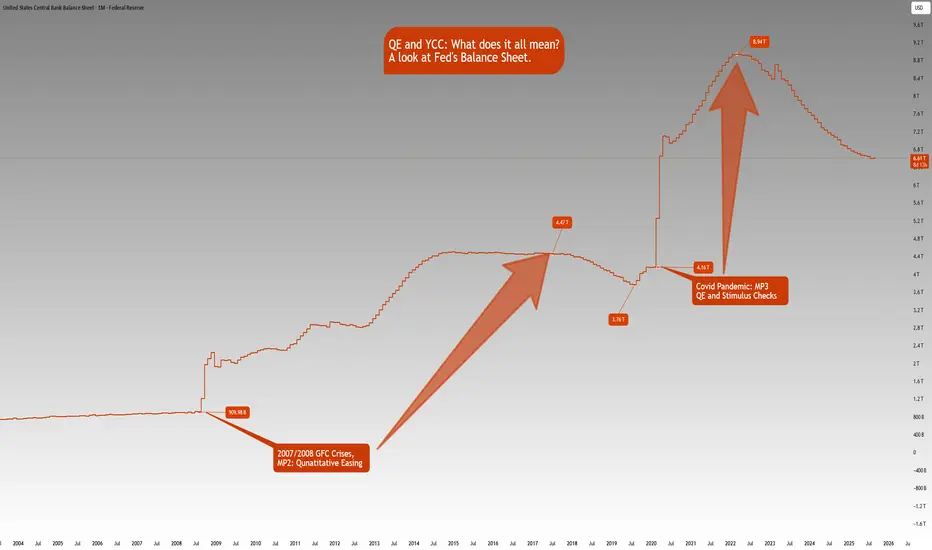
The Fed’s balance sheet chart shows how Fed’s balance sheet has increased:
Aug 1, 2008: $909.98B
Jul 1, 2017: $4.47T
Aug 1, 2019: $3.76T
Feb 1, 2020: $4.16T
Mar 1, 2022: $8.94T
Aug 1, 2025: $6.61T
Note that this is not just a US phenomenon. It is a world wide phenomena looking at many of the developed and emerging markets. The Debt to GDP ratios are increasing, Central Banks balance sheets are rising in tandem with rising government debt.
With the rate cutting cycle starting, it is a matter of time that we also see QE restarting.
If you’d like us to dive deeper into any of these topics in future educational blogs, let us know. We're happy to build on this foundation with more insights.
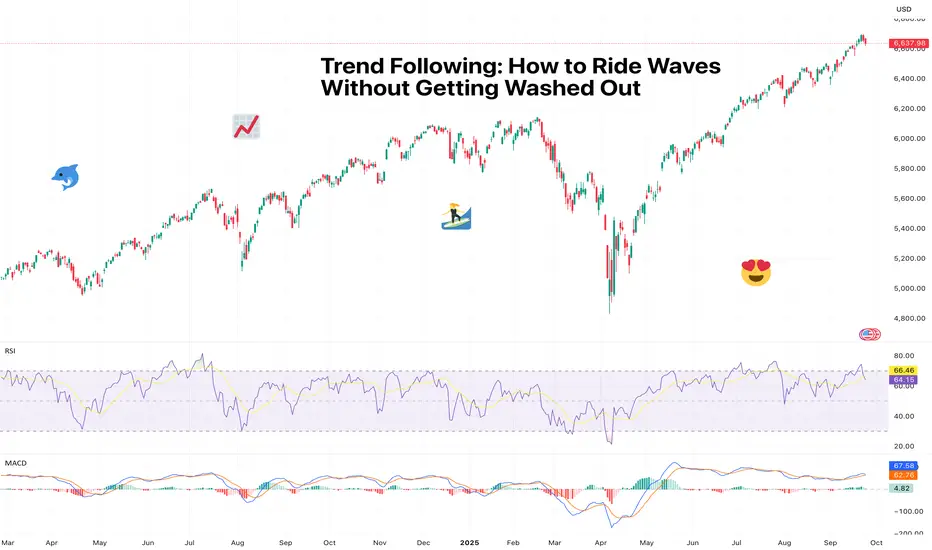
Trend Following: How to Ride Waves Without Getting Washed OutMarkets move in waves. Easy, right? But if you’ve tried catching one only to find out you get washed out, you’ve realized it ain’t’ that easy.
Sometimes there are gentle ripples that lull traders into boredom, other times they’re tsunamis that wipe out everything in sight.
The trick isn’t predicting when the next big set will hit – it’s learning how to catch it without falling off your board from the get-go. That’s where trend following comes in. Simple, structured, and surprisingly effective, it’s a strategy that says: stop guessing, start riding.
🌊 Catching It, Not Fighting It
At its core, trend following is about spotting momentum and sticking with it. If prices are climbing, you’re a buyer. If they’re falling, you’re a seller. No need to argue with the market about “fair value.” The trend follower’s mantra is: Mr. Market is always right, I’m just here to hitch a ride.
Why does this work? Because markets are essentially a bunch of thinking participants who move in herds. They share the same fears, hopes, expectations, and goals.
Traders, funds, and algorithms pile into the same ideas, technical patterns, and price levels, pushing valuations higher or lower. Your job isn’t to outsmart the herd – it’s to ride with it until the stampede loses steam.
Or better yet, spot the opportunity before the herd. "I am the animal at the head of the pack. I either get eaten, or I get the good grass,” says David Tepper, hedge fund manager.
🤫 Why It’s Harder Than It Sounds
“Buy high, sell higher” feels wrong anywhere but in the market. Human brains are usually wired to hunt for bargains, not chase expensive things. But there’s something about a record high that pulls you in and makes you say “Take my money!”
Traders love to bet on success. So when they see that Bitcoin BITSTAMP:BTCUSD is at $117,000 , near a record, it’s easier to throw cash than when it’s crashing and burning at a 60% discount.
True, no trend stays intact after a huge drop. But sometimes it’s better to see confirmation that the trend is exhausted than to exit during a mild dip and risk missing out on the big move.
Trend following isn’t about catching every top or bottom. It’s about accepting that you’ll never time it perfectly, but if you stay disciplined and let the trend play out, you’ll capture at least some of the move.
But in trading everything’s possible – some prefer to catch tops and bottoms, and that’s completely fine as long as it works.
“For twelve years I have been missing the meat in the middle but I have made a lot of money at tops and bottoms,” says Paul Tudor Jones, another big name in the industry.
📈 Tools of the Trade
So how do you know a trend is worth following? Traders lean on a few classics:
• Moving averages : If the 50-day is above the 200-day, that’s your green light. Prices above both? Bullish trend intact. Prices dive below the 200-day? Cue that a bear market is here.
• Support and resistance : Connect the dots (literally) and see if the price is respecting an upward or downward slope.
• Breakouts : When the price pops above resistance or drops below support on big volume, that’s the market saying, “Watch this.”
• Reversals : For those that like to live on the edge, spotting reversals might be a good way to catch a move from start to finish.
The trick isn’t in the tool itself, but in sticking to the plan when the inevitable wiggles and pullbacks happen.
🚤 Don’t Mistake Chop for Trend
Not every chart with bars pointing up is a trend. Sometimes you’re just looking at chop – those sideways, back-and-forth price moves that exist to chew up stop-losses and ruin Fridays.
Trend followers learn to wait for confirmation. That could mean a clean breakout with volume, or a moving average crossover with conviction. Enter too early, and you may find yourself drowning in false signals.
A confirmation is oftentimes triggered by economic news and reports. So pay attention to big and small releases stacked in the Economic Calendar .
🛟 The Stop-Loss Lifeboat
Here’s a little secret of trend following: you’ll be wrong a lot. The method is built around small losses and (occasional) big wins. That’s why stop-losses are essential . You’re not trying to win every trade, you’re trying to catch the few monster trends that more than pay for the slip-ups.
Think of it like surfing: you’ll get wiped out plenty of times, but you only need one clean wave to make the day worthwhile.
📊 The Math Behind the Swings
Why does this work over time? Because of asymmetric returns. If you risk $1 to make $3, you only need to be right 30% of the time to profit. Trend followers build systems where the losers are cut quickly, but the winners are allowed to run. That’s where the proper risk-reward ratio comes in.
Most traders do the opposite. They cut winners too early (“I’ll take my quick profit!”) and let losers drag on (“It’ll bounce, right?”).
🧩 Famous Trend Followers
This isn’t just theory. The Turtle Traders in the 1980s—an experiment by Richard Dennis and William Eckhardt—proved that complete novices could learn a rules-based trend following system and make millions. Fast forward, and big CTAs (Commodity Trading Advisors) still run billions using similar strategies today.
They all share one principle: don’t predict, only follow.
⏳ Patience Pays
The hardest part isn’t identifying trends. It’s sticking with them. Every pullback will tempt you to bail. Every analyst estimate, every scary headline, even your cousin at Thanksgiving telling you “Ether’s going to zero” will test your patience.
But trends don’t end because you got nervous. They end when the move breaks. Patience is what separates the trend followers who catch the big wave from the ones stuck paddling.
🎯 Final Take: Ride It Out
Trend following may not make you look like Paul Tudor Jones calling tops and bottoms. But it will keep you aligned with where the money is flowing. And when you’re on the right side of a trend, the ride is smoother, the wins are bigger, and the stress is lower.
Off to you : When’s the last time you got a nice wave and surfed it out to completion? Share your experience in the comments!
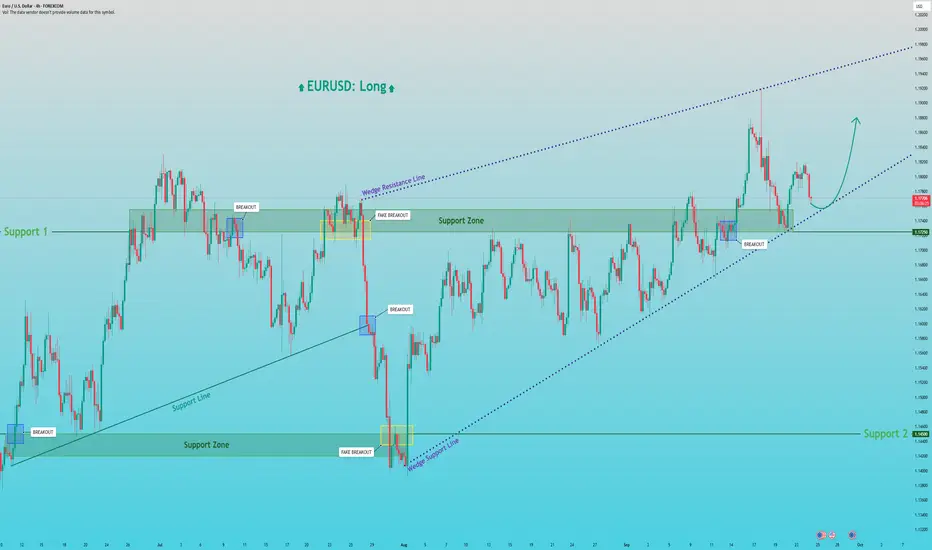
EURUSD: Rally from Wedge Support to 1.1880Hello everyone, here is my breakdown of the current Euro setup.
Market Analysis
A prior uptrend failed, leading to a sharp drop down to the major Support zone 2 around the 1.1450 level. However, strong buying pressure emerged from that low, initiating a powerful reversal and establishing the current market structure.
This new bullish phase has formed a well-defined Upward Wedge. The price successfully broke through Support 1 and tested the wedge's resistance. Currently, it's in a healthy corrective pullback and is testing the ascending support line of this wedge, which is a key area to watch.
My Scenario & Strategy
I'm looking for the price to complete its correction and find a solid floor on the ascending support line. A confirmed bounce from this dynamic support would be the key signal that the next impulsive move up is about to begin.
Therefore, the strategy is to watch for this bounce. A successful rebound would validate the long scenario. The primary target for the next wave higher is 1.1880, which would represent a new structural high within the Upward Wedge.
That's the setup I'm tracking. Thank you for your attention, and always manage your risk.
BTC Breakdown: Watching 112.6K-113.5K for Rejection Toward 109kHello guys!
Trend Structure:
The price was moving in a clear ascending channel, but recently broke down below the lower boundary with strong bearish momentum. This confirms a structural shift from bullish to bearish sentiment.
Current Price Action:
After the breakdown, BTC attempted a relief rally but is now struggling around the 112,682 – 113,581 resistance zone (marked in blue). This area was previously support inside the channel and is now acting as resistance (role reversal).
Scenarios (Entries):
Rejection at 112,682 zone:
If BTC fails to break above this resistance, sellers could step in and push the price lower. A clean rejection here would open the way toward 109,884 (next major support).
Deeper pullback to 113,581:
If bulls manage to push higher, the 113,581 level becomes the last line of resistance. A rejection here would be a high-probability short entry, also targeting 109,884.
Target Zone:
Both rejection scenarios point to 109,884 as the key downside target. A break below that level would increase bearish momentum toward 108,000 and possibly lower.

XAUUSD Long: Bullish Momentum to ContinueHello, traders! The price auction for XAUUSD has been in a strong bullish phase, confirmed by the establishment of a well-defined ascending channel. This uptrend was initiated after a breakout from lower levels and has shown significant strength by pushing through multiple prior resistance areas, including the 3470 DEMAND 2 and 3675 DEMAND levels, turning them into new support.
Currently, the price action is continuing its ascent within the upper portion of this ascending channel, indicating that the bullish initiative remains firmly in control. The market is in a clear expansion phase, with very little sign of significant selling pressure, suggesting that any pullbacks are likely to be minor and short-lived.
My scenario for the development of events is a direct continuation of the current bullish momentum. I believe that the price will only make a shallow correction from the current levels before the next impulsive wave higher begins. In my opinion, the underlying trend is strong enough to carry the price to a new high within the channel. The take-profit is therefore set at 3835 points, targeting the upper resistance line of the channel. Manage your risk.

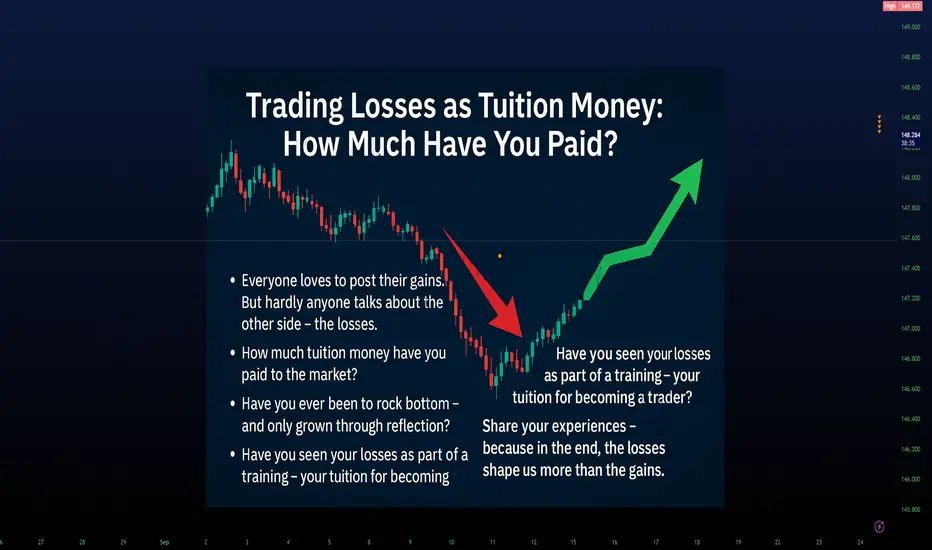
Losses = Tuition Money? How Much Have You Paid?Everyone loves to show their wins.
But the other side – losses – is rarely talked about. Yet they’re often the real teacher.
👉 The question few dare to ask:
How much tuition have you already paid to reach where you are today?
My Experience
For me, it was a very long road.
In my early years, I lost far more than I wanted to admit.
Many times I thought the markets were rigged – that a small trader couldn’t win.
But eventually, I realized:
➡️ It’s not the news that moves the chart – the chart makes the news.
➡️ If you observe long enough, you see patterns – and you realize you yourself are the biggest risk.
What helped me most
✅ Keeping a trading journal – radical honesty with myself.
✅ Questioning emotions – was it greed, fear, or lack of patience?
✅ Isolation with the craft – studying charts, testing setups, staying disciplined.
✅ Accepting that losses are part of the game – but learning how much each loss is worth before it becomes dangerous.
The Dark Side
Trading can become unhealthy.
Without a plan, it’s no different than gambling – chasing the next trade like poker or roulette.
👉 Sometimes the problem isn’t the loss itself, but the addiction to the next trade.
That’s why I had to make a clear choice:
Will I treat trading as a profession – with rules and structure – or just as a hobby?
Today it’s a profession for me. But only because of years of mistakes, testing, and tough self-reflection.
Questions for You
💬 How much tuition have you paid – and how do you deal with it?
💬 Have you ever hit rock bottom and grown only through reflection?
💬 Do you see losses as education costs – or as failures to be forgotten quickly?
💬 Are you now at a level where you trade profitably and consistently – or is trading still just a side hustle or passion?
💬 Most importantly: how did you change your mindset to improve?
💡 My View
In the end, losses shape us far more than wins.
Wins feel good – but losses build the mindset and character you need to survive long term.
👉 That’s why I believe we should share not just the shiny stuff – but the honest side too.
That’s what really helps us grow as a community.
Bear market has startedThe End of the Bull Cycle. Why I'm Selling Everything and Won't Buy Again Until September 2026.
For the last year and a half, I have said that we are in a bull market. I never once changed my opinion. But all things come to an end. The time has come.
September 13, 2025, the date I have been mentioning across my social media, was, in my opinion, the peak of this market cycle. As painful as it may sound, the bull market is over.
"Altseason" is a Scam. It's Time to Grow Up
Let's be honest. The "altseason" that everyone was dreaming of never happened. Yes, there were pumps on selective, mostly new coins. But the old guard, for the most part, showed nothing.
Therefore, I want to officially declare: I will never use the word "altseason" again. It's a meme from 2017. There are now over a million coins on the market. Liquidity is so diluted that pumping everything is impossible. Instead of "altseason," we have, and always will have, "selective pumps" driven by interested players. Our job is to learn how to find them, not to wait for a mythical wave that will lift all boats.
Why Now? The Classic Signs of a Top
I wouldn't be so certain if I didn't see the classic signs of euphoria that always appear at the top of a cycle:
- Universal Optimism: Governments are embracing crypto, creating reserve funds.
-Corporate Buying: Public companies are massively buying Bitcoin and Ethereum.
-Positive News: The media is filled with only positive news; no one wants to sell and is waiting for $200k, $300k, $500k.
When the crowd rushes into the market, smart money begins to exit. I prefer to be with the latter.
My Personal 2-Year Plan. Maximum Transparency
I'm not just saying the market will fall. I am publicly sharing my plan of action:
1. I am exiting the market into stablecoins NOW. I am locking in my profits.
2. I will NOT be buying the first correction. When Bitcoin drops to $90,000, most people will be buying, thinking it's a discount. I will not.
3. I plan to start actively buying again in September 2026.
Why so long? Because those who buy at the $90-100k mark risk sitting through two years of psychological and financial drawdown just to break even. I am not willing to pay that price. I won't disconnect from the market; I'll keep my finger on the pulse, but I don't plan on making any active buys.
Cycles Work. My Technical Rationale
My decision is not based on emotion but on cycle theory, which I have tested for years. The cycle consists of ~151 weeks of growth and ~51 weeks of decline. We have just completed the growth phase. The period between September 13 and October 6 is the exact reversal zone after which a decline should begin.
I could be wrong. No one can be right all the time. Perhaps the cycle theory will break this time. But I trust my system.
Conclusion: What's Next? The Long-Term View
I have not become a bear forever. I believe Bitcoin will hit $300,000. But not in the coming months. It will be worth that in 2.5 years, after a healthy 50-60% correction from the peak.
From this moment on, my bias is bearish. On strong upward bounces, I might even open short positions. A new game is beginning, with new rules. My job is to preserve my capital and multiply it in the next cycle. What about yours?
Why bear market started now Proofs:
Best regards EXCAVO

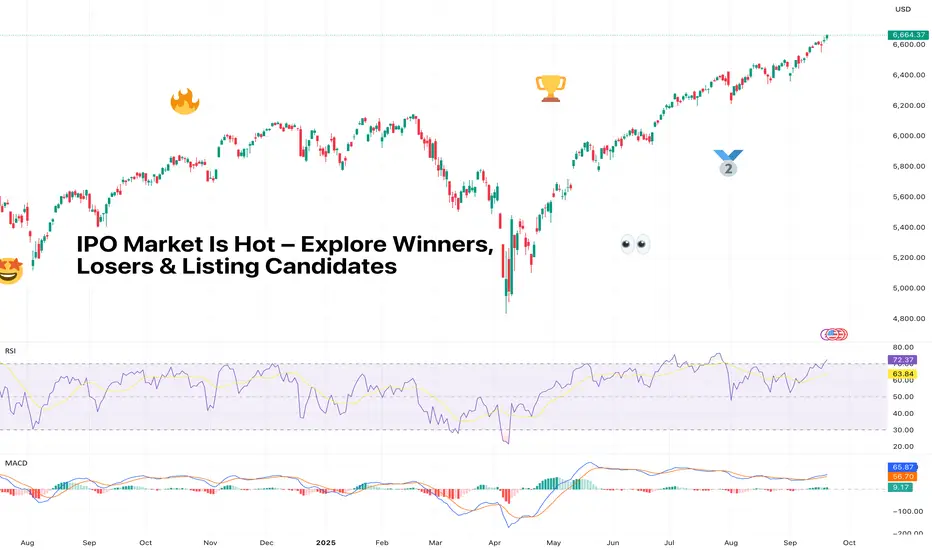
IPO Market Is Hot – Explore Winners, Losers & Listing CandidatesThe IPO market has woken up from its multi-year nap and is now in beast mode. But as always, Wall Street’s hottest party comes with an entrance fee and a dose of uncertainty – opaque prices, sketchy balance sheets, and a whole lot of FOMO.
So who’s winning, who’s losing, and who’s still waiting in the pipeline? Let’s find out.
🚀 The IPO Mania Returns
After years of drought, IPO mania is back in full swing. More than 150 companies have listed this year – up from 99 at this point in 2024 and just 76 in 2023, according to Renaissance Capital.
Together, they’ve raised nearly $30 billion, compared with $24 billion last year. First-day gains? Averaging 26%, the best since 2020. IPOs aren’t just back, they’re back with conviction.
Renaissance estimates we could see 40–60 more deals before the year is out. In other words, if you thought you missed the fun, the afterparty’s still ahead.
🤗 The Winners
Some debuts have been straight out of an IPO fantasy league.
Circle NYSE:CRCL , the stablecoin issuer, lit up the screens with a jaw-dropping 168% surge on its first trading day.
Firefly Aerospace NASDAQ:FLY , a rocket and lunar lander, blasted 30% higher on its IPO day, living up to its name.
Klarna NYSE:KLAR didn’t exactly moon, but a 15% pop for a lossmaking buy-now-pay-later firm isn’t shabby in this environment.
Then there’s Figure NASDAQ:FIGR , the blockchain-native mortgage lender. Since its listing in mid-September , it’s up 44% even after a midweek stumble. Investors love a fintech-meets-crypto mashup story – and Figure is playing it well.
Who said Figma NYSE:FIG ? The design software maker went vertical in its market debut , although reality has since slapped it down from those frothy day-one highs. Still, design nerds everywhere are proudly watching their favorite platform make its way up the rankings among the world's biggest software companies .
😭 The Losers
Not every IPO has the golden touch.
StubHub NYSE:STUB , the ticketing platform, came in hot with an 8% intraday pop above its $23.50 listing price, only to end its first session underwater at $22 . The days after? Even worse – the stock is floating near the $18 mark.
CoreWeave NASDAQ:CRWV , the AI up-and-comer, is a really interesting one. First off, it stumbled at the start after pricing its shares at $40 to float in March.
It traded under its IPO price for a while before clawing back with AI hype fueling the shares by 450% May through June. Then insider selling knocked the winds out of its sails in August.
Now it’s gravitating at triple its offering price, proving IPOs are a marathon, not a sprint.
🎲 The Pricing Game
The truth is, IPO pricing is as much science as it is art (and sometimes performance art). Investment banks like Goldman NYSE:GS , Morgan Stanley NYSE:MS , and Citi NYSE:C run the roadshows, build the books, and set the price. Oversubscribed IPOs often guarantee a strong open. Undersubscribed ones? Crickets.
Bears hate this one simple trick: most IPOs only float about 15–20% of the company. That tiny slice of tradable shares means volatility is baked into the flotation. Throw in a 180-day lockup (when insiders can’t sell), and early trading is a weird mix of price discovery and pure speculation.
💡 The Fundamentals Still Matter
The hype is real, but the numbers don’t lie. Valuations on some of these newly public firms are eye-watering. Circle trades at 130x earnings estimates, Figma at 184x. Compare that to Adobe’s 5x and you see how far the IPO froth can go.
Meanwhile, many of these firms aren’t consistently profitable. They post alternating quarters of red ink and black ink while investors cheer growth over everything.
🦄 Unicorn Watch: Who’s Next?
Here’s who’s buzzing on the IPO radar and what they’re worth in 2025:
• OpenAI, AI overlord, $500 billion
• SpaceX, rockets and satellites, $450 billion
• xAI / x.com, Elon Musk’s AI play, $200 billion
• Anthropic, OpenAI rival, $190 billion
• Databricks, data and AI analytics, $100 billion
• Stripe, payments giant, $92 billion
• Revolut, digital banking, $75 billion
• Canva, design platform (and your CV maker), $42 billion
• Fanatics, sports merch and betting, $30 billion
• Discord, chat for gamers (and everyone else), $15 billion
• Solera, software and data for auto and insurance, $10 billion
• Grayscale, crypto asset manager (part of Digital Currency Group), $10 billion
• AlphaSense, market intelligence, $4 billion
• Wealthfront, robo-advisor, $2 billion
• Quora, knowledge-sharing platform, $500 million
📉 The Risk of Chasing
So should you pile in? Here’s the trader’s dilemma: first-day pops are seductive, but inflated pricing means you’re often exit liquidity for early investors.
Waiting a few days, weeks, or even months for the froth to fade, lockups to expire, analyst coverage to roll in, and the hype to cool may be the smarter play.
🫶 Final Take
The current IPO season is hot, but so is the risk. But every IPO is different. Circle shows monster returns are possible, while StubHub proves not every ticker deserves a ticker-tape parade.
The winners? Companies with strong fundamentals (not just growth, but profits) and a story that Wall Street loves right now (AI, crypto, fintech).
The losers? Overpriced firms without consistent performance. The candidates? Mega-unicorns waiting for their grand entrance and some smaller players ready to make a splash.
As always, timing is everything. Here’s to hoping your favorite IPO won’t list right after a hawkish Jay Powell.
Off to you : What IPOs are on your radar for this year and the next? Share your thoughts in the comments!
INDV - Helping Trump Fight The Drug War In The US and Overseas.Thought this was a good example of the kind of stock I like to trade.
Not all of these have to be true to make it tradable. Just things I like to see.
Up over 100% over the last 12 months
Nice and steady price gains continuing to make higher highs
Had a good bump on earnings
Has had a recent pullback of 10-15% into a better value area as investors took some profits
Looks like it consolidated and established a support area
Analysts are bullish and think there is quite a bit of upside to its price
Starting to head back up
RSI and MACD both show a change in direction and buyer momentum coming back into the stock
Could be worth a watch.

Nvidia Returns to Yearly Highs on Temporary Boost in ConfidenceNvidia’s stock started the week with a gain of more than 4%, maintaining a steady bullish bias after it was announced that the company will invest over $100 billion in OpenAI to support the development of artificial intelligence infrastructure. As part of the agreement, Nvidia is expected to receive OpenAI shares as compensation. This move reflects both companies’ commitment to sustained growth in the AI industry and suggests that Nvidia views this project as a key step to strengthen its position beyond microchip production, seeking to consolidate itself as a strategic player in the sector over the long term. For now, market confidence has fueled buying pressure, and if further announcements are made, this trend could continue to dominate in the short term.
Short-Term Sideways Range at Risk
In recent weeks, Nvidia’s price had been moving within a sideways range, with a ceiling near $183 per share and a floor around $162. However, the latest bullish momentum is pushing the stock to test this resistance. If buying pressure holds, the range could break out and pave the way for a more relevant bullish bias in the coming sessions.
RSI
The RSI line remains above the neutral level of 50, showing that short-term bullish momentum has begun to dominate the average of the last 14 sessions. As long as this trend continues and the indicator does not enter overbought territory, buying pressure could become even more relevant in the short term.
MACD
The MACD histogram has started to show oscillations above the neutral 0 level, suggesting that the average strength of the moving averages has entered a steady bullish zone. If this signal persists, it could open the door to a stronger bullish bias in the short term.
Key Levels to Watch:
$183 – Yearly Resistance: Marks the yearly high and is the most important barrier in the short term. A sustained breakout above this level could drive the continuation of the broader bullish trend seen in recent weeks.
$173 – Nearby Barrier: Aligns with the zone marked by the Ichimoku cloud. Price action around this level could generate neutrality and extend the ongoing sideways formation.
$162 – Critical Support: Matches the 100-period moving average and the 23.6% Fibonacci retracement. A break below this support would activate a more relevant bearish bias, opening the door to a short-term downtrend.
Written by Julian Pineda, CFA – Market Analyst

Supreme Court ruling could lift gold further Gold has climbed $410 over the past four weeks, reaching ~$3,750 today after an additional ~$60 gain.
The combination of political risk, questions over central bank independence, and robust technical momentum has positioned gold as one of the best performing assets.
The Supreme Court has apparently scheduled arguments for December on the issue of whether President Trump can fire Fed governor Lisa Cook, and install another stooge like Stephen Mirin in her place. Such a precedent could further boost safe-haven demand for gold, as it could pave the way for the dismissal of other governors.
Support levels: Initial support sits at $3,660, followed by the breakout region around $3,515. As long as these levels hold, the broader bullish structure remains intact.
Momentum: Recent candles show strong buying pressure with limited pullbacks, indicating that buyers remain firmly in control.

NZDUSD to find buyers at previous swing low?NZDUSD - 24h expiry
The selloff is close to an exhaustion count on the intraday chart.
We expect a reversal in this move.
Risk/Reward would be poor to call a buy from current levels.
A move through 0.5875 will confirm the bullish momentum.
The measured move target is 0.5900.
We look to Buy at 0.5840 (stop at 0.5820)
Our profit targets will be 0.5895 and 0.5900
Resistance: 0.5875 / 0.5895 / 0.6000
Support: 0.5850 / 0.5840 / 0.5825
Risk Disclaimer
The trade ideas beyond this page are for informational purposes only and do not constitute investment advice or a solicitation to trade. This information is provided by Signal Centre, a third-party unaffiliated with OANDA, and is intended for general circulation only. OANDA does not guarantee the accuracy of this information and assumes no responsibilities for the information provided by the third party. The information does not take into account the specific investment objectives, financial situation, or particular needs of any particular person. You should take into account your specific investment objectives, financial situation, and particular needs before making a commitment to trade, including seeking, under a separate engagement, as you deem fit.
You accept that you assume all risks in independently viewing the contents and selecting a chosen strategy.
Where the research is distributed in Singapore to a person who is not an Accredited Investor, Expert Investor or an Institutional Investor, Oanda Asia Pacific Pte Ltd (“OAP“) accepts legal responsibility for the contents of the report to such persons only to the extent required by law. Singapore customers should contact OAP at 6579 8289 for matters arising from, or in connection with, the information/research distributed.

Trading is Hard: Lessons From the Market's BrutalityTrading is Hard: Lessons From the Market's Brutality
Woke up today to news that reminds us just how unforgiving this game is:
“In the past 24 hours, over 404,000 traders were liquidated, with total liquidations reaching $1.7 billion. The largest single liquidation order was a $12.74 million COINBASE:BTCUSD swap on OKX:BTCUSD OKX.” - The Block
That's the reality. And if anyone ever tells you trading is easy, be wary of such people.
This post isn't meant to scare you away from trading. It's meant to show you the harsh truth of what you're signing up for. Better to see it clearly now than learn it expensively later.
🔻 The Brutality of Trading
Trading is hard. Brutal. Merciless.
The market doesn’t care how smart, strong, or experienced you are. It will humble you, strip you, and leave you helpless if you let it.
The “perfect” strategy - if it exists at all - is not enough.
Risk management cannot be overemphasized.
Emotions creep in, no matter how disciplined you think you are.
And even when you’re standing tall, one wrong step can knock you flat.
🎭 The Illusion of Perfection
Even seasoned professionals with years of experience still get crushed. I call it the trading pandemic : when a chain of events clouds judgment, breaks confidence, and brings down even the best.
The truth is: there’s no perfection in trading.
Stay long enough, and the market will test you - again and again.
It reveals more about you than about the trade itself:
Your patience
Your greed
Your fear
Your discipline when everything is falling apart
👥 Walk With the Pack, Think Solo
Communities and mentors are valuable, but use them as mirrors for blind spots, not crutches for decisions. They are human. They are imperfect. And they, too, make mistakes.
✅ Smart engagement looks like:
Sharing your analysis and letting it get torn apart before risking real money
Learning from others’ post-mortems, not copying their live trades
Listening to people who’ll call you out when you’re overleveraged or emotional
Stress-testing your risk management, not validating your bias
❌ Dangerous dependency looks like:
Jumping into trades because “everyone else is doing it”
Asking “what should I buy?” instead of “what’s wrong with my thesis?”
Copying position sizes without understanding their risk tolerance
Seeking comfort instead of seeking truth
📝 At the end of the day:
Only you know your risk profile
Only you know what you can afford to lose
Only you know the weight of your current life situation
So walk with the pack, but think solo. Listen, learn, but take ownership. Once you hit that button, responsibility is yours alone.
Trading alone blinds you to perspectives that could save you. Trading by committee blinds you to your own judgment.
The balance? Use others as radar, but you’re still flying the damn plane.
♾️ The Infinite Game
Trading is not a sprint.
It’s not about quick wins this week and liquidation the next.
This is an infinite game.
The real goal is survival, staying in the market long enough to keep playing. That’s the edge. That’s what separates traders who last from those who burn out.
Accept your losses early.
Cut them when you must.
See them as tuition fees in the school of trading.
The market doesn’t care about your degree, your confidence, or your Discord signals. It humbles everyone equally. Every loss, every liquidation, every “I’ve figured it out” moment crushed, these aren’t just money lessons.
They’re the mirror. They show you who you are under pressure.
⚔️ Final Word
You don’t have to win every battle. You just have to stay alive in the war.
The survivors aren’t the ones who never fall. They’re the ones who get back up, learn what the pain taught them, and return smarter - not just harder.
Even in defeat, rise again. The market only truly beats the trader who quits.
Survival is victory. Rise, learn, and keep playing the infinite game.

Explaining the Lower Timeframe Function and Its Role in Trading Introduction
Candlesticks on higher timeframes summarize long periods of trading activity, but they hide the internal balance of buying and selling. A daily candle, for instance, may show only a strong close, while in reality buyers and sellers may have fought much more evenly. To uncover this hidden structure, Pine Script offers the requestUpAndDownVolume() function, which retrieves up-volume, down-volume, and delta from a chosen lower timeframe (LTF).
Function in Practice
By applying this function, traders can measure how much of a move was supported by genuine buying pressure and how much came from selling pressure. The function works across timeframes: when analyzing a daily chart, one can select a one-minute or one-second LTF to see how the volume was distributed within each daily bar . This approach reveals details that are invisible on the higher timeframe alone.
Helper for Data Coverage
Lower-timeframe data comes with strict limitations. A one-second chart may only cover a few hours of history, while a one-minute chart can stretch much further back. To make this limitation transparent, a helper was implemented in our code: it shows explicitly how far the available LTF data extends . Instead of assuming full coverage, the trader knows the exact portion of the higher bar that is represented.
//══════════════
// Volume — Lower TF Up/Down
//══════════════
int global_volume_period = input.int(20, minval=1, title="Global Volume Period", tooltip="Shared lookback for ALL volume calculations (e.g., averages/sums).", group=grpVolume)
bool use_custom_tf_input = input.bool(true, "Use custom lower timeframe", tooltip="Override the automatically chosen lower timeframe for volume calculations.", group=grpVolume)
string custom_tf_input = input.timeframe("1", "Lower timeframe", tooltip="Lower timeframe used for up/down volume calculations.", group=grpVolume)
import TradingView/ta/10 as tvta
resolve_lower_tf(bool useCustom, string customTF) =>
useCustom ? customTF :
timeframe.isseconds ? "1S" :
timeframe.isintraday ? "1" :
timeframe.isdaily ? "5" : "60"
get_up_down_volume(string lowerTf) =>
= tvta.requestUpAndDownVolume(lowerTf)
var float upVolume = na
var float downVolume = na
var float deltaVolume = na
string lower_tf = resolve_lower_tf(use_custom_tf_input, custom_tf_input)
= get_up_down_volume(lower_tf)
upVolume := u_tmp
downVolume := d_tmp
deltaVolume := dl_tmp
//──── LTF coverage counter — counts chart bars with valid Up/Down (non-na) 〔Hazel-lite〕
var int ltf_total_bars = 0
var int last_valid_bar_index = na // new: remember the bar_index of the last valid LTF bar
if not na(deltaVolume)
ltf_total_bars += 1
last_valid_bar_index := bar_index
int ltf_safe_window = ltf_total_bars
var label ltf_cov_label = na // label handle for the “coverage” marker
Use in Strategy Development
Because both the main function and the helper for data coverage have been implemented in our work, we use the Hazel-nut BB Volume strategy here as a practical example to illustrate the subject. This strategy serves only as a framework to show how lower-timeframe volume analysis affects higher-timeframe charts. In the following sections, several charts will be presented and briefly explained to demonstrate these effects in practice.
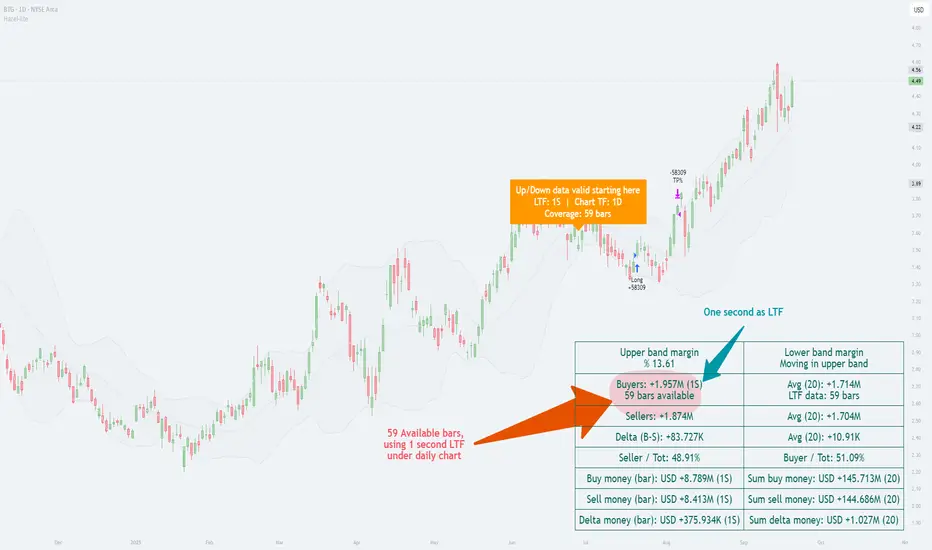
In this example, the daily chart is used as the main timeframe, while a one-second lower timeframe (LTF) has been applied to examine the internal volume distribution. The helper clearly indicates that only 59 one-second bars are available for this daily candle. This is critical, because it shows the analysis is based on a partial window of intraday data rather than a full day.
The up/down volume split reveals that buyers accounted for about 1.957 million units versus sellers with 1.874 million, producing a positive delta of roughly +83,727. In percentage terms, buyers held a slight edge (≈51%), while sellers were close behind (≈49%). This near balance demonstrates how the daily candle’s bullish appearance was built on only a modest dominance by buyers.
By presenting both the margin values (e.g., upper band margin 13.61%) and the absolute money flow, the chart connects higher-timeframe Bollinger Band context with the micro-timeframe order flow. The annotation “Up/Down data valid starting here” reinforces the importance of the helper: it alerts the user that valid LTF volume coverage begins from a specific point, preventing misinterpretation of missing data.
In short, this chart illustrates how choosing a very fine LTF (1 second) can reveal subtle buyer–seller dynamics, while at the same time highlighting the limitation of short data availability. It is a practical case of the principle described earlier—lower-timeframe insight enriches higher-timeframe context, but only within the boundary of available bars.
Analysis with One-Minute LTF
In this chart, the daily timeframe remains the base, but the lower timeframe (LTF) has been shifted to one minute. The helper indicates that data coverage extends across 353 daily bars, a much deeper historical window than in the one-second example. This means we can evaluate buyer/seller balance over nearly a full year of daily candles rather than just a short slice of history.
The up/down split shows buyers at ≈2.019M and sellers at ≈1.812M, producing a positive delta of +206,223. Here, buyers hold about 52.7%, compared to sellers at 47.3%. This stronger bias toward buyers contrasts with the previous chart, where the one-second LTF produced only a slim delta of +83,727 and ratios closer to 51%/49%.
Comparison with the One-Second LTF Chart
Data coverage: 1s gave 59 daily bars of usable history; 1m extends that to 353 bars.
Delta magnitude: 1s produced a modest delta (+83k), reflecting very fine-grained noise; 1m smooths those micro-fluctuations into a larger, clearer delta (+206k).
Interpretation: The 1s chart highlighted short-term balance, almost evenly split. The 1m chart, backed by longer history, paints a more decisive picture of buyer strength.
Key Takeaway
This comparison underscores the trade-off: the lower the LTF, the higher the detail but the shorter the history; the higher the LTF, the broader the historical coverage but at the cost of microscopic precision. The helper function bridges this gap by making the coverage explicit, ensuring traders know exactly what their analysis is built on.
Impact of TradingView Plan Levels
Another factor shaping the use of this function is the user’s access to data. TradingView accounts differ in how much intraday history they provide and which intervals are unlocked.
◉ On the free plan, the smallest available interval is one minute, with a few months of intraday history.
◉ Paid plans unlock second-based charts, but even then, history is measured in hours or days, not months.
◉ Higher tiers extend the number of bars that can be loaded per chart, which becomes relevant when pulling large volumes of lower-timeframe data into higher-timeframe studies
Conclusion
With requestUpAndDownVolume(), it becomes possible to see how each symbol behaves internally across different timeframes. The helper function makes clear where the data stops, preventing misinterpretation. By applying this setup within strategies like Hazel-nut BB Volume, one can demonstrate how changing the lower timeframe directly alters the picture seen on higher charts. In this way, the function is not just a technical option but a bridge between detail and context.
ANFIBO | BTCUSD Analysis – Weekly Trading PlanHi guys! It's me, Anfibo. My plan last week gave us a good profit selling from 118,000 USD to 115,000 USD.
And over the past weekend, BITSTAMP:BTCUSD consolidated in a sideways range, consistently holding above key support. However, with the opening of the new week’s Daily candle, the market decisively broke down through this support zone, signaling that selling pressure is now taking clearer control.
From a technical perspective, the next critical support levels to monitor are:
• $113,000
• $111,000
• $109,500
Around the $110,000 region, I view this as a pivotal area to consider initiating spot entries or building larger long-term positions. This zone is not only a technically strong support level but also carries significant psychological weight for institutional and large-scale flows.
Imo, in the short term, BTC may still attempt a retest of the $115,000 level before resuming its downward trend, depending on lower-timeframe reactions. This creates an opportunity for traders to capitalize on corrective moves.
>>> My Trading Plan for the Week:
(1) SELL SCALP:
– ENTRY: around 115,000
– SL: 117,000
– TP1: 113,000
– TP2: 110,000
(2) BUY SETUP:
- ENTRY: 109,000 - 111,000
- SL: 107,000
- TP1: 117,500
- TP2: 122,000
- TP3: 128,000
This strategy is designed for short-term trades, taking advantage of volatility within the current range. For long-term investors, patience will be key—waiting for BTC to approach $110,000 or lower provides a strategic opportunity to restructure portfolios and scale into positions at more favorable prices.
👉 Conclusion: BITSTAMP:BTCUSD has broken out of its weekend consolidation and is now entering a fresh leg down. Short-term traders should look to sell corrective bounces, while long-term investors should focus on accumulation opportunities near $110,000 - a level that could serve as a “strategic entry” for the upcoming cycle.
WISH EVERYONE A NEW WEEK FULL OF ENERGY! ;)

NIKE BREAKDOWN (NKE)...POTENTIAL LONG OPPORTUNITYHey hey Tradingview family!!! Joseph here AKA JosePips! Just wanted to come on this week and do a breakdown on the company Nike & what I see technically potentially happening next on this stock! In this video you will get a in depth breakdown of
1. Overall price action structure/context
2. Momentum & understanding how momentum can be used in your trading
3. Supply & Demand principles
4. Technical confluence & how to really use indicators to build your edge in trading
So I hope you guys enjoy this video and breakdown!! Boost this post & follow my page for more content!
Cheers!

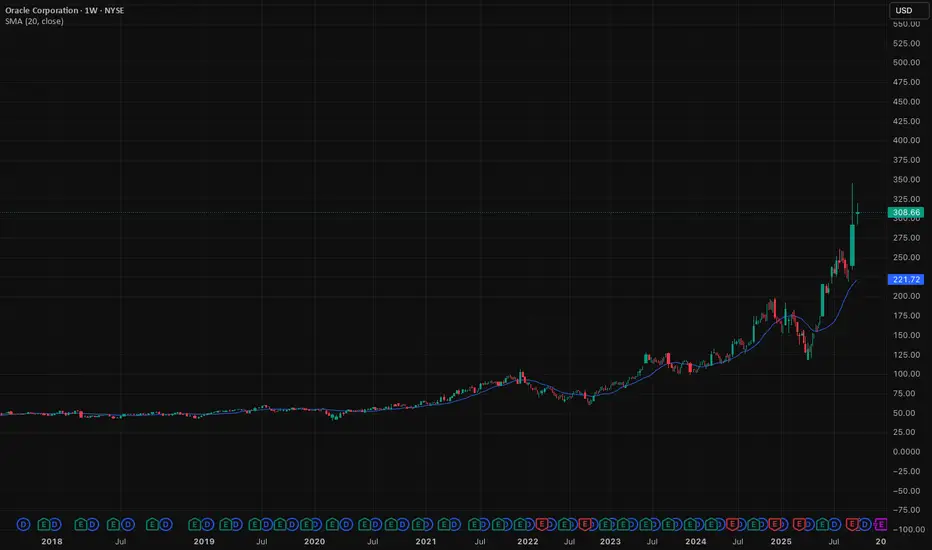
Oracle's surge is a bull market warningOracle has become the latest torch bearer of this market’s fever. A sharp, double-digit jump in days. Not because of numbers on a balance sheet, but because of mood. Sentiment is running wild, and traders are piling in.
These are the signs of caution experienced traders take during bull markets.
This market doesn’t need fundamentals. It needs stories. Oracle provided one, AI, cloud infrastructure, and firming whispers of a TikTok tie-up. That’s all it takes in a market already priced for perfection. The hotter the tape, the more dramatic the reactions.
The narrative is seductive. Media and enterprise tech converging. Old-guard software reborn as a cloud giant. These are big, glossy ideas. But when valuations are stretched, stories become more dangerous than compelling.
We’ve seen this play out before. In hot markets, price runs ahead of reality. Crowds cheer the breakout, analysts upgrade, and traders convince themselves this time is different. Then something shifts. Sentiment cracks. The same names that soared, collapse first.
Oracle is not the problem. It’s the signal. A sign that markets are running on fumes of optimism. The Nasdaq is back to trading at extreme multiples. Liquidity is abundant, and money is chasing flash. When that music stops, the hangover will be sharp.
Caution is the trade here. Oracle’s rally is not a testament to strength. It’s evidence of a market too eager to believe its own stories.
The forecasts provided herein are intended for informational purposes only and should not be construed as guarantees of future performance. This is an example only to enhance a consumer's understanding of the strategy being described above and is not to be taken as Blueberry Markets providing personal advice.
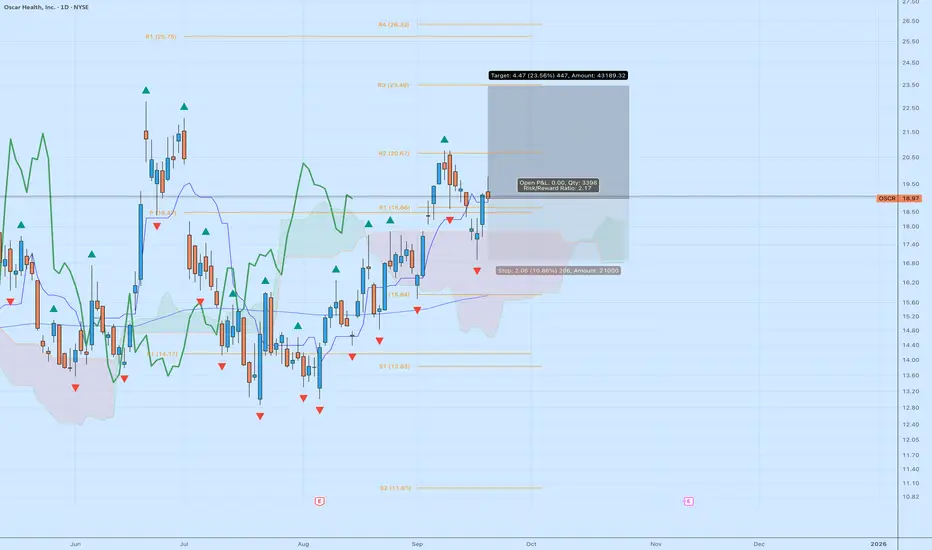
Oscar Health (OSCR) – Risk/Reward Setup Worth WatchingI’m tracking a long setup on NYSE:OSCR after a strong recovery trend that has been quietly building since the summer. It’s carving out a technical structure that offers a clean risk/reward.
Company Context
Oscar Health is a tech-driven health insurance company that’s been rebuilding its story in 2024–2025. With a focus on digital-first healthcare plans and partnerships, it’s been reducing losses and narrowing its path toward profitability. Investors are beginning to treat it less like a speculative health-tech play and more like a managed care turnaround. That shift alone can fuel momentum as institutions re-rate the name.
Technical Breakdown
Entry Zone: Around $18.90, just above the daily pivot (P: $18.51) and prior breakout support at $18.66.
Ichimoku Cloud: Price is holding above the cloud, with the leading span showing a bullish tilt. This suggests trend support into October if buyers defend current levels.
Moving Averages: OSCR is trading above its 50-day average and bouncing off the short-term Kijun line — a healthy pullback/retest dynamic.
R Levels: Resistance to watch sits at R2 ($20.67) and R3 ($23.49). Targeting these aligns with a potential 23% upside move.
Stop Placement: My risk is anchored near $16.80–$17.00 (just below R1/Pivot cluster and cloud support). That’s roughly -11%.
Reward: Upside target $23.49–$24.00 gives ~+23%. That’s a 2.1:1 reward-to-risk profile.
Why It’s Interesting
OSCR has been building higher lows since May, which is constructive in a volatile market.
The current consolidation looks like a platform for continuation, especially if it can break and hold above $20.
Liquidity is decent for a mid-cap, and options flow has been showing unusual activity recently (call side).
Risks to Monitor
As an insurance stock, OSCR is tied to regulatory headlines and policy changes.
Earnings volatility can be sharp — a stop discipline is key here.
Broader market sentiment could swamp this setup if risk-off flows dominate.
My Take:
This isn’t a “bet the farm” play, but OSCR gives traders a very tradable setup: clear support, well-defined stop, and room to run into the low $20s. As long as it holds above the cloud and the $18 pivot zone, I like the long bias.
MARKET PROFILE🔸🔸🔸 1 - Back to the Roots: Learn the Theory, Improve Signal 🔸🔸🔸
Becoming a successful trader starts with building a strong foundation of knowledge. This foundation comes from time spent in the markets and real experience. While the basic idea is easy to understand, actually building this solid base takes effort and patience.
Trading experience, careful observation, focusing on what truly matters, and understanding basic technical principles are all key parts of this foundation. Patience and awareness also play a big role in making it stronger.
Without this foundation, it’s difficult to trade well over the long term. But when you have it, you can think more clearly, make better decisions, and trust your own judgment.
In today’s fast-paced markets, some traders try to skip this step, only to realize later how important it really is. The good news is, it’s never too late to start building this foundation—you just need to dedicate the time and be ready to put in the work.
If you grasp the lessons from these experiences, you’ll see that they apply directly to your own journey as a trader. Along the way, you might also discover fresh insights about how markets really work today.
🔸🔸🔸 2 - Peter Steidlmayer 🔸🔸🔸
Peter Steidlmayer is the creator of Market Profile, a powerful tool that traders today often use through Market Profile analysis. What makes his idea special is that it didn’t come only from books or classrooms — it was shaped by his life experiences growing up on a ranch in California.
From an early age, Peter learned important lessons about value and fairness from his father. On their family ranch, his father would only sell crops when the price was fair, aiming for a reasonable profit instead of chasing big gains. If prices were too low, he’d hold on to the grain rather than selling at a loss. When buying, whether groceries or used farm equipment, his father was careful not to overpay, always seeking a fair deal. This taught Peter that value is not just a price number — it’s a relationship between price, time, and need. Paying too much means time works against you; paying less means time is on your side.
Later in college, Peter took a statistics course where he learned about the bell curve—a way to find patterns in what might look like random data. This gave him the idea that market prices also have a “fair value” area, where most trading happens, and areas away from this center that create opportunities.
He combined this with the ideas of value investing from Graham and Dodd and the concept of the “minimum trend” by John Schultz, which measures the smallest meaningful price movements. By grouping these price movements, Peter saw that prices tend to cluster around a fair value zone, forming a bell curve shape. This became the foundation for Market Profile and later, Volume Profile.
🔸🔸🔸 3 - Market Profile 🔸🔸🔸
Before we dive into Market Profile, it’s important to understand Peter Steidlmayer’s journey and how he developed Market Profile.
Through his research and testing different systems, Peter noticed that although some methods worked at first, none gave consistent or reliable results over time. The most important insight he gained was that all these approaches tried to predict future market prices — something he came to believe is impossible.
Instead of guessing where prices might go, Peter focused on finding value , which he called fair value . The goal of Market Profile is not to provide buy or sell signals but to help traders find where the true value lies.
Market Profile is a tool, not a trading system. To use it effectively, you need to understand its core principles, not just memorize fixed rules. Unlike simple buy/sell systems that stop working when market conditions change, Market Profile helps you see those changes as they happen and adapt your strategy accordingly.
Remember, market decisions always require your own judgment. Market Profile cannot predict the future — no tool can — but it helps you understand what is happening right now, so you can make better trading decisions.
Before we move on to interpreting Market Profile, we will first look at three key steps that will help build a clear foundation
Market Profile Graph: How the profile is drawn and what it represents
Market Profile on TradingView: How you can access and use this tool on TradingView
Anatomy of a Market Profile: Explanation of the key components
Once we cover these basics, we’ll be ready to focus on interpreting Market Profile and applying it in trading decisions.
📌 3.1 - Market Profile Graph
If you understand the basic principles behind Market Profile, you will be able to recognize key patterns easily, without getting confused by changes in how they are displayed.
To make this clear, I will draw the Market Profile for the trading session between 9:00 and 15:00. This will help you see how time and price interact at different levels during that trading session.
3.1.1 - Understanding the Letters in a Market Profile Chart
In a Market Profile chart, each letter represents a 30-minute time period during the trading day. The sequence starts with the letter A for the first half-hour (9:00–9:30), then B for the next half-hour (9:30–10:00), and continues alphabetically until the market closes.
This way, the chart shows not only which prices were traded but also exactly when they were active during the day.
3.1.2 - A Period (9:00 – 9:30)
This price level is where we start placing the letter A to represent the first 30 minutes. The trading day opens at 2685, marked by an arrow on the left side of the profile. (Shape a).
Shortly after the open, the price rises to 2690 (Shape b), so we place the letter A at 2690. Then, the price falls to 2680 (Shape c), and we add the letter A down to that level as well.
Next, the price climbs again to 2690 before settling back to 2680 (Shape d), which becomes the final price of the first half-hour. We do not add another A where one already exists.
The closing price of this period, 2680, is marked with an arrow on the right side of the profile.
(Note: Price Movement Shape in the chart is drawn to illustrate how the price moved within this 30-minute period.)
3.1.3 - B Period (9:30 – 10:00)
The second half-hour opens at 2680, so we place the letter B—which represents this time period—at that price level. Since the first column already has the letter A, we place this B in the second column (Shape a).
Then, the price drops to 2670, and we add the letter B down to this level, always filling the leftmost empty column. This period closes at 2675 (Shape b).
The price falls further to 2665, which is where the second half-hour ends. The final price of this period, 2665, is marked with an arrow on the right side of the profile (Shape c).
(Note: Price Movement Shape in the chart is drawn to illustrate how the price moved within this 30-minute period.)
3.1.4 - Completing the Market Profile for the Day (10:00-15:00)
As the day progresses, we continue placing the letters in this way. During the third half-hour (10:00–10:30), the decline continues. The market moves between 2665 and 2620, closing this period at 2640.
If we assume the drawing process is now understood from these examples, we can move to the end of the day. Throughout the session, prices move between 2695 and 2620, closing the day at 2670. At this point, we have the complete Market Profile for the day.
When we compare this type of chart with a candlestick chart, we see that both show the same basic information. However, the purpose here is not to track the exact price movement, but to see the value area created during the day.
By focusing on the value area, we can see how price and time interact.
The more time the price spends at a certain level, the more trading volume builds there. The higher the volume, the more the market sees that price as value.
Price + Time = Value
📌 3.2 - Market Profile on TradingView
Before we explore the key components of a Market Profile chart, it’s important to know how to display it on TradingView. There are two main ways to do this—either by changing the chart type to TPO or by adding it through the Indicators menu.
1. Enable TPO View from Chart Type Menu
Click on the Candles button at the top of your chart.
Select Time Price Opportunity (TPO) from the list of chart types.
2. Add Market Profile via Indicators
Click the Indicators button on the toolbar.
Go to the Technicals section and scroll to Profiles.
Choose Time Price Opportunity or Session Time Price Opportunity depending on whether you want the profile for the whole chart or for individual sessions.
📌 3.3 - Anatomy of a Market Profile
Let’s first explore the main components of a Market Profile chart—TPOs, Initial Balance, Extremes, Range Extensions, Fair Value, Unfair High, Unfair Low, and Value Areas. In this section, we’ll not only define each of them but also show how they appear on the chart for better understanding.
Key Components of a Market Profile Chart
Visualizing Components on a TradingView TPO Chart
3.3.1 - Key Components of a Market Profile Chart
Detailed explanations of each element that forms the structure of a Market Profile.
TPOs (Time Price Opportunities)
Each letter on the Market Profile chart is called a TPO (Time Price Opportunity). A TPO represents a specific price traded during a specific time period, showing both when and at what level the market was active. The sequence begins with capital letters (A, B, C, …), and once these are used up, it continues with lowercase letters (a, b, c, …) to represent later time periods.
Initial Balance
The Initial Balance marks the price range established during the first two letter time periods, usually represented by the letters A and B. It shows where the market first found a trading range and is often indicated on the left side of the profile with a vertical line.
Note:
If the letter time period is set to 15 minutes, each letter represents 15 minutes of trading, so the Initial Balance covers only the first 30 minutes in Tradingview.
In TradingView, you can use the Initial Balance (IB) range feature to define the key price range at the start of the session. By default, it covers 2 letters (A and B), but if you prefer, you can adjust the range to 3, 4, 5, or more bars to suit your analysis.
Extremes
An extreme is the activity that occurs at the very top or bottom of a price range, represented by two or more single TPO prints standing alone. It forms when the market tests a price level, then quickly rejects it and moves away, showing that the opposite side (buyers or sellers) stepped in with strength.
Extremes appear when the market rejects prices at the top or bottom of the range, leaving behind either a buying tail(single prints at the bottom) or a selling tail (single prints at the top). Visually, the value area forms the main “body” of the profile, while extremes extend outward like “tails.”
Note:
An extreme cannot occur in the last time period of the day, since there is no following trade to confirm rejection.
Range Extension
A range extension happens when the price moves beyond the initial balance (A and B TPOs). This expansion happens because longer-term traders step in with enough volume to push prices higher or lower. An upside extension signals active buyers, while a downside extension signals active sellers. Range extensions help reveal the influence of longer-term participants and provide important context about the market’s directional bias.
Fair Value
In a Market Profile chart, the price level with the highest number of letters (TPOs) is called the fair value. This level often corresponds to the price with the highest traded volume. If the profile shows more than one fair value level, the one closest to the midpoint of the day’s trading range is selected.
Unfair High
The highest price level of a distribution where trading activity is low. It represents an “unfair” or advantageous selling area because prices moved too high for buyers to remain interested. This level often marks the top of the range.
Unfair Low
The lowest price level of a distribution where trading activity is low. It represents an “unfair” or advantageous buying area because prices moved too low for sellers to remain interested. This level often marks the bottom of the range.
Value Area
The price range where most trading activity occurs, usually about 70% of TPOs. It shows where the market accepts price as fair, with buyers and sellers actively rotating around this level. Prices above the value area are advantageous for the longer-term seller; prices below it are advantageous for the longer-term buyer. The calculation process is:
Start with the price level that has the highest volume.
If this alone doesn’t reach 70%, compare the total volume of the one price levels above with the one price levels below.
Add the larger of the one to your total.
Repeat this process until you reach about 70% of the day’s total volume.
3.3.2 - Visualizing Components on a TradingView TPO Chart
Demonstration of how these components look directly on TradingView using the TPO chart.
With the Expand Block feature, the Market Profile is shown as separate columns, where each letter is placed in its own block. This helps you clearly see which price levels were active in each 30-minute.
Shifting the letters into the empty left column serves a special purpose. Instead of focusing on the exact price movements, this view highlights the value area created during the session. It allows traders to see where the market spent the most time and built the strongest acceptance, rather than just tracking short-term fluctuations.
🔸🔸🔸 4 - Principles of Market Profile 🔸🔸🔸
Now that we have learned how to draw the profile and the key terms used, we can move on to how to read a Market Profile chart.
Market Profile is not a ready-made trading system—it is a tool designed to support your decision-making. To use it well, you need to understand the principles behind how it works. No matter how advanced a tool is, your trading decisions will always require your own judgment—Market Profile can’t replace that.
It also cannot predict the future—but then again, no one can. What it does do is give you a clear picture of the current market situation. By understanding what’s happening right now, you put yourself in a stronger position to make better, more informed decisions.
📌 4.1 - The Auction Framework
The Auction Framework explains how the market works like an auction, helping people buy and sell. When prices go up, more buyers are attracted, willing to pay higher prices. When prices go down, more sellers enter, ready to sell at lower prices.
The market moves like an auction in two main ways: first, it pushes prices higher until there are no more buyers willing to pay more. Then, it reverses and moves down until there are no more sellers willing to sell at lower prices.
In this way, the market constantly moves up and down, balancing buyers and sellers. When the upward movement ends, the downward movement begins, and this cycle keeps repeating.
Looking a bit closer, the market moves in one direction and “asks” the other side (buyers or sellers) to respond. When the opposite side responds enough to stop the current move, the market changes direction.
In short, the market is like a continuous auction, where prices rise and fall as buyers and sellers compete—until one side runs out of interest.
📌 4.2 - Negotiating Process
When the market moves in one direction, it creates boundaries for the price range. These boundaries are called the unfair low at the bottom and the unfair high at the top. They represent price levels where the market has gone too far — these are called excesses .
Once these limits are established, the market starts trading inside this range. It moves between the unfair low and unfair high to find a fair price , which we call value . In other words, the market negotiates within this range to settle on value.
If you pause the market at any moment, you will notice three important points:
Unfair low (the lowest excess)
Unfair high (the highest excess)
Value (somewhere in the middle)
These three points show how buyers and sellers negotiate prices in the market.
📌 4.3 - Time Frame
Markets are always shaped by two different forces: short-term traders and long-term traders. Both are active at the same time, but their goals are very different.
Short-term traders are focused on “fair price” for the day. When the market opens, price moves up and down as these traders search for a balance point where both buyers and sellers agree. If the open is inside the previous day’s range, short-term activity usually dominates. They don’t wait for the perfect deal—they just need a reasonable price to complete their trades quickly, like a business traveler who buys a ticket at the going rate without shopping around.
Long-term traders , on the other hand, are more strategic. They are not in a hurry to trade today. They wait for an advantageous price—something too high or too low compared to value. When they step in with enough volume, they can break the balance and extend the market range. This is how trends begin. You can think of them as a vacation traveler who has time to wait for the best discount fare.
Because long-term buyers see value at low prices and long-term sellers see value at high prices, they rarely meet in the middle. Instead, the market swings: rising to create opportunity for sellers, falling to create opportunity for buyers.
The result is a constant cycle: balance, imbalance, and back to balance. Day-to-day order flow is shaped by short-term traders, but big moves and directional trends come from long-term players. At the extremes—whether too high or too low—it’s always the long-term traders who take control.
📌 4.4 - Balance and Imbalanced
The market helps people buy and sell by moving repeatedly between states of imbalance and balance. This happens both within a single trading session and over longer-term trends.
When the market is balanced , buying and selling are roughly equal. This means the market has found an opposing force and is trading around a fair price where buyers and sellers agree.
When the market is imbalanced , either buying or selling dominates. The market moves up or down directionally, searching for the opposite reaction and a fair price to trade around.
In short:
A balanced market has found a fair price.
An imbalanced market is still looking for that fair price.
This is simply another way of stating the law of supply and demand: buyers want to buy, sellers want to sell, and the market is either in balance or trying to get there.
📌 4.5 - Day Timeframe Structure
The idea of day structure comes from how the market looks for a fair price where both buyers and sellers are willing to trade. If a price is unfair, trading will stop there, and the market will move until balance is found.
The first hour of trading sets the initial balance . This range is like the “base” of the day. A wide base is more stable, while a narrow base is weak and often leads to bigger moves later in the day. Just like the base of a lamp keeps it standing, a wide initial balance provides stability, while a narrow initial balance is easier to “knock over,” leading to bigger moves and range extensions.
When longer-term traders enter, they can break this balance. If they act small, the market moves only a little. If they act strong, the market can move far and leave signs, like tails on the profile. Tails show where longer-term traders rejected extreme prices.
By watching the initial balance and the activity of longer-term players, traders can recognize different day types . Each type gives clues about short-term trading opportunities and the market’s bigger direction.
The main balanced types are:
Normal Day
Neutral Day
The main imbalanced types are:
Normal Variation Day
Trend Day
4.5.1 - Normal Day
On a Normal Day , the market is in balance and longer-term traders have little influence. The Market Profile often looks like a classic bell curve , where most trading happens around a fair central price. At the extremes, prices are rejected—buyers stop above and sellers stop below—keeping the market balanced.
Key Characteristics:
The key sign of a Normal Day is the initial balance (first hour’s range), which usually makes up about 85% of the entire day’s range . In other words, the first hour often defines how the rest of the day will unfold.
If any range extension happens, it usually comes late in the session.
Dynamics:
In terms of volume, around 80% comes from short-term traders and only 20% from longer-term participants . Because long-term players are mostly inactive, the market doesn’t trend strongly and instead stays contained within the initial balance area.
4.5.2 - Neutral Day
A Neutral Day occurs when both long-term buyers and sellers are active, but neither side gains control. Their efforts cancel each other out, so price extends beyond the initial balance in both directions , then returns to balance.
Key Characteristics:
Range extensions above and below the initial balance.
Close near the middle of the day’s range.
Initial balance is moderate in size —not as wide as a Normal Day, not as narrow as a Trend Day.
Often shows symmetry : the upside and downside extensions are about equal.
In terms of volume, around 70% comes from short-term traders and only 30% from longer-term participants .
Dynamics:
Uncertainty dominates. Long-term traders test prices higher and lower, but without strong follow-through, their activity neutralizes. Short-term traders make up most of the volume, keeping the market contained. This indecision often leads to repeated neutral days , as neither side has enough conviction to drive a clear trend.
4.5.3 - Normal Variation Day
A Normal Variation Day happens when long-term traders play a more active role than on a Normal Day, usually making up 20–40% of the day’s activity.
Key Characteristics:
Their involvement leads to a clear day extension beyond the initial balance, often about twice the size of the first hour’s range.
The initial balance is not as wide as on a Normal Day, making it easier to break.
As the day develops, long-term traders enter with conviction and push price beyond the base (range extension).
Price may extend in one direction but eventually finds a new balance area.
Volume split: 60–80% short-term traders, 20–40% longer-term traders.
Dynamics:
Early trading looks balanced and controlled by short-term participants. Later, longer-term buyers or sellers step in more aggressively, causing the day’s range to expand. If the extension is small, their influence is limited.
4.5.4 - Trend Day
A Trend Day occurs when long-term traders dominate the market, pushing it strongly in one direction. Their influence creates maximum imbalance and range extension , often lasting from the open to the close.
Key Characteristics:
The close is usually near the day’s high or low (about 90–95% of the time).
Volume is split roughly 40% short-term traders and 60% long-term traders .
The profile shape is elongated and thin , unlike the balanced bell curve of a Normal Day.
Price moves in one-timeframe fashion : each period makes higher highs in an uptrend or lower lows in a downtrend, with little to no rotation.
Dynamics:
Trend Days often start with a narrow initial balance , quickly broken as long-term participants step in with strong conviction.
The move may be triggered by news, stop orders, or a strong shift in sentiment.
As the trend unfolds, new participants are drawn in, fueling continuous directional movement.
There are two types:
Standard Trend Day – one continuous directional move.
Double-Distribution Trend Day – an initial balance and pause, followed by a second strong directional push that creates a new distribution area.
📌 4.6 – Initiative and Responsive Activity
In Market Profile, it’s important to know whether longer-term traders are acting with initiative (pushing the market) or responding (reacting to prices that look too cheap or too expensive). You can figure this out by comparing the day’s action with the previous day’s value area.
Responsive Activity happens when traders behave in an expected way.
Buyers step in when prices drop below value (cheap).
Sellers step in when prices rise above value (expensive).
This behavior maintains balance and is typical in Normal or balanced days.
Example: price falls below yesterday’s value area → buyers enter → responsive buying.
Initiative Activity happens when traders behave in an unexpected way.
Buying takes place at or above value (where you’d normally expect selling).
Selling takes place at or below value (where you’d normally expect buying).
This shows strong conviction and usually drives imbalance or trend.
Example: price above yesterday’s value area continues to attract buyers → initiative buying.
Quick Rules (relative to the previous day’s value area):
Above value → Selling = responsive, Buying = initiative
Below value → Buying = responsive, Selling = initiative
Inside value → Both buying and selling are considered initiative , but weaker than outside activity.
Why it matters
Responsive action keeps the market balanced → often short-term focused.
Initiative action pushes the market to new areas of value → often starts trends.
In short, responsive moves are reactions to “fair or unfair” prices, while initiative moves show conviction to create new value levels.
🔸🔸🔸 5 - Strategy 🔸🔸🔸
Trading is never about finding a magic formula—it’s about reading the market and making decisions with context. Market Profile doesn’t give you fixed answers like “buy here, sell there.” Instead, it provides market-generated information that helps you recognize when conditions are shifting and when an opportunity has a higher probability of success.
Just like in teaching, if someone only looks for answers without understanding the reasoning, they miss the bigger lesson. In trading, the same is true: rules without context are dangerous. Market Profile teaches us how to think about the market, not just follow signals blindly.
That said, there are special situations in Market Profile where the structure itself points to a high-confidence setup. These are not guarantees, but they often create trades that “almost have to be taken,” provided the overall market context supports them.
Below are a few of the special strategies I’ll cover in detail. The goal is not to memorize fixed rules but to understand the logic behind them. By learning the reasoning, you’ll see why these setups matter and how to use them in practice with your Market Profile indicator.
3-1 Days
Neutral-Extreme Days
Spike
📌 5.1 - 3-1 Days
Among the special setups in Market Profile, the 3-1 Day is one of the most well-known. It signals a strong conviction from longer-term traders and often leads to reliable follow-through the next session.
Below is a practical, step-by-step guide you can follow when you spot a potential 3-1 Day. I give rules for identification, entry options (conservative → aggressive), stops, targets, trade management and failure signals. Keep it mechanical but always use judgement.
What is a 3-1 Day
A 3-1 Day occurs when three things line up in the same direction:
an initiative tail (single-print tail showing rejection at an extreme),
range extension beyond the Initial Balance, and
TPO distribution that favors the same direction.
When they align, longer-term players are showing conviction and follow-through is likely.
Step 1 - Identify & confirm the 3 signals
Confirm all three before trusting the set-up:
Initiative tail
• Look for single-print tail(s) at an extreme (top for selling tail, bottom for buying tail).
• The tail must be initiative, not just reactive — ideally it sits outside or within prior day value area and is followed by continued action in the same direction.
• A tail is valid only if price is rejected in at least one subsequent time period (i.e., it’s confirmed).
Range extension
• Price extends beyond the Initial Balance (A+B hour).
• The extension should be clear (not just a one-tick TPO). On many 3-1 examples extension is large and directional.
TPO count / profile bias
• The profile shows more TPOs on the extension side.
• TPOs favor the trend (more time/acceptance on the extension side).
Step 2 — Decide entry approaches
Conservative (recommended)
• Wait for the next day open to be within or better than the previous day’s value area (statistically highly probable after a 3-1).
• If next-day open confirms (opens in the trend direction or inside value but not against you), enter with a defined stop just beyond the tail/extreme.
• Advantage: extra confirmation, lower chance of false continuation.
Standard intraday (balanced)
• Enter after the tail + extension + TPO bias are visible and price pulls back to a logical support/resistance area:
• Buy: pullback into single-print area / inside single prints or into the upper edge of the prior value area.
• Sell: mirrored logic for downside.
• Place stop just beyond the tail extreme (a few ticks/pips beyond the single prints), or a tight structural stop below/above the retest.
Aggressive
• Enter as soon as price breaks out of the initial balance and shows range extension.
• Because this approach carries more risk of a false breakout, you should use the smallest position size and the tightest stop. If the breakout continues, you capture the move early and maximize reward. If it fails, your loss is limited because of the tight stop and small size.
📌 5.2 - Neutral-Extreme Day
A Neutral-Extreme Day starts as a neutral day (range extensions both above and below the Initial Balance) but closes near one extreme . That close signals a short-term “victor” among longer-term participants and gives a high-probability bias into the next session.
Neutral-Extreme Days are powerful because they combine both-sided testing (neutrality) with a clear winning side at the close. That winner often carries conviction into the next session — but always use proper stops and watch for early failure signs. Treat the setup as a probability edge, not a certainty.
Step 1 - Identify the Neutral-Extreme Day
Confirm the day was neutral : range extensions occurred both above and below the IB during the session.
Check the close : it is near the day’s high (neutral→high close) or near the day’s low (neutral→low close).
Note:
The close near an extreme indicates one side “won” the day and increased conviction.
Step 2 - Decide entry approaches
Conservative (recommended)
• Wait for the next days' open.
• If price of following days' opens
above the Neutral Day’s Value Area and the Neutral Day closed near the high => Long
below the Neutral Day’s Value Area and the Neutral Day closed near the low => Short
• Place stop just beyond the opposite edge of the previous day’s VA or slightly beyond today’s extreme.
Standard intraday (balanced)
• Wait for the next day’s first 30–90 minutes
• If price above the Neutral Day’s VA(or below the Neutral Day’s VA for short)
• Enter during the next day when early initiative activity confirms continuation
• Place stop just beyond the opposite edge of the Neutral day’s VA
Aggressive
• Enter at close of the Neutral-Extreme day, expecting continuation
• Use small size and a tight stop because overnight/new-session risk exists.
Example - 1
Example - 2
📌 5.3 - Spike
A spike is a fast, a few time periods move away from Value Area of trading session. Because it happens near the close, the market has not had time to “prove” the new levels (Price + Time = Value). The next session’s open and early activity tell you whether the spike will be accepted (continuation) or rejected (reversion).
1 - How to identify a spike
A spike starts with the period that breaks out of the day’s value area (the breakout period).
The spike range is from the breakout period’s extreme to the day’s extreme in the spike direction.
It is typically a quick, directional move in the last few time periods of the session.
2 - Acceptance vs Rejection - what to watch for next day
Because the move happened late, you must wait until the next trading day to judge follow-through. Early next-day activity shows whether value forms at the spike levels (acceptance) or not (rejection).
Accepted spike (continuation):
Next day opens beyond the spike (above a buying spike, below a selling spike), or
Next day opens inside the spike and then builds value there (TPOs/volume accumulate inside the spike).
Both cases mean the market accepts the new levels and continuation in the spike direction is likely.
Rejected spike (failure):
Next day opens opposite the spike (below a buying spike or above a selling spike) and moves away.
This indicates the probe failed and price will likely move back toward prior value.
3 - Spike Reference Points
Openings within the spike:
If next day opens inside the spike range → day is likely to balance around the spike.
Expect two-timeframe rotational trade (sideways activity) within or near the spike.
Treat the spike as a short-term new base : use the spike range (top-to-bottom of spike) as an estimate for that day’s range potential.
Openings outside the spike:
Open above a buying spike: very bullish - initiative buyers in control.
Trade idea: look to buy near the top of the spike (spike top becomes support).
Caution: if price later auctions back into the spike and breaks the spike top, the support may fail quickly.
Open below a selling spike: very bearish — initiative sellers in control.
Trade idea: look to short near the bottom of the spike (spike bottom becomes resistance).
Open above a selling spike (rejecting the spike): bullish day-timeframe signal, often leads to rotations supported by the spike top as support.
Open below a buying spike (rejecting the spike): bearish.
4 - Decide entry approaches
Conservative (recommended)
• Wait for next-day open and confirmation (open beyond spike or open inside then build value inside spike).
• Enter on a pullback toward the spike extreme (top for long, bottom for short).
• Place stop just beyond the opposite spike extreme.
Standard intraday (balanced)
• Enter at the open if it is above/below the spike in the spike direction.
• Use tight size and tight stop (higher risk / higher reward).
Aggressive
• Enter when early session shows initiative in spike direction (strong TPO/volume buildup).
• Stop under/above the spike extreme or an early structural swing.
🔸🔸🔸 6 - Conclusion 🔸🔸🔸
Becoming a proficient trader is much like designing with wood. At first, you study the fundamentals—understanding different types of wood, their strengths, how they react under load, and how joints transfer forces. Then you begin by following standard rules and templates, carefully measuring and cutting according to the book. Along the way, the tools you use—whether it’s a simple saw or advanced CNC machines—shape the quality of your work. Without the right tools, even solid knowledge can fall short. With practice, however, you learn not only how to apply the theory but also how to make the most of your tools, combining both into a process that feels natural and efficient. Eventually, you stop focusing on each detail step by step and instead feel how to create a structure that is both strong and elegant. Trading develops in the same way—starting from theory, moving through repetition, and finally reaching intuitive proficiency.
Success in trading is not about memorizing every pattern but about combining three essential elements: Theory + Your Judgment + Tools = Results . Theory provides the foundation, judgment comes from experience and self-awareness, and tools like TradingView allow you to test, visualize, and refine your edge. Together, these elements build the confidence to act decisively in live markets.
The strategies we explored—such as 3-1 Days, Neutral-Extreme Days, and Spikes —are valuable examples of how Market Profile structure can highlight high-probability opportunities. But now that you understand how profiles are built and the principles behind them, you are equipped to create and test your own strategies. Developing a personal approach not only strengthens your decision-making, it also raises your confidence level—one of the most important skills a trader can have.
In the end, Market Profile is not about rigid answers but about learning to think in market terms. Once theory and experience merge into intuition, opportunity becomes something you recognize instinctively—just as a fluent speaker understands meaning without translation. That is the essence of proficiency: not just knowing the rules, but mastering the ability to trade with clarity and conviction.
🔸🔸🔸 7 – Resources 🔸🔸🔸
If you’d like to deepen your knowledge of Market Profile and its applications, the following books are highly recommended:
A Six-Part Study Guide to Market Profile – CBOT
A clear and structured guide that introduces Market Profile theory step by step, making it accessible for both beginners and intermediate traders.
Steidlmayer on Markets: Trading with Market Profile – J. Peter Steidlmayer, Steven B. Hawkins
Written by the creator of Market Profile, this book lays out the foundational concepts and demonstrates how profiles reveal the auction process behind price movement.
Markets in Profile: Profiting from the Auction Process – James F. Dalton, Eric T. Jones, Robert B. Dalton
A modern exploration of how the auction process applies to today’s markets, combining Market Profile concepts with behavioral finance and practical strategy.
Mind Over Markets: Power Trading with Market Generated Information – James F. Dalton, Eric T. Jones, Robert B. Dalton
Considered a classic, this book provides a comprehensive framework for understanding and applying Market Profile. It bridges theory with practical trading insights, making it a must-read for serious traders.
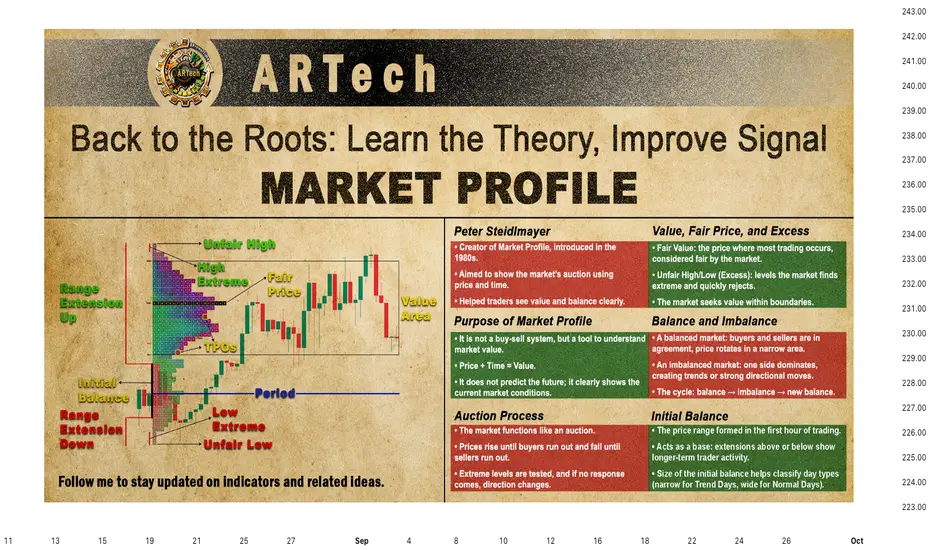
The Big Fed Rate Cut Is Here. How Did Markets Do & What’s Next?“ Best we can do is 25bps ,” officials, probably, when they gathered to lower the federal funds rate. It wasn’t the 50 basis points some of you had expected. But you also didn’t expect to hear that two more trims are most likely coming by year end.
Let’s talk about that and what it means for your trading.
🎤 Powell Delivers
The Federal Reserve finally trimmed rates for the first time in nine months, cutting the federal-funds rate by 25 basis points to 4%–4.25%. This was hardly a surprise.
Markets had already fully priced in a quarter-point move. But the real twist was the Fed boss hinting at two more cuts this year. With just two FOMC meetings on the calendar, it’s pretty clear: unless something changes dramatically, traders should expect a cut at both.
The decision wasn’t unanimous. Newly minted, Trump-appointed Fed governor Stephen Miran wanted to go big or go home with a 50bps slash. Powell, though, balanced his message by saying risks to the labor market had grown while inflation was still running at 2.9% (way above target).
What does this mean? The Fed’s dual mandate of price stability and full employment is officially leaning toward protecting jobs at the risk of flaring up inflation.
💵 Dollar Takes a Dive
The immediate reaction was classic. A weaker dollar is the natural byproduct of lower rates, and the greenback obliged by sliding against major peers.
The FX:EURUSD pushed toward $1.19, its highest in four years, while the FX:GBPUSD tested $1.37 and the FX:USDJPY sank below ¥146.
For forex traders, this was textbook: lower yields make the dollar less attractive, especially compared to rivals with steadier or higher returns. But that was a reaction to the initial shock.
By early Thursday the dollar bounced back, because markets love to overreact before correcting, but the broader trend is still tilted bearish .
📈 Stocks: Buy the Rumor, Sell the News
Stocks were less enthusiastic. The S&P 500 SP:SPX hovered near flat, the Nasdaq Composite NASDAQ:IXIC slipped 0.3% for a second straight loss, and the Dow Jones TVC:DJI managed to buck the trend with a 260-point climb.
The takeaway? Traders had already bought the rumor of rate cuts, jammed their cash into equities, so when Powell delivered the expected 25bps, it wasn’t enough to light another fire.
The bigger hope lies in those promised future cuts, which could set the stage for another push higher – especially if Big Tech earnings hold up through the third quarter. (For the record, earnings season is almost here.)
Thursday's futures contracts were showing a big jump ahead of the opening bell with Nasdaq futures up by more than 1%.
🟡 Gold Shines, Then Stumbles
Gold OANDA:XAUUSD did what gold usually does when the Fed loosens policy: it powered up. Bullion was surfing on the high point of its all-time record of $3,700, before sliding back under $3,640.
What’s the logic behind rising gold prices and a falling dollar? In a low-yield environment, non-yielding assets like gold look more attractive, and a weaker dollar only sweetens the deal for overseas buyers.
Still, this week’s whipsaw reminded everyone that gold is no straight line up – momentum is there, but so are the bears guarding resistance.
🟠 Bitcoin Shrugs
Crypto was more muted. Bitcoin BITSTAMP:BTCUSD slipped 1.2% after the cut, dipping toward $115,000, only to bounce back above $116,000 the next morning.
For the orange coin, the Fed story is just background noise. Institutional inflows and ETF demand remain the key drivers, and traders are still gauging whether crypto wants to behave like a risk asset or play its “digital gold” role.
Still, the OG coin remains off its $124,000 record from mid-August , the market seems caught between consolidation and correction.
⚖️ The Balancing Act
The Fed’s challenge is clear: unemployment is rising, job gains are slowing , and payrolls have been revised lower for months.
At the same time, inflation has crept back up, with core prices still well above target. Cutting too much risks reigniting price pressures; cutting too little risks a labor-market slide that could snowball into recession.
Powell chose the middle ground – a modest 25bps – and teased with two more to calm investor nerves.
👀 What’s Next?
Markets now have a new playbook: watch every jobs report ECONOMICS:USNFP , every CPI ECONOMICS:USCPI release, and every Powell presser between now and December.
If job creation continues to cool, the Fed will likely follow through with the cuts. If inflation heats up, those cuts may get scaled back. And if both trends stall, expect chop – the dreaded sideways trade that tests everyone’s patience.
What can you do in this situation? One message is to stay nimble. The dollar’s longer-term weakness is reshuffling the forex space, gold is on the cusp of a breakout, and stocks remain in record territory. And crypto is doing its usual unpredictable mood swinging.
In a nutshell, Powell gave markets a gift in the form of liquidity, but as history reminds us, the Fed giveth and the Fed taketh away.
👉 Off to you : What’s your strategy in this market? Now that you have the cut (and two more likely on the way), are you bullish or bearish? Share your thoughts in the comments!