How to Trade FOMC Days – Smart Money FrameworkFOMC days consistently produce some of the most volatile price movements in the market. The key is not predicting the news, but understanding how liquidity behaves around it. Below is a structured approach based on Smart Money Concepts.
1. Before the Release
Price typically consolidates and builds liquidity on both sides of the range.
Key steps:
Mark previous day’s high/low
Identify Asia range liquidity
Note premium/discount zones
Avoid early trades — the market often engineers traps before the announcement
2. During the Release (14:00–14:30 ET)
This is the most dangerous window.
Spreads widen
Slippage increases
Algo-driven spikes invalidate technical setups
The highest‑probability decision is to stay flat and observe.
3. After the Release
This is where the clean setups form.
Look for:
A sweep of a key high/low
A clear market structure shift
Retracement into an FVG, order block, or breaker
Targeting the next liquidity pool
This post‑news phase often delivers the most controlled and directional move of the day.
4. Markets Most Affected
USD pairs
Gold (XAUUSD)
Indices (US500, NAS100)
DXY for directional bias
Summary
FOMC is not about predicting the rate decision. It’s about letting liquidity do its job and trading the reaction, not the release. Patience during the chaos leads to clarity afterward.
⚠️ Disclaimer – DYOR
This idea is shared for educational purposes only. It reflects a personal interpretation of price action and smart money concepts.
Always do your own research before making trading decisions. Markets are volatile and carry risk.
Past performance does not guarantee future results.
Educationalpost

Why You Should Backtest (Before You Trust Any Strategy)Most traders ask the wrong question.
They ask:
“Does this strategy work?”
The better question is:
“When does this strategy stop working?”
Backtesting exists to answer that.
1. A Single Backtest Is Not Proof
One profitable run does not mean a strategy is good.
It means it worked once, under one set of assumptions.
Markets change.
Volatility changes.
Behavior changes.
Backtesting across parameters, symbols, and timeframes shows whether performance is structural or accidental.
2. Drawdown Matters More Than Profit
Profit attracts attention.
Drawdown determines survival.
Two strategies can both make money.
Only one lets you stay disciplined long enough to compound.
Backtesting reveals:
Worst historical drawdown
Length of drawdowns
Recovery behavior
If you don’t know those, you don’t know the strategy.
3. Most Strategies Fail From Fragility
Many strategies look great until you:
Change RSI length by 2
Shift timeframe slightly
Switch from BTC to ETH
If performance collapses from small changes, the edge isn’t robust.
Backtesting exposes fragility before the market does.
4. Backtesting Protects You From Yourself
Most trading mistakes aren’t technical.
They’re emotional.
Backtesting:
Sets realistic expectations
Reduces overconfidence
Prevents panic exits during normal variance
Confidence comes from data, not conviction.
5. Backtesting Is About Risk, Not Prediction
Backtesting doesn’t predict the future.
It defines boundaries.
It tells you:
What’s normal
What’s abnormal
When something is truly broken
That’s the difference between trading and guessing.
Final Thought
Strategies don’t fail because they’re bad.
They fail because traders never tested their limits.
Backtesting isn’t optional.
It’s the cost of taking trading seriously.

Trend Doesn’t Cancel Corrections (And the Herd Always Pays)Yesterday, I made a call that sounded “wrong” to most retail traders.
✅ Silver will fill the gap.
✅ Gold will drop into the 4750 zone.
Both happened.
Not because I’m a prophet.
But because markets don’t work like retail emotions want them to work.
Even in a strong bullish trend, corrections are not a surprise — they’re a requirement.
And the trader who understands that simple fact will outperform the trader who only understands “up or down”.
1) A Trend Is Not a Straight Line — It’s a Negotiation
Retail traders love clean narratives:
- “Gold is bullish, so it must go up.”
- “Silver is strong, so dips are impossible.”
- “If news is positive, price must pump.”
But a real trend is not a straight line.
A trend is a sequence of impulses and corrections.
And every correction exists for a purpose:
- to rebalance positioning
- to shake out weak hands
- to refill liquidity
- to reset the market’s ability to continue
In other words:
Corrections are not “against the trend.”
They are the trend’s fuel.
If you’re only prepared for continuation, you’re not trading a trend…
You’re worshipping it.
2) The Herd Always Thinks in One Direction (Because It Feels Safe)
Here’s one of the most dangerous illusions in trading:
When everyone agrees, it feels like certainty.
But in markets, mass agreement usually means something else: the trade is already crowded.
That’s when you start seeing the same comments everywhere:
- “Gold only goes up 🚀”
- “This is the breakout!”
- “Buy every dip!”
- “No more pullbacks, strong fundamentals!”
And that’s exactly the moment you should pause.
Not because the crowd is always wrong…
…but because when everyone is positioned the same way, the market has a problem:
✅ too many stops in one place
✅ too many emotions in one direction
✅ too little liquidity for continuation
✅ too many people chasing the “obvious move”
That’s where the correction becomes not only likely… but necessary.
3) Even If You Don’t Fade the Herd… At Least Don’t Join It Late
Let’s be clear:
You don’t need to be the hero who always sells the top or buys the bottom.
Sometimes the highest-IQ decision is simply: Stay out.
Because most traders don’t lose money by being wrong…
They lose money by being late.
They enter after:
- the breakout is old news
- the move is extended
- the risk is huge
- the stop placement is obvious
- the crowd is fully committed
So the market does what markets always do: it punishes certainty.
That’s how bullish trends still produce brutal red candles.
Not because the trend is broken…
…but because positioning needs to be cleaned.
4) The Market Isn’t “Against You” — It’s Against Predictability
Retail wants predictability.
Smart money wants liquidity.
And retail provides liquidity in the most predictable way possible:
- buying after too many green candles
- selling after too many red candles
- placing stops in obvious locations
- reacting emotionally to headlines
This is why the “herd trade” is so profitable for the other side.
Not because smart money is magical.
But because retail behavior is repetitive.
And anything repetitive becomes exploitable.
5) “Trading Is Zero-Sum” — So Ask the One Question That Matters
Here is the part most traders avoid because it kills their fantasy: Trading is a zero-sum game (especially in leveraged derivatives).
Meaning: If you win, someone else loses.
Now ask yourself: If all retail is bullish… who is left to buy?
And more importantly: If everyone is bullish, who is the liquidity?
Because it’s never “smart money”.
Smart money isn’t the one buying the last breakout candle at maximum risk.
Retail is.
So if all retail is bullish and fully committed… then the real question becomes:
✅ who is trapped?
✅ who owns their stops?
✅ who will panic first?
And once you think this way, the market becomes clearer.
Not easier.
But clearer.
The Real Lesson: Trends Are Easy — Positioning Is Hard
Anyone can say:
“Gold is bullish.”
That’s not analysis.
That’s a weather report.
The real skill is knowing when:
- the bullish trend needs a correction
- the “obvious continuation” becomes the trap
- the herd has overloaded one side
- patience becomes the edge
Because the market rewards:
✅ timing
✅ discipline
✅ structure
✅ emotional neutrality
Not crowd confidence.
Final Thought
When you see everyone on the same side… don’t blindly fight them.
But most of all, don’t blindly join them.
Do the professional thing: pause, reassess, and respect the correction inside the trend.
Because in the end…
Smart money doesn’t need to outsmart everyone.
It only needs retail to behave like retail.
And retail never disappoints.
✅ Stay sharp.
✅ Stay patient.
✅ Stay out when it’s crowded.
That alone puts you ahead of 90% of traders.
Best Of Luck!
Mihai Iacob

“I Was Right” in Trading Has Two Parts, Ego Only Understands OneI’ve written before about the ego trap in trading — how many traders care more about being right than being profitable.
But today, let’s be brutally honest.
Most traders don’t lose money because they lack knowledge.
They lose because they’re addicted to one sentence: “I was right.”
Not “I executed well.”
Not “I managed risk.”
Not “I took profit like a professional.”
Just: “I was right.”
And the most dangerous part is this:
They can lose money…
and still feel successful…
because the chart eventually moved in the direction they predicted.
But trading is not a debate.
Trading is not a prediction contest.
Trading is not an ego competition.
Trading is a performance business.
And if you want brutal clarity, here it is:
✅ “I was right” has TWO components.
And if you only have one of them… you were not right.
The “I Was Right” addiction (and why it destroys traders)
- Being “right” feels good.
- It feeds the ego.
- It gives you the illusion of control.
- It makes you feel smarter than the market.
That’s why traders love saying things like:
- “I called it!”
- “I told you!”
- “Look at price now!”
- “My target got hit!”
But markets don’t reward ego.
Markets reward survival + execution.
So let’s define what “I was right” actually means.
Component #1: The market must move the way you said it would (in the correct order)
This is the part most traders misunderstand.
Because they think being right means: “My target was hit.”
But that’s not what being right means in trading.
Real example (Gold Monday)
Let’s say your Monday analysis looked like this:
“Gold will fill the weekend gap first, and then it will rally to 4850.”
Clean plan.
Clean logic.
Two-step scenario.
Now imagine what actually happens:
- The gap never gets filled
- Price rallies directly
- Gold reaches 4850
And suddenly, people say:
✅ “See? I was right!”
No! You weren’t!
If the entry never happened, you weren’t right
Let’s be brutally clear:
If your plan was gap fill first, and the gap was never filled… then your analysis was wrong.
Even if gold went up.
Even if it went to your target.
Because trading is not about what eventually happens.
Trading is about the path you traded.
Your scenario had a sequence:
- Gap fill
- Rally to 4850
If step 1 fails, the trade idea fails.
The market didn’t follow your plan.
It only coincidentally touched your number.
And coincidence is not skill.
Why this matters (the arguments ego traders hate)
1) A target being hit is meaningless if no trade was triggered
A trade is not a prediction.
A trade is a sequence:
s etup → trigger → entry → execution → exit
If your entry condition never happened, your trade never existed in real life.
So price reaching 4850 doesn’t prove you were right.
It proves only one thing:
Price can hit levels without respecting your logic.
2) You can’t claim correctness without the entry
This is where ego starts cheating.
Instead of saying: “My entry condition failed.”
Ego traders say: “The target was hit, so I was right.”
That’s not analysis.
That’s self-defense.
A forecast without an executable entry is not a trade plan.
It’s a story.
3) If the order of events is wrong, the thesis is wrong
When you say “gap fill first,” you’re implying structure:
- price must retrace
- liquidity must be taken
- imbalance must be resolved
- the market should behave in a specific way
If that doesn’t happen… your read was incorrect.
Price hitting your final level doesn’t fix your thesis.
It only hides the mistake.
4 ) The worst part: it creates fake confidence
And fake confidence is lethal.
Because next time, the trader starts thinking:
“Even if my entry doesn’t happen, my targets are still correct.”
So they begin to:
- chase price
- force entries
- ignore invalidation
- move stops
- overleverage
And that’s how the “I was right” mindset quietly becomes account suicide.
Component #2: Your trade must survive the move (otherwise you were never right)
Now we reach the part that destroys accounts.
Because trading is not forecasting.
- It’s not “October target ideas.”
- It’s not being a chart prophet.
Trading is execution under risk.
And here’s the truth:
✅ The market can move in your direction
❌ and you can still be completely wrong
How?
Because if you didn’t manage risk properly… the market can wipe you out before it proves your target “right.”
Real example: “Gold will reach 4850 said on October” (and you still weren’t right)
Let’s use a real situation.
Imagine it’s October.
Gold is trading around 4300.
And you post confidently:
“Gold will go to 4850.”
Eventually, gold does reach 4850.
And you instantly say:
✅ “I was right!”
But here’s what you ignore — the part that matters:
Before reaching 4850, gold dropped nearly 5000 pips in 6 days
Now let’s speak like adults.
If price moved against you almost 5000 pips in a week… and you were trading margin (not holding physical gold long-term)… then you did “experience volatility.”
Also you experienced something far worse:
✅ you got margin called
✅ you got liquidated
✅ you lost the account
So no — you were not right.
Even if the chart later touched your magical number.
Because trading is not a screenshot.
It’s survival.
The question professionals ask (and ego traders avoid)
When someone says: “Gold will reach 4850”
A professional doesn’t say: “Wow, what a target!”
A professional asks:
- Where is the entry?
- Where is the invalidation?
- Where is the stop loss?
- What’s the position size?
- What’s the maximum tolerated drawdown?
- Can the account survive the path?
Because if you didn’t define the risk… you didn’t make a trading plan.
You made a wish.
And wishes don’t protect accounts.
The difference between analysts and traders
This is where many people get confused.
Analysts want to be correct.
Traders want to get paid.
And you can’t get paid if you treat risk as an optional detail.
That’s why so many people win debates and lose money.
They keep saying:
- “I called it”
- “I was right”
- “check the chart now”
But their account is dead.
And the market does not pay for predictions.
It pays for execution.
The ego trap: “being right” becomes more important than making money
This is the psychological disease behind most retail trading failure.
The ego loves being right because it protects identity.
It allows you to lose money while still feeling smart.
It turns trading into an emotional game where the goal is not profit…
The goal is not being wrong.
But the market doesn’t care about your ego.
There are no grades for “good idea.”
There is no prize for “almost correct.”
There is no trophy for “eventually it happened.”
Only one thing matters:
✅ Did you make money with controlled risk?
If not…
you weren’t right.
The ONLY rule: Right means right in execution, not right in theory
Here’s the rule that destroys the “I was right” addiction:
A prediction is not correctness.
Correctness is profitability with survival.
So yes — “I was right” has two parts:
1) The market moved exactly as expected (including the sequence)
and…
2) Your execution survived the path
Miss either one?
You weren’t right.
You were lucky.
Or reckless.
Or both.
Final message: Stop trying to be right — start trying to be profitable
You don’t need to win against the market or arguments with others.
You need to work with the market.
You don’t need perfect forecasts.
You need:
- clear invalidation levels
- realistic timing
- risk control
- the ability to survive
Because a trader who survives can always come back.
But a trader who blows up while being “right”… will never trade the next opportunity.
And that is the most expensive form of correctness.
The market doesn’t reward conviction and hypothetical targets reached
It rewards execution.
Best Regards!
Mihai Iacob

Finding Edge Where Others Aren't Looking
The Best Traders Aren't Just Looking at Charts Anymore
While most traders stare at the same charts, indicators, and news feeds...
A new breed of traders is counting cars in parking lots from space, tracking shipping containers across oceans, and analyzing millions of social media posts.
This is alternative data - and it's changing who has the edge.
What Is Alternative Data?
Definition:
Alternative data is any data used for investment decisions that isn't traditional financial data (price, volume, earnings, etc.).
Traditional Data:
Price and volume
Financial statements
Earnings reports
Economic indicators
Analyst ratings
Alternative Data:
Satellite imagery
Social media sentiment
Web traffic and app usage
Credit card transactions
Geolocation data
Weather patterns
Job postings
Patent filings
And much more...
Types of Alternative Data
1. Satellite and Geospatial Data
What It Tracks:
Retail parking lot traffic
Oil storage tank levels
Crop health and yields
Shipping and logistics
Construction activity
Example:
Count cars in Walmart parking lots before earnings.
More cars = more sales = potential earnings beat.
Edge: Information before it appears in financial reports.
2. Social Media and Sentiment Data
What It Tracks:
Brand mentions and sentiment
Product buzz
Consumer complaints
Viral trends
Influencer activity
Example:
Track sentiment around a new product launch.
Negative sentiment spike = potential sales disappointment.
Edge: Real-time consumer reaction before sales data.
3. Web Traffic and App Data
What It Tracks:
Website visits
App downloads and usage
Search trends
E-commerce activity
User engagement
Example:
Track app downloads for a gaming company.
Declining downloads = potential revenue miss.
Edge: Usage data before quarterly reports.
4. Transaction Data
What It Tracks:
Credit card spending
Point-of-sale data
E-commerce transactions
Consumer behavior patterns
Example:
Aggregate credit card data shows spending at restaurants declining.
Restaurant stocks may underperform.
Edge: Spending patterns before earnings.
5. Employment and Job Data
What It Tracks:
Job postings
Hiring trends
Layoff announcements
Glassdoor reviews
LinkedIn activity
Example:
Company suddenly posts many engineering jobs.
Could indicate new product development.
Edge: Corporate strategy signals before announcements.
6. Supply Chain Data
What It Tracks:
Shipping container movements
Port activity
Supplier relationships
Inventory levels
Logistics patterns
Example:
Track shipping from key suppliers to Apple.
Increased shipments before product launch = strong demand.
Edge: Supply chain signals before sales data.
How AI Processes Alternative Data
Challenge:
Alternative data is:
Massive in volume
Unstructured (images, text, etc.)
Noisy
Requires specialized processing
AI Solutions:
1. Computer Vision
Analyzes satellite imagery
Counts objects (cars, ships, tanks)
Detects changes over time
2. Natural Language Processing
Processes social media text
Extracts sentiment
Identifies trends and topics
3. Machine Learning
Finds patterns in transaction data
Predicts outcomes from alternative signals
Combines multiple data sources
4. Time Series Analysis
Tracks changes over time
Identifies anomalies
Forecasts future values
Alternative Data in Practice
Case Study 1: Retail Earnings
Satellite data shows parking lot traffic up 15% vs last year
Social sentiment for brand is positive
Web traffic to e-commerce site increasing
Prediction: Earnings beat
Result: Stock rises on earnings
Case Study 2: Oil Prices
Satellite shows oil storage tanks filling up
Shipping data shows tankers waiting to unload
Prediction: Supply glut, prices may fall
Result: Oil prices decline
Case Study 3: Tech Company
App download data shows declining engagement
Job postings show layoffs in key division
Social sentiment turning negative
Prediction: Guidance cut coming
Result: Stock falls on earnings
Alternative Data Challenges
Cost - Quality alternative data is expensive. Satellite data: $10,000-$100,000+/year. Transaction data: $50,000-$500,000+/year. Not accessible to most retail traders.
Signal vs Noise - Most alternative data is noise. Requires sophisticated processing. Easy to find false patterns. Overfitting risk is high.
Alpha Decay - As more traders use the same data, edge disappears. Popular datasets become crowded. Unique data sources are key.
Legal and Ethical Issues - Some data collection is questionable. Privacy concerns. Data sourcing legality. Regulatory scrutiny increasing.
Integration Complexity - Combining alternative data with trading is hard. Different formats and frequencies. Requires specialized infrastructure.
Alternative Data for Retail Traders
Accessible Options:
1. Social Sentiment Tools
Free or low-cost sentiment indicators
Twitter/X trending analysis
Reddit sentiment trackers
2. Google Trends
Free search trend data
Track interest in products/companies
Identify emerging trends
3. Web Traffic Estimators
SimilarWeb, Alexa (limited free tiers)
Estimate website traffic
Compare competitors
4. App Store Data
App Annie, Sensor Tower (limited free)
Track app rankings and downloads
Monitor mobile trends
5. Job Posting Aggregators
Indeed, LinkedIn trends
Track hiring patterns
Identify company direction
Building an Alternative Data Framework
Step 1: Identify Your Edge
What information would give you an advantage?
What do you trade?
What drives those assets?
What data could predict those drivers?
Step 2: Find Data Sources
Free sources first (Google Trends, social media)
Low-cost aggregators
Premium sources if justified
Step 3: Process and Analyze
Clean and structure the data
Look for correlations with price
Backtest any signals
Step 4: Integrate with Trading
How will you use the signal?
What's the trading rule?
How do you size positions?
Step 5: Monitor and Adapt
Track signal performance
Watch for alpha decay
Continuously improve
Key Takeaways
Alternative data provides information before it appears in traditional sources
Types include satellite imagery, social sentiment, web traffic, transactions, and more
AI is essential for processing unstructured alternative data at scale
Challenges include cost, noise, alpha decay, and integration complexity
Retail traders can access some alternative data through free or low-cost tools
Your Turn
Have you used any alternative data sources in your trading?
What unconventional information do you think could provide edge?
Share your thoughts below 👇

Why Small Accounts Blow Up (It’s Not the Market)A question I see everywhere in trading is:
“Can I start trading with a small account?”
Like $100… $200… $300…
And the honest answer is:
✅ Yes, you can start.
But the real problem is not the account size.
The real problem is the expectation behind it.
Because most traders don’t ask this question from curiosity.
They ask it from pressure.
The small account is not the danger — the mindset is
A small account becomes dangerous when you treat it like:
- a rescue plan
- a shortcut
- a “last chance”
- a quick flip into financial freedom
That mindset quietly forces urgency into your decisions.
And once urgency enters trading, you get the classic spiral:
❌ bigger lot sizes
❌ no stop loss discipline
❌ revenge trades
❌ chasing volatility
❌ “I just need one good trade…”
That’s not trading.
That’s emotional survival mode.
What most people really mean by “small account”
Let’s decode the real question:
When someone says “Can I start with $200?” they usually mean:
“Can I turn this into a big amount quickly?”
And that’s where trading goes wrong.
Because the market doesn’t reward hope.
It rewards execution.
The market doesn’t pay you faster because you need it
Trading doesn’t care if you’re struggling.
It doesn’t care if you’re a good person.
It doesn’t care if you “deserve” a win.
It only responds to:
✅ discipline
✅ risk management
✅ consistency
✅ probabilities
This is why many traders get emotionally exhausted.
They are not fighting the market…
They are fighting reality.
A small account should be a training account
If you start small, the healthiest approach is to treat it like:
📌 a skill-building account
not an income-producing machine.
Your job is not to “make money fast.”
Your job is to build:
- stable execution
- controlled risk
- emotional patience
- repeatable decisions
Because that’s what scales later.
The harsh truth: “one month to change everything” is a fantasy
One of the most common mental traps in retail trading is:
“I just need one month… then I’ll be set.”
But if your plan depends on a short deadline…
- you are not trading probabilities.
- You are betting on a miracle.
- And miracles don’t build careers.
So yes, you can start small — but only with realistic rules
Here’s what a small account needs:
✅ small position sizing
✅ strict risk per trade
✅ patience with slow growth
✅ acceptance of losses
✅ focus on process > outcome
Most traders don’t fail because the account is too small.
They fail because their expectations are too big.
Final thought
If you’re starting with a small account, respect it.
Because it’s not “small money.”
It’s your tuition fee into a profession.
Trading isn’t hard because charts are complex.
It’s hard because your emotions don’t want to be realistic. 🚀

Parabolic Moves Don’t Always End in Collapse — Silver ExplainedI’ve seen many analyses from my colleagues where 1980 and 2011 are used not as upside projections, but as collapse templates for silver.
The argument is simple and visually convincing: silver has already gone parabolic, therefore the next chapter must be a collapse similar to those historical episodes.
I understand the logic.
I don’t predict the future, and I can’t categorically deny that such an outcome is possible.
But here’s where I draw a clear line: similar-looking charts do not guarantee similar outcomes, especially when the underlying drivers are fundamentally different.
And in silver’s case, they are different.
Let’s be precise about what 1980 really was (and why it collapsed)
The 1980 silver collapse is often treated as a “natural law of parabolic moves”.
In reality, it was not a natural market outcome.
It was the direct consequence of extreme concentration and leverage, driven by the Hunt brothers.
What made 1980 fragile by design
- The Hunts accumulated an extraordinary share of the global silver supply, both physical and paper.
- They used massive leverage in a relatively small and illiquid market.
- The price did not rise because global demand structurally changed — it rose because supply was artificially constrained.
- Once exchanges changed the rules (margin hikes, liquidation-only trading), the entire structure collapsed under its own weight.
This is critical:
The collapse of 1980 was not caused by silver being “too expensive”.
It was caused by the system forcibly unwinding a concentrated position.
So when someone says “this looks like 1980”, the real question is:
- Where is today’s equivalent of that concentration?
- Who controls 30–40% of deliverable supply?
- What single entity is forced to liquidate?
If that element is missing, then the collapse logic weakens dramatically.
2011: parabolic, yes — structurally unstable, also yes
2011 is a more honest comparison, and this is where many collapse arguments focus.
Silver:
- rallied aggressively,
- became a retail darling,
- and eventually collapsed hard.
But again, the reason it collapsed matters.
Why 2011 unraveled
- The rally was dominated by financial demand, not structural necessity.
- ETFs, leverage, and macro fear created fast money flows.
- When liquidity tightened and risk appetite faded, demand evaporated quickly.
- There was no structural constraint on supply forcing price stability.
In other words:
- 2011 collapsed because demand was reversible.
- Once sentiment flipped, there was nothing underneath to slow the fall.
Now comes the disagreement: why I don’t expect a 1980/2011-style collapse this time
Yes — I fully agree on one thing: extreme volatility is coming, or is already here (yes, more extreme than we've seen!)
Silver doesn’t trend quietly. It never has.
But volatility and collapse are not the same thing.
The key difference today: the type of demand
Today’s silver market is not driven solely by:
- fear,
- speculation,
- or monetary narratives.
A large and growing portion of demand is industrial and strategic:
- electrification,
- energy transition,
- technology infrastructure.
That demand:
- doesn’t disappear overnight,
- doesn’t panic-sell because RSI is overbought,
- and doesn’t care about chart symmetry.
This changes the downside dynamics.
Supply cannot respond the way people assume
Another overlooked point:
- most silver production is a by-product of other metals.
- higher prices do not instantly bring new supply online.
In 1980 and 2011, supply dynamics were not a binding constraint.
Today, they are.
That doesn’t mean price can’t drop — it means drops are more likely to be violent corrections, not structural collapses.
About the “parabolic = must collapse” logic
This is where I respectfully disagree with many analysts.
A parabolic move tells you:
- volatility is increasing,
- positioning is crowded,
- risk management becomes essential.
It does not automatically tell you:
- the entire move must fully retrace,
- or that price discovery was fake.
Markets can:
- correct through time instead of price,
- form wide ranges,
- or retrace partially and rebase.
History offers multiple outcomes, not a single script.
My base case (clear and unemotional)
- Yes, I expect extreme swings.
- Yes, I expect sharp pullbacks that will scare most participants.
- No, I do not see a clear mechanism today for a 1980-style forced collapse.
- And unlike 2011, I don’t believe demand disappears just because momentum cools.
This is not optimism.
It’s structure-based reasoning.
Trading perspective (grounded)
Because I expect volatility:
- I don’t chase vertical candles.
- I respect levels, not narratives.
- I scale, I take partial profits, and I allow room for noise.
- I treat silver as a dangerous instrument, not a lottery ticket.
Being right about direction is useless if volatility kicks you out first.
Final thought
My colleagues may be right — markets can always surprise.
But assuming collapse just because the chart looks familiar is lazy analysis.
1980 collapsed because of forced concentration unwind.
2011 collapsed because of reversible financial demand.
Today, silver is volatile — not hollow.
And that distinction matters more than any historical overlay.
The market will decide.
My job is to respect risk, not marry analogies 🚀
Best of luck!
Mihai Iacob

Volatility Trading: The Edge Hiding in Plain Sight
Most Traders Ask "Which Direction?" Smart Traders Ask "How Much Movement?"
Here's a secret that changed my understanding of markets:
You don't have to predict direction to make money.
You can trade volatility itself — betting on whether markets will move a lot or a little, regardless of which way they go.
This is the edge hiding in plain sight.
What Is Volatility?
Simple Definition:
Volatility measures how much price moves over a given period.
Two Types:
Historical (Realized) Volatility:
What actually happened. Calculated from past price movements.
Implied Volatility:
What the market expects to happen. Derived from options prices.
The Key Insight:
The gap between implied and realized volatility is where edge lives.
Why Volatility Matters
1. Volatility Affects Everything
Position sizing should adjust to volatility
Stop losses should account for volatility
Profit targets should reflect volatility
Strategy selection depends on volatility regime
2. Volatility Is Mean-Reverting
Unlike price, volatility tends to return to average levels.
High volatility eventually calms
Low volatility eventually explodes
This creates predictable patterns
3. Volatility Is Often Mispriced
Options markets systematically overprice volatility.
Implied volatility > Realized volatility (on average)
This creates opportunities for volatility sellers
But tail risks are real
Measuring Volatility
Indicator 1: ATR (Average True Range)
Measures average price range over N periods.
Use:
Position sizing
Stop loss placement
Identifying volatility expansion/contraction
Indicator 2: Bollinger Band Width
Measures distance between upper and lower bands.
Use:
Identifying squeeze (low volatility)
Anticipating breakouts
Regime classification
Indicator 3: VIX (Volatility Index)
Market's expectation of 30-day volatility.
Use:
Fear gauge
Extreme readings signal turning points
Mean reversion trading
Indicator 4: Historical Volatility
Standard deviation of returns over N periods.
Use:
Comparing to implied volatility
Identifying volatility regime
Risk assessment
Volatility Trading Strategies
Strategy 1: Volatility Mean Reversion
Concept: Volatility extremes tend to revert to average.
Implementation:
When VIX spikes to extremes → expect volatility to decrease
When VIX is extremely low → expect volatility to increase
Trade options or volatility products accordingly
Risk: Volatility can stay extreme longer than expected.
Strategy 2: Volatility Breakout
Concept: Low volatility precedes high volatility.
Implementation:
Identify compression (Bollinger squeeze, low ATR)
Prepare for expansion
Enter on breakout with momentum
Risk: False breakouts, whipsaws.
Strategy 3: Implied vs Realized Arbitrage
Concept: Implied volatility often exceeds realized.
Implementation:
Compare current IV to historical realized vol
If IV significantly higher → sell options (collect premium)
If IV significantly lower → buy options (cheap insurance)
Risk: Tail events can exceed any premium collected.
Strategy 4: Volatility Regime Adaptation
Concept: Different strategies work in different volatility regimes.
Implementation:
Classify current regime (high/low volatility)
Apply appropriate strategy
Adjust position sizing to regime
Example:
Low volatility → Mean reversion strategies
High volatility → Trend following with wider stops
How AI Enhances Volatility Trading
1. Regime Classification
AI can identify volatility regimes in real-time:
Clustering algorithms group similar periods
Classification models predict regime changes
Adaptive systems switch strategies automatically
2. Volatility Forecasting
Machine learning models can forecast volatility:
GARCH models for time series
Neural networks for complex patterns
Ensemble methods for robustness
3. Optimal Position Sizing
AI calculates position size based on:
Current volatility
Expected volatility
Risk tolerance
Portfolio correlation
4. Anomaly Detection
AI identifies unusual volatility patterns:
Volatility spikes without news
Unusual options activity
Divergences between implied and realized
The Volatility Cycle
Phase 1: Compression
Volatility decreases
Ranges tighten
Bollinger Bands squeeze
Market "coils"
Phase 2: Expansion
Volatility explodes
Ranges widen
Breakout occurs
Trend begins
Phase 3: Peak Volatility
Maximum fear or euphoria
VIX spikes
Extreme moves
Often marks turning points
Phase 4: Normalization
Volatility decreases
Market stabilizes
Return to average
Cycle repeats
Volatility Trading Risks
Tail Events — Volatility can spike far beyond historical norms. 2008 financial crisis, 2020 COVID crash, flash crashes. Always have defined risk, never sell naked options.
Volatility Clustering — High volatility tends to follow high volatility. Don't assume immediate mean reversion. Use time-based exits, not just price-based.
Liquidity Disappears — During volatility spikes, liquidity evaporates. Spreads widen dramatically, stops get slipped. Size positions for worst-case liquidity.
Model Failure — Volatility models are based on historical data. Past patterns may not repeat. Use multiple models, maintain skepticism.
Building Volatility Into Your Trading
Step 1: Measure Current Volatility
Add ATR or Bollinger Band Width to your charts.
Know whether you're in high or low volatility.
Step 2: Adjust Position Sizing
Position Size = Risk Amount / (ATR × Multiplier)
Higher volatility = smaller positions.
Step 3: Adjust Stops
Use ATR-based stops that adapt to volatility.
2 ATR stop in normal conditions
3 ATR stop in high volatility
Step 4: Select Appropriate Strategies
Low volatility: Mean reversion, range trading
High volatility: Trend following, breakouts
Step 5: Monitor Regime Changes
Watch for:
Bollinger squeeze (compression)
VIX extremes
ATR expansion/contraction
Volatility Checklist
Before every trade:
What is current volatility (ATR, BB width)?
Is volatility high, low, or normal?
Is my position size adjusted for volatility?
Are my stops appropriate for current volatility?
Does my strategy fit the volatility regime?
Key Takeaways
Volatility trading focuses on how much price moves, not which direction
Volatility is mean-reverting — extremes tend to normalize
The gap between implied and realized volatility creates opportunities
Different strategies work in different volatility regimes
Always adjust position sizing and stops for current volatility
Your Turn
Do you currently adjust your trading for different volatility conditions?
Have you ever traded volatility directly (options, VIX products)?
Share your experience below 👇

Trading Sins to Overcome in 2026 — A Guide for Serious TradersTrading isn’t just about charts, patterns, and strategies. It’s a mirror — one that reflects discipline, emotional maturity, patience, and self-awareness.
Most traders don’t lose because the market is “unfair.”
They lose because the market exposes weaknesses they haven’t yet worked through.
In 2026, markets will continue to evolve — liquidity shifts, narratives change faster, and emotional pressure will only increase. The traders who survive won’t just be technically skilled. They will be the ones who understand themselves.
Below are the seven trading sins every trader must confront — not with guilt, but with awareness, compassion, and discipline.
1. Lust — Chasing Hype Instead of Discipline
Lust in trading shows up as an obsession with the “shiny object”:
• chasing hyped tokens
• entering parabolic moves late
• confusing excitement with opportunity
By the time something is everywhere on social media, attention is already priced in. Late buyers don’t join rallies — they provide exit liquidity.
Psychology insight:
Lust grows from fear of missing out on belonging — not just profits. Traders chase hype because they want to “be where the action is.”
The antidote is alignment:
• trade your plan, not the market’s noise
• define your time-horizon & objectives
• stay loyal to your strategy, not to trends
A disciplined trader doesn’t need external excitement. Consistency becomes the thrill.
2. Gluttony — Overloading Strengths and Ignoring Blind Spots
Gluttony in trading isn’t overeating — it’s over-leaning:
• only trading longs
• repeating one setup everywhere
• scaling success until it becomes weakness
A trader who thrives only in one condition is not skilled — just lucky within a narrow environment.
Psychology insight:
Gluttony is rooted in comfort bias — the brain seeks repetition of what once worked, even when the environment changes.
True maturity comes from balance:
• diversify tools, not just assets
• observe the trader on the other side of your trade
• ask: does this serve my long-term objective?
Your edge is not a weapon — it is a responsibility.
3. Greed — Wanting the Whole Move Instead of the Probable One
Greed doesn’t just mean wanting more money — it means refusing to accept “enough.”
It shows up as:
• entering too early, with too much size
• letting wins turn into losses
• trying to catch bottoms and tops
Professionals don’t chase precision — they take the meat of the move.
Psychology insight:
Greed is impatience disguised as ambition.
Traders expect mastery before they’re emotionally ready for it.
Growth mindset for 2026:
• accept that mastery takes years
• define exits before entries
• allow yourself to be “wrong small” and “right sustainable”
Profit isn’t made in a single great trade — it’s built in consistency.
4. Sloth — Under-Preparation in a Constantly Changing Market
Sloth appears when traders:
• stop reviewing markets
• avoid journaling
• rely on outdated biases
The market evolves daily.
Your preparation must evolve with it.
Psychology insight:
Sloth is rarely laziness — it is avoidance of discomfort.
Reviewing mistakes is emotionally painful, so many traders avoid reflection… and repeat errors.
Habits that beat sloth:
• pre-market routine
• ongoing self-assessment
• incremental improvements rather than radical overhauls
Discipline is not intensity — it is continuity.
5. Wrath — Revenge Trading and Emotional Overreaction
Wrath in trading is anger directed at the market — and then at ourselves.
It manifests as:
• doubling down after losses
• trying to “win back” money
• self-criticism after mistakes
The damage isn’t just financial — it’s also psychological.
Psychology insight:
Wrath is triggered when ego collides with reality.
We don’t rage at the chart — we rage at losing our self-image.
Practical antidote:
• reduce size when emotional
• normalize losses in advance
• rehearse acceptance of max loss calmly
Emotional resilience is a skill — and it must be trained outside live trading.
6. Envy — Measuring Progress Against Other Traders
Envy is subtle and destructive:
• comparing returns
• trying to “catch up”
• assuming others are ahead
There will always be someone with:
• more capital
• better timing
• bigger wins
Chasing others’ journeys leads to reckless trading.
Psychology insight:
Envy grows when self-worth is tied to account balance.
Shift the lens to internal progress:
• define your goals
• measure your improvements
• celebrate small milestones
Success in trading is personal — and deeply individual.
7. Pride — Refusing to Adapt or Admit Being Wrong
Pride is the most dangerous trading sin.
It appears as:
• ignoring stop losses
• adding to losers
• defending a biased narrative
The market humbles those who resist humility.
Psychology insight:
Pride protects the ego from pain — but destroys the account.
The professional mindset:
• build plans based on objective data
• explore multiple scenarios
• let price confirm — not opinion
Adaptability is not weakness — it is the highest form of strength.
Final Thought — Growth Over Perfection
These “trading sins” are not moral flaws.
They are human patterns — predictable, emotional, deeply psychological.
The goal is not to eliminate them — but to recognize, manage, and outgrow them.
2026 will reward the trader who:
• reflects instead of reacts
• plans instead of hopes
• evolves instead of resists
Trading mastery is not the victory of logic over emotion — it is the integration of both.
Happy New Year!
Mihai Iacob

Algorithmic Trading vs Manual TradingWhy the Edge Is Shifting And Why 2026 May Be a Turning Point
As this year comes to an end, it’s the perfect moment to slow down, zoom out, and ask an uncomfortable but necessary question:
Are we trading the markets — or are the markets trading us?
Whether you are in your first year of trading or have spent a decade studying charts, there comes a moment of clarity where you ask yourself:
“If I know what to do… why don’t I always do it?”
Beginners ask this after their first emotional mistake.
Experienced traders ask it after their hundredth.
The market does not punish ignorance as harshly as it punishes inconsistency.
Most traders don’t fail because they lack knowledge.
They fail because they are human.
We all know this pattern:
The entry is clear but hesitation creeps in
The stop is defined but gets adjusted “just a little”
The trend is obvious yet profits are taken too early
The system says don’t trade but emotions say this time is different
At the end of the day, trading is not a battle against the market.
It’s a battle against ourselves.
And that’s exactly where algorithmic (systematic) trading enters the game. Not as a shortcut, not as a holy grail, but as an evolution of execution.
Now, with AI evolving rapidly and tools becoming accessible to retail traders, something big is happening:
The same systematic edge institutions used for years is now available to individuals.
That raises a powerful question:
Can a system (without emotion, instinct, or fear) trade better than a human?
After spending the last 6–8 months deeply immersed in algorithmic trading, intense backtesting, rule-building, and system refinement, I came to a conclusion:
Algorithmic trading is not just the future, it’s the logical evolution of trading itself.
And I strongly believe 2026 will be a major turning point.
Let’s break this down properly.
Manual Trading (Human Trading) → The Strengths & The Silent Killers
Manual trading is where almost everyone starts and for good reason.
What humans do exceptionally well
Pattern recognition
Context awareness and regime interpretation
Macro, narrative, and sentiment understanding
Adaptation during abnormal market conditions
For experienced traders, discretion often becomes earned intuition.
But here’s the uncomfortable truth:
The better you get, the more painful your mistakes become.
Why?
Because you know better yet still break your own rules.
Humans are great at ideas.
But trading success doesn’t come from ideas.
It comes from execution → repeated thousands of times.
And this is where humans struggle most.
The Complete List of Human Trading Failures (The Real Reason Most Traders Lose)
Regardless of experience, humans share the same failure modes.
Here’s the part most people avoid talking about.
Emotional failures
Fear when price approaches entry
Greed when price runs in profit
Panic after one losing trade
Overconfidence after a winning streak
Revenge trading to “get it back”
Execution & discipline failures
Moving stop losses too early
Widening stops to avoid realizing a loss
Taking profit early because “it’s green now”
Ignoring your system once emotions kick in
Changing rules mid-trade
Cognitive biases (even in professionals)
Confirmation bias (seeing only what supports your bias)
Recency bias (overweighting the last trade)
Anchoring to entry price
Counter-trading the trend because price “feels extended”
Lifestyle & state-based issues
Trading tired
Trading stressed
Trading distracted
Trading emotionally impacted by life events
The classic question every trader has asked:
“Why did I take profit so early when the trend was obvious?”
Or:
“Why did I counter-trade when the moving averages clearly showed downside momentum?”
These aren’t skill problems.
They are human problems.
The Hard Truth: Trading Is an Execution Game
Markets reward:
Consistency
Repetition
Risk control
Statistical edge
They do not reward:
Creativity during execution
Emotional intelligence in drawdowns
Smart excuses
Execution quality determines outcomes and execution is precisely where humans are weakest.
Algorithmic Trading → What Changes When Rules Take Control
Algorithmic trading removes the weakest link in trading:
The trader.
A system:
Doesn’t feel fear, stress, fatigue, or boredom
Doesn’t reinterpret rules mid-trade
Doesn’t revenge trade
Doesn’t move stops
Doesn’t second-guess
Doesn’t hesitate
It follows rules.
Every single time.
Key advantages of algorithmic trading
Processes multiple data points simultaneously
Executes instantly during fast price action
Trades 24/7 without fatigue
Applies identical risk rules every trade
Can be objectively tested and measured
There is no emotional deviation.
And that alone is a massive edge.
“But Humans Have Instinct” — The Big Myth
Instinct is just pattern recognition shaped by experience.
And patterns can be quantified.
If a trader can explain why they take a trade
that logic can be turned into rules.
And rules can be executed better by machines.
Win Rate Reality — How High Can It Really Go?
When I began researching existing algo traders:
Some had ~60% win rates with solid returns
Some reached 70–80%
That sparked a question I wrote down and circled:
“Is a 90% win rate even possible?”
So I tested.
Started with swing trading systems
Moved to intraday
Then scalping
Simplified rules instead of complexity
Tested only what truly mattered
After months of backtesting and refinement:
Achieving high-precision win rates of 80–90% across various asset classes, with drawdowns kept to an absolute minimum.
It proved something deeper:
Precision trading is possible when emotion is removed.
Important Reality Check (Especially for Experienced Traders)
High win rate does not automatically mean profitability.
What truly matters:
Risk-to-reward
Drawdowns
Expectancy
Consistency
Longevity over multiple market regimes
A system must survive:
Trending markets
Ranging markets
High volatility
Low volatility
Durability beats elegance.
Always.
The Real Future of Trading (2025–2030)
Here’s how I see it:
More traders will become system builders, not button clickers
Manual trading will shift toward monitoring & strategy design
AI will assist in:
Data filtering
Pattern discovery
Optimization
Hybrid approaches will dominate:
Machines execute
Humans supervise
Manual trading won’t disappear
but manual execution will.
My Personal Conclusion
Manual trading becomes validation
Algorithmic trading becomes execution
Humans decide what to trade
Systems decide how to trade
That’s evolution.
Final Thoughts — End of Year Message 🎄
As the year comes to an end, take time to reflect:
What worked
What didn’t
Where emotions interfered
Where rules could replace decisions
Trading is a long-term game.
The goal isn’t to trade more
it’s to trade better.
Merry Christmas to everyone!
May the next year bring clarity, discipline and growth — both in trading and in life.
The edge is shifting.
And those who adapt early will lead.
Would love to hear your thoughts:
Are you trading fully manual?
Hybrid approach?
Or already building systems?
_________________________________
💬 If you found this helpful, drop a like and comment!

Why Previous Resistance Can Act As A Support With ExampleThis video explains why a previous resistance level can later act as a support in market structure. The discussion focuses on how price behavior changes around key levels, how market participants react when resistance is broken, and why retests often occur at the same zone. Through this explanation, the concept is demonstrated using price action logic rather than predictions.
The purpose of this video is to help understand level-to-level price behavior and structural role reversal from an educational perspective, without providing any trading or investment recommendations.

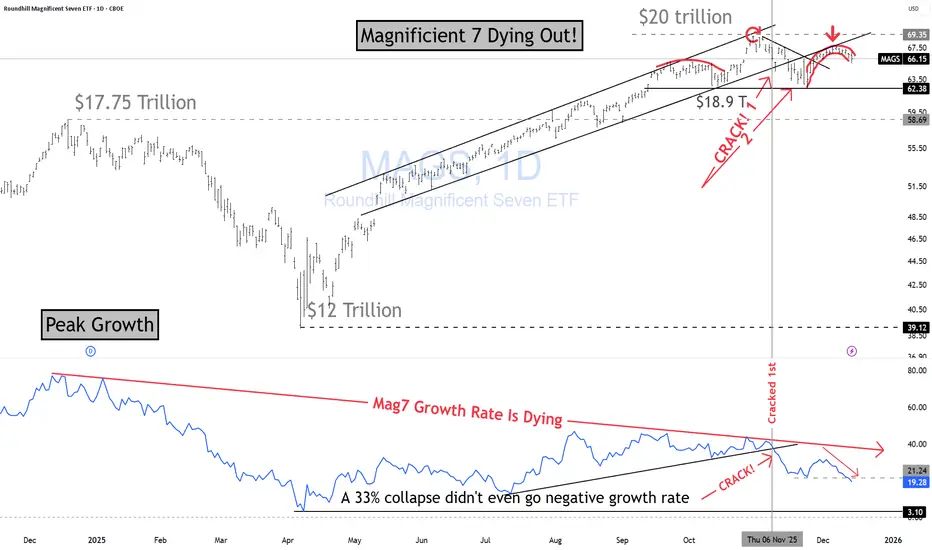
MAG7 Are Dying!Magnificent Seven Are Dying!
Here is why using my BKC method.
$20T in market cap. at $69.35
$18.9T Recent low
$17.7T Prior peak (Dec 24th)
$12T "Liberation Day" LOL! low (Apr 2025)
Growth Rate (Lower Panel)
• Growth rate peaked in Dec 2024 at ~85%.
• Since then, it has steadily deteriorated.
• Hit an all-time low of 3.1% around Liberation Day — even after a 33% drawdown, the rate never went negative! Imagine that! Where will price go when does go negative?
This is classic topping behavior: price making higher highs while growth momentum dies.
Price Structure (Upper Panel)
The Mag7 have been trading in a rising channel while the growth rate trends lower — a divergence setup.
Key structural points:
Head & Shoulders clearly formed at the top of the channel.
Red arrow circle marks the subtle but important failure: price couldn’t even touch the upper boundary of the channel → early weakness signal.
Crack #1: before the major breakdown.
Crack #2: Fri, Nov 7, 2025, confirmed again on Nov 13, 2025.
After that, price has been trading below the rising channel, confirming a structural shift.
Developing boomerang rejection: price returns to the channel underside and gets denied — classic failed-retest behavior.
Growth Rate Confirmation (Lower Panel)
The growth-rate panel confirms the sequence:
• The growth-rate crack showed up before the second price crack → momentum broke first, price followed.
This entire structure points to weakening upside momentum, failed retests, and a maturing top.
If you're still holding these names, ask yourself one thing:
What exactly are you waiting for?
• A 100% gain? That would require a $40T market cap.
• A 50% gain? That’s a $30T market cap.
Be honest with yourself: is that risk/reward realistic?
If you’re going to stay in this game, do it the right way.
Learn how to read a chart properly.
My goal is simple — to help you get better, think clearly, and avoid avoidable damage.
If you can’t see the massive head & shoulders, the major divergence, and the broken uptrend… I don’t know what to tell you.
All I can do is spark your curiosity and push you to do your own analysis.
THANK YOU for getting me to 5,000 followers! 🙏🔥
Let’s keep climbing.
If you enjoy the work:
👉 Drop a solid comment
Let’s push it to 6,000 and keep building a community grounded in truth, not hype.
Trading Seasonality: When the Calendar Matters More Than NewsTrading Seasonality: When the Calendar Matters More Than News
Markets move not just on news and macroeconomics. There are patterns that repeat year after year at the same time. Traders call this seasonality, and ignoring it is like trading blindfolded.
Seasonality works across all markets. Stocks, commodities, currencies, and even cryptocurrencies. The reasons vary: tax cycles, weather conditions, financial reporting, mass psychology. But the result is the same — predictable price movements in specific months.
January Effect: New Year, New Money
January often brings growth to stock markets. Especially for small-cap stocks.
The mechanics are simple. In December, investors lock in losses for tax optimization. They sell losing positions to write off losses. Selling pressure pushes prices down. In January, these same stocks get bought back. Money returns to the market, prices rise.
Statistics confirm the pattern. Since the 1950s, January shows positive returns more often than other months. The Russell 2000 index outperforms the S&P 500 by an average of 0.8% in January. Not a huge difference, but consistent.
There's a catch. The January effect is weakening. Too many people know about it. The market prices in the pattern early, spreading the movement across December and January. But it doesn't disappear completely.
Sell in May and Go Away
An old market saying. Sell in May, come back in September. Or October, depending on the version.
Summer months are traditionally weaker for stocks. From May to October, the average return of the US market is around 2%. From November to April — over 7%. Nearly four times higher.
There are several reasons. Trading volumes drop in summer. Traders take vacations, institutional investors reduce activity. Low liquidity amplifies volatility. The market gets nervous.
Plus psychology. Summer brings a relaxed mood. Less attention to portfolios, fewer purchases. Autumn brings business activity. Companies publish reports, investors return, money flows back.
The pattern doesn't work every year. There are exceptions. But over the past 70 years, the statistics are stubborn — winter months are more profitable than summer.
Santa Claus Rally
The last week of December often pleases the bulls. Prices rise without obvious reasons.
The effect is called the Santa Claus Rally. The US market shows growth during these days in 79% of cases since 1950. The average gain is small, about 1.3%, but stable.
There are many explanations. Pre-holiday optimism, low trading volumes, purchases from year-end bonuses. Institutional investors go on vacation, retail traders take the initiative. The mood is festive, no one wants to sell.
There's interesting statistics. If there's no Santa Claus rally, the next year often starts poorly. Traders perceive the absence of growth as a warning signal.
Commodities and Weather
Here seasonality works harder. Nature dictates the rules.
Grain crops depend on planting and harvest. Corn prices usually rise in spring, before planting. Uncertainty is high — what will the weather be like, how much will be planted. In summer, volatility peaks, any drought or flood moves prices. In autumn, after harvest, supply increases, prices fall.
Natural gas follows the temperature cycle. In winter, heating demand drives prices up. In summer, demand falls, gas storage fills, prices decline. August-September often give a local minimum. October-November — growth before the heating season.
Oil is more complex. But patterns exist here too. In summer, gasoline demand rises during vacation season and road trips. Oil prices usually strengthen in the second quarter. In autumn, after the summer peak, correction often follows.
Currency Market and Quarter-End
Forex is less seasonal than commodities or stocks. But patterns exist.
Quarter-end brings volatility. Companies repatriate profits, hedge funds close positions for reporting. Currency conversion volumes surge. The dollar often strengthens in the last days of March, June, September, and December.
January is interesting for the yen. Japanese companies start their new fiscal year, repatriate profits. Demand for yen grows, USD/JPY often declines.
Australian and New Zealand dollars are tied to commodities. Their seasonality mirrors commodity market patterns.
Cryptocurrencies: New Market, Old Patterns
The crypto market is young, but seasonality is already emerging.
November and December are often bullish for Bitcoin. Since 2013, these months show growth in 73% of cases. Average return is about 40% over two months.
September is traditionally weak. Over the past 10 years, Bitcoin fell in September 8 times. Average loss is about 6%.
Explanations vary. Tax cycles, quarterly closings of institutional funds, psychological anchors. The market is young, patterns may change. But statistics work for now.
Why Seasonality Works
Three main reasons.
First — institutional cycles. Reporting, taxes, bonuses, portfolio rebalancing. Everything is tied to the calendar. When billions move on schedule, prices follow the money.
Second — psychology. People think in cycles. New year, new goals. Summer, time to rest. Winter, time to take stock. These patterns influence trading decisions.
Third — self-fulfilling prophecy. When enough traders believe in seasonality, it starts working on its own. Everyone buys in December expecting a rally — the rally happens.
How to Use Seasonality
Seasonality is not a strategy, it's a filter.
You don't need to buy stocks just because January arrives. But if you have a long position, seasonal tailwind adds confidence. If you plan to open a short in December, seasonal statistics are against you — worth waiting or looking for another idea.
Seasonality works better on broad indices. ETFs on the S&P 500 or Russell 2000 follow patterns more reliably than individual stocks. A single company can shoot up or crash in any month. An index is more predictable.
Combine with technical analysis. If January is historically bullish but the chart shows a breakdown — trust the chart. Seasonality gives probability, not guarantee.
Account for changes. Patterns weaken when everyone knows about them. The January effect today isn't as bright as 30 years ago. Markets adapt, arbitrage narrows.
Seasonality Traps
The main mistake is relying only on the calendar.
2020 broke all seasonal patterns. The pandemic turned markets upside down, past statistics didn't work. Extreme events are stronger than seasonality.
Don't average. "On average, January grows by 2%" sounds good. But if 6 out of 10 years saw 8% growth and 4 years saw 10% decline, the average is useless. Look at median and frequency, not just average.
Commissions eat up the advantage. If a seasonal effect gives 1-2% profit and you pay 0.5% for entry and exit, little remains. Seasonal strategies work better for long-term investors.
Tools for Work
Historical data is the foundation. Without it, seasonality is just rumors.
Backtests show whether a pattern worked in the past. But past doesn't guarantee future. Markets change, structure changes.
Economic event calendars help understand the causes of seasonality. When quarterly reports are published, when dividends are paid, when tax periods close.
Many traders use indicators to track seasonal patterns or simply find it convenient to have historical data visualization right on the chart.

How to Find Support and Resistance Levels That Actually WorkHow to Find Support and Resistance Levels That Actually Work
Price never moves in a straight line. It bounces off invisible barriers, pauses, reverses. These barriers are called support and resistance levels.
Sounds simple. But traders often draw lines where they don't exist. Or miss truly strong zones. Let's figure out how to find levels where price reacts again and again.
What Support and Resistance Are
Imagine a ball thrown in a room. It hits the floor and ceiling. The floor is support, the ceiling is resistance.
Support works from below. When price falls to this zone, buyers activate. They consider the asset cheap and start buying. The decline slows or stops.
Resistance works from above. Price rises, reaches a certain height, and sellers wake up. Some lock in profits, others think the asset is overvalued. Growth slows down.
Why Levels Work at All
Thousands of traders look at the same chart. Many see the same reversal points in the past.
When price approaches this zone again, traders remember. Some place pending buy orders at support. Others prepare to sell at resistance. It becomes a self-fulfilling prophecy.
The more people noticed the level, the stronger it is.
Where to Look for Support and Resistance
Start with weekly or daily charts. Zoom out to see history for several months or years.
Look for places where price reversed multiple times. Not one bounce, but two-three-four. The more often price reacted to a level, the more reliable it is.
Look at round numbers. Trader psychology works so that levels like 100, 1000, 50 attract attention. Orders cluster around these marks.
Look for old highs and lows. A 2020 peak can become resistance in 2025. A crisis bottom turns into support a year later.
Drawing Levels Correctly
A level is not a thin line. It's a zone several points or percent wide.
Price rarely bounces from an exact mark. It can break through a level by a couple of points, collect stop-losses and return. Or stop a bit earlier.
Draw a horizontal line through candle bodies, not through wicks. Wicks show short-term emotional spikes. The candle body is where price closed. Where traders agreed on a compromise.
Don't clutter your chart with a hundred lines. Keep 3-5 most obvious levels. If you drew 20 lines, half of them don't work.
How to Check Level Strength
Count touches. Three bounces are more reliable than one. Five bounces - that's a powerful zone.
Look at volume. If there's lots of trading at a level, it confirms its significance. Large volume shows major players are active here.
Pay attention to time. A level that worked five years ago may lose strength. Fresh levels are usually stronger than old ones.
When a Level Breaks
A breakout happens when price closes beyond the level. Not just touched with a wick, but closed.
After a breakout, support becomes resistance. And vice versa. This is called polarity shift. Traders who bought at old support now sit in losses and wait for return to entry point to exit without losses.
A breakout must be confirmed. One candle beyond the level is not a breakout yet. Wait for the day to close, check volume, verify price didn't return.
False breakouts happen all the time. Major players deliberately knock out stops to collect liquidity.
Common Mistakes
Traders draw levels on small timeframes. A five-minute chart is full of noise. Levels from hourly or daily charts work better.
Traders ignore context. Support in an uptrend is stronger than in a downtrend. Resistance in a falling market breaks easier.
Traders enter exactly at the level. Better to wait for a bounce and confirmation. Price can break through a level by several points, knock out your stop, then reverse.
Diagonal Levels
Support and resistance aren't only horizontal. Trendlines work as dynamic levels.
In an uptrend, draw a line through lows. Price will bounce from this line upward.
In a downtrend, connect highs. The line becomes dynamic resistance.
Trendlines break just like horizontal levels. A trendline break often signals a trend reversal.
Combining with Other Tools
Levels don't work in isolation. Their strength grows when they coincide with other signals.
A level at a round number + cluster of past bounces + overbought zone on an oscillator - this is a powerful combination for finding reversals.
Traders often add technical indicators to their charts to help confirm price reaction at levels. This makes analysis more reliable and reduces false signals.
A Honest Annual Trading Review: Losses, Lessons, and 2026It’s December 11th, and there are maybe ten real trading days left in the year. At this point, there isn’t much more to do. The market won’t change my year, and I won’t change the market.
So it’s the right moment for an annual review.
I’m not the kind of trader who does weekly or even monthly “performance summaries” that don’t actually mean anything. For me, the only question that matters is this:
With how much did I start the year—and with how much am I ending it?
And after fourteen consecutive positive years, this is the year I end in the red.
So the question becomes: Why?
Why did I lose this year?
Before I dive into the lessons, the mistakes, and the changes I’ll implement starting in 2026, I need to give you some context—because no trading journey exists in isolation.
From 2002 to Today: A Long Road Filled With Luck, Lessons, and Reality
I began trading in 2002, investing in stocks right after the dot-com bubble. And things went incredibly well— not because I was smart, not because I understood markets, but because I had one of the greatest advantages a trader can have:
Perfect timing after a major market collapse.
In other words: pure luck.
In 2004 I discovered Forex, and by 2007 I had shifted entirely to Forex trading.
Until 2009, everything worked almost effortlessly. Every year was green. Even the 2008 crisis was profitable for me—I happened to hold some exceptional short positions.
And then came 2009.
The market didn’t humble me. My own arrogance did.
“ I can’t be wrong. I predicted the 2008 crash. I see the market clearly. I’ve got this.”
That mindset cost me 50% of everything I had accumulated.
That was my first real wake-up call.
It forced me to understand a truth that every long-term trader eventually learns, one way or another:
Humility in front of the market is not optional. It is survival.
That realization became the first major shift in how I approach trading.
What Changed After 2009: A Short Summary of a Long Transformation
As a brief summary of what shifted after 2009—beyond drastically reducing my appetite for risk—the biggest change was my transition toward pure price action and swing trading as the foundation of my approach.
Before that, the market felt almost binary, almost predictable.
- If NFP came in above expectations, the USD strengthened—and it stayed strong, not just for a few intraday spikes.
- When Hurricane Katrina hit, the narrative was straightforward: weak USD.
- Carry trade on JPY was the play all the way until 2008, so buy every substantial dip
- Breakouts were real breakouts—not whatever we have today, with fakeouts layered on fakeouts.
It was a different environment.
Cleaner. More directional. More narrative-driven.
And I traded it exactly as it was.
But markets evolve, and if you don’t evolve with them, you get left behind.
So I adapted.
I shifted from being a trader who reacted to news flows and macro momentum to a trader who reads structure, context, and price behavior first.
I shifted from chasing moves to waiting for high-probability rotations.
I shifted from assuming I understand the market to accepting that the market owes me nothing and can invalidate my ideas at any moment.
There’s much more to say about that transition—how painful it was, how long it took, and how it changed the way I think not just about trading, but about myself. But that’s a story for another time.
For now, it’s enough to say this:
2009 forced me to mature as a trader.
What followed shaped the next decade and a half.
It’s Not About Trump, and It’s Not About Excuses
This isn’t about Trump coming to the White House.
This isn’t about macro narratives or politics.
Yes, the markets did shift around that period — but this article is not about searching for excuses.
Because when it comes to Forex and XAUUSD, I managed the environment just fine.
I adjusted. I adapted. I traded often from instinct shaped by experience, and overall, that part of my trading year held up.
What dragged my year down — completely and undeniably — were my crypto investments.
I Was Never a “To-the-Moon” Guy — And Still Lost Substantially
I’ve never been a moonboy.
I’ve always been realistic with my targets: soft, achievable gains in the 30–50% range.
I never believed in the mythical “altcoin season.” I said repeatedly that it was wishful thinking and that the glory of past cycles would not repeat.
I didn’t gamble on new projects, I didn’t throw money at memes, and I didn’t YOLO into narratives.
And yet — I still lost.
So why?
Because I allocated too much capital, even within my fixed conservative approach.
Not because I believed in altcoin season, but because I believed we would see a meaningful recovery in the autumn.
I sized like someone expecting a bounce.
When the bounce didn’t come, instead, the flash crush from October, the weighting crushed the year( BTW, I wasn't leveraged)
Simple as that.
What I Will Change in 2026 (Crypto Edition)
The fix is straightforward:
- No more long-term investing in crypto, regardless of narrative.
- Maximum time exposure: a few days, maybe a few weeks.
- Stick strictly to major, established projects.
- Trade only what behaves cleanly from a technical perspective.
In other words, crypto will no longer be a long-term play in my portfolio.
It will be treated exactly as I should've be treated it from the beginning:
a short-term speculative instrument — nothing more, nothing less.
Forex and XAU/USD / XAG/USD: The Adjustments Going Into 2026
On the Forex and metals side, the changes are more nuanced — and in some ways, more strategic.
The core shift is this: shorter-term focus, smaller targets on Forex, larger targets on Gold, and a more active approach on Silver.
Here’s the breakdown:
1. Smaller Targets in Forex (EUR/USD as the Example)
In previous years, a 200–250 pip target on EUR/USD was perfectly reasonable.
The volatility allowed it, the market structure supported it, and the flow followed through.
But today, that kind of moves — consistently — is simply not realistic (look at it in the past 6 months).
So the adjustment is straightforward:
From 200–250 pip targets → to sub-100 pip targets.
It’s not about aiming lower.
It’s about aligning targets with actual market behavior, not nostalgia for a volatility regime that no longer exists.
2. Larger Targets on Gold (Because the Volatility Demands It)
Gold is the opposite story.
Volatility has exploded, rotations are massive, liquidity pockets run deep, and intraday swings are two or three times what they used to be.
So the shift here is:
From 300–400 → to 500+ being the new standard.
You can’t trade for 50-100 pips an instrument that behaves like a hurricane.
You adapt to its nature — or it eats you alive.
3. A More Active Approach on Silver (XAG/USD)
Silver has become a much more attractive instrument for me:
- Cleaner technical behavior
- Larger relative percentage moves
- Alignment with Gold, but with more exploitable inefficiencies
So 2026 will include more active trading on XAGUSD, treating it as a strategic middle ground between Forex and Gold volatility.
4. Integrating More ICT/SMC Into My Framework
Another important change is methodological:
I’ll incorporate more ICT/Smart Money Concepts into my analysis and execution.
Not as a religious shift — I’m not replacing classical TA and price action — but as an enhancement.
SMC concepts:
- map exceptionally well onto today’s liquidity-driven markets
- clarify sweeps, inducement, fakeouts
- explain displacement and rebalancing
- blend naturally with the price action approach I already use
In other words, this is not a stylistic change — it’s an upgrade of the internal framework.
Price action stays.
Classical TA stays.
But SMC becomes a bigger part of the decision-making process.
What This All Means for 2026: A Cleaner, Tighter, More Adapted System
When you put all these adjustments together — the crypto restructuring, the refined Forex targets, the larger Gold plays, the increased activity on Silver, and the deeper integration of SMC — the message becomes clear:
2026 won’t be about reinventing myself.
It will be about refining myself.
This year wasn’t a catastrophe ( around 15% loss overall)
It wasn’t an identity crisis.
It was a recalibration — a reminder that longevity in trading is not about perfection, but adaptation.
I didn’t lose because I became worse.
I lost because my allocation in one corner of my portfolio didn’t match the reality of the market.
And the only unforgivable mistake in trading is refusing to learn from the forgivable ones.
The markets haven’t betrayed me.
Crypto hasn’t betrayed me.
Forex and metals haven’t betrayed me.
The responsibility is mine — and so is the path forward.
In 2026, my system becomes:
- Simpler — fewer narratives, more structure.
- Tighter — smaller Forex targets.
- More opportunistic — bigger Gold moves, active Silver plays, short-term crypto speculation.
More aligned with how markets actually behave, not how past versions of me used to trade them.
And that’s the real conclusion of this year:
After almost 25 years in the markets, the only edge that never expires is the willingness to evolve.
Some years, you win because you’re right.
Some years, because you're lucky.
Some years you lose because you’re human.
But the trader who survives is the trader who adapts — again and again, without ego, without excuses.
And that’s exactly what 2026 will be about.
P.S:
And One More Thing… I Kind of Expected This After 14 Years
If I’m being completely honest, part of me always knew this moment would come.
You don’t go fourteen consecutive years without a losing one and expect the streak to last forever.
Statistically, psychologically, realistically — a red year was inevitable at some point.
So no, this wasn’t a shock.
It wasn’t a dramatic fall from grace.
It was simply… the year that was eventually going to arrive.
And that’s actually liberating!:)
Because once you accept that even long-term consistency includes the occasional step backward, you also see the bigger picture clearly:
This year doesn’t define me — the next one will.

All you need to know: WHEN and WHERE (short giude)Most traders lose money not because they’re wrong about direction… but because they’re wrong about WHEN and WHERE direction actually matters.
This is the missing piece in 99% of trading strategies.
Let’s break it down simply and clearly.
1. WHERE Matters First: Price Location Defines the Entire Trade
The market is not equally important at all prices.
There are only a few places where decisions actually have consequences:
🔹 1. Major Higher-Timeframe Levels
- Daily, Weekly and even monthly support, resistance, supply, demand.
- This is where big players care.
- Most BIG moves begin here.
🔹 2. Volatility Compression Zones
- Tight ranges, triangles, squeezes, etc
- When volatility compresses, potential energy builds.
- Breakouts here actually matter.
🔹 3. Break-and-Retest Structures
- The retest is where confirmation happens.
- It’s where weak hands exit and smart money enters.
🔹 4. Trend Extremes / Overextensions
- Parabolic rallies, vertical drops, stretched momentum.
- These locations create the most powerful reversals.
🔹 5. Liquidity Pools
- Above swing highs, below swing lows, around obvious trendlines.
- Institutions hunt these levels before moving the market.
If you’re not trading at one of these five locations, you are trading noise.
2. WHEN Matters Even More: Timing Is the Difference Between Chop and Trend
Even the best location is useless if the moment isn’t right.
Here are the only timing conditions that give your trade real probability:
🔸 1. Volatility Expansion After Compression
- Wait for candles to elongate, volume to increase, and the range to open up.
- Before expansion: fakeouts.
- After expansion: real moves.
🔸 2. Liquidity Sweeps
- The market clears stops → fills institutional orders → reveals true direction.
- You don’t act before the sweep; you act after it confirms.
🔸 3. Structural Confirmation
- Higher low in an uptrend.
- Lower high in a downtrend.
- Break → Retest → Continuation.
- Without structure, timing is random.
🔸 4. Active Market Sessions
- London open, NY open, session overlaps, major news events.
- The same setup at 03:00 means nothing — the same setup at NY open is a trade.
🔸 5. Multi-Timeframe Momentum Alignment
- HTF gives the bias
- MTF gives the setup
- LTF gives the entry
- When timeframes align, timing becomes obvious.
3. WHERE + WHEN = Non-Random Trades
This is what professional trading really is:
- WHERE = the place price must react
- WHEN = the moment price has conviction
Combine both and you no longer predict — you simply respond to high-probability situations.
- This is how you avoid chop.
- This is how you avoid forcing trades.
- This is how you become consistent.
4. The Psychological Shift
Retail traders think:
“I must forecast the next move.”
Professionals think:
“I only act at key locations, when timing conditions align.”
This removes:
- FOMO
- guessing
- impulsive entries
- emotional trading
You no longer chase the market.
You wait for the market to come to your WHERE and your WHEN.
That’s the edge.
5. Final Thoughts
You don’t need to predict the market.
You don’t even need to know what happens next.
You only need to know:
- WHERE the market becomes important
- WHEN a move becomes meaningful
Master these two, and everything else falls into place.
P.S.
I know this is easier said than done. Even after many years in the market, with a solid sense of direction and plenty of sniper-level entries, my WHEN is not always perfect either. That’s the part none of us ever truly “master” — we only learn to manage it better.
So take all of this as a blueprint, not a declaration that I execute flawlessly. I’m a professional, yes — but I’m also in a continuous process of adapting, refining, and learning from every new shift the market throws at us.
Experience helps, but the market keeps evolving, and so do I. Just like anyone else should.

HOW TO WATCHLIST ADVANCE VIEW IN TRADINGVIEWThis video explains how to watchlist advanced view in Trading-View. It shows where the watchlist advanced view option is available and how the advanced view works inside the watchlist. The focus is only on understanding how to watchlist advanced view clearly within the Trading-View interface.

Radio Yerevan: Is Crypto the Biggest Wealth Transfer in History?Answer: Yes. But not in the direction people hope.
In the last decade, crypto marketing has repeated one grand promise:
“This is the biggest wealth transfer in human history!”
And in classic Radio Yerevan fashion, this statement is both true and misleading.
Yes — a historic wealth transfer took place.
No — it did not empower the average investor.
Instead, it efficiently moved wealth from retail… back to the very entities retail thought it was escaping from.
Let’s break it down: structured, clear, and with just the right amount of irony.
1. The Myth: A Decentralized Financial Uprising
The early crypto narrative was simple and beautiful:
- The people would reclaim financial independence.
- The system would decentralize power.
- Wealth would flow from institutions to individuals.
The idea was inspiring — almost revolutionary.
Reality check: Revolutions are expensive.
And someone has to pay the bill.
In crypto’s case, the average investor volunteered enthusiastically.
2. The Mechanism: How the Transfer Actually Happened
To call crypto a wealth transfer is not an exaggeration.
The numbers speak loudly:
Total market cap peaked above $3+ trillion.
Most of the profit was extracted by:
- VCs who bought early,
- teams with massive token allocations,
- exchanges capturing fees on every trade,
- and whales who mastered liquidity cycles.
Retail investors, meanwhile, contributed:
- capital,
- liquidity,
- hope,
- hype
- and a remarkable tolerance for drawdowns.
It was, in essence, the perfect economic loop:
money flowed from millions → to a concentrated few → exactly like in traditional finance, only faster and with better memes.
3. The Irony: A Centralized Outcome From a Decentralized Dream
Here lies the great contradiction:
Crypto promised decentralization. Tokenomics delivered centralization.
When 5 wallets hold 60% of a token’s supply, you don’t need conspiracy theories — you need a calculator.
The “revolution” looked more like:
- Decentralized marketing
- Centralized ownership
- Retail-funded exits
- And a financial system where “freedom” was defined by unlock schedules and vesting cliffs
But packaged correctly, even a dump can look like innovation.
4. Why Retail Was Doomed From the Start
Not because people are unintelligent, but because:
- No one reads tokenomics.
- Unlock calendars sound boring.
- Supply distribution charts kill the romance.
- Liquidity mechanics are not as exciting as „next 100x gem”.
- And hype travels faster than math.
In a speculative market, psychology beats fundamentals until the moment fundamentals matter again — usually when it's too late.
5. The Real Wealth Transfer: From “Us” to “Them”
The slogan said:
“Crypto will redistribute wealth to the people!”
The chart said:
“Thank you for your liquidity, dear people.”
The actual transfer looked like this:
- Retail bought the story.
- Institutions created the tokens.
- Retail bought the bags.
- Institutions sold the bags.
- Retail called it a correction.
- Institutions called it a cycle.
Everyone had a term for it.
Only one group had consistent profits from it.
6. So, Was It the Biggest Wealth Transfer in History?
Yes.
But not because it made the average investor rich.
It was the biggest because:
- no previous financial system mobilized so many people
- so quickly
- with so little due diligence
- to transfer so much capital
- to so few beneficiaries
- under the banner of liberation.
It wasn’t a scam.
It wasn’t a conspiracy.
It was simply financial physics meeting human psychology.
7. The Lesson: Crypto Isn’t the Problem — Expectations Are
- Blockchain remains a brilliant invention.
- Tokenization has real use cases.
- DeFi is a groundbreaking paradigm.
- And so on
The issue wasn’t the technology.
It was the narrative that convinced people that buying a token was equivalent to buying financial freedom.
Real freedom comes from:
- understanding liquidity,
- reading tokenomics,
- respecting supply dynamics,
- and asking the only question that matters:
“If I’m buying… who is selling?”
In markets — especially crypto — this question is worth more than any airdrop.
8. Final Radio Yerevan Clarification
Question: Will the next crypto cycle finally deliver the wealth transfer to the masses?
Answer: In principle, yes.
In practice… only if the masses stop donating liquidity.

CRYPTOCHECK Throwback - BEST POSTS 2025New Year loading 🥳🥂
Setting up your trading technique and sticking to it
The Dunning Kruger Effect
How to trade Bollinger Bands
How to Dollar-Cost-Average
Spotting reliable Bottom Patterns
These ideas may help you improve your strategy and become a more profitable trader. Happy Trading!

Decentralized-Trade Bitcoin extended cycle revisionINDEX:BTCUSD
Will it age like milk or wine?
...
Extended Cycle Theory Projection
Cycle 4 Top March 2026
Cycle 4 Next Bottom April 2028
Cycle 5 Top (estimated) ~2034–2035
Cycle 5 Next Bottom ~2036
The math behind it will be revealed elsewhere.
Do not trade based on the idea.
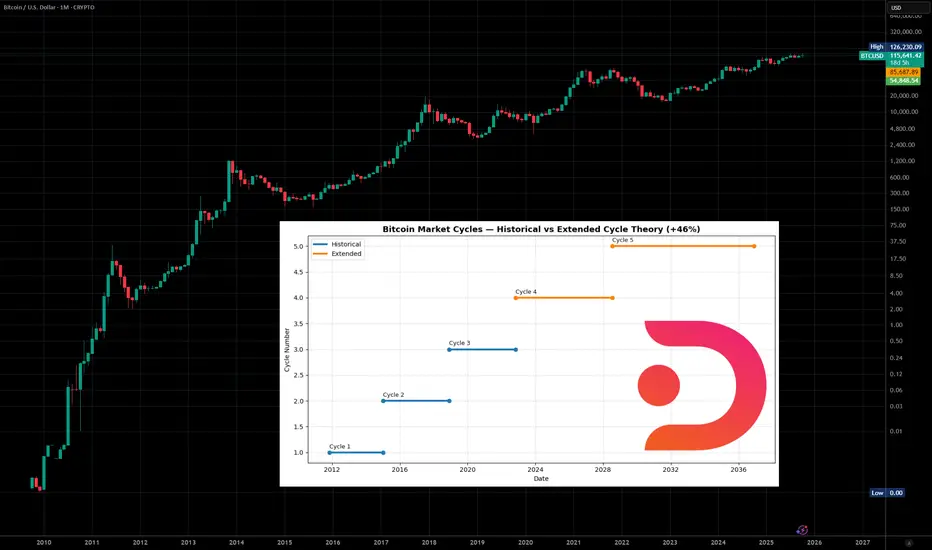
Crypto "Investors" Forget Too Quickly- Part OneI’ve never been much of a gambler.
I don’t chase roulette, I don’t play blackjack regularly, and casinos have never been my second home. But on the rare occasions when I did go—usually dragged by friends who actually like gambling—something strange happened to me.
I ended up losing considerable amounts of money.
- Not because I thought I’d win.
- Not because I had a “system.”
- Not because I felt lucky.
It was the environment:
- the lights
- the noise
- the adrenaline
- the drinks
- the atmosphere that hijacks logic
And the next morning, the internal monologue was always the same:
“See, idiot? Again you drank one too many and managed to lose a Hawaii vacation.”
- The regret is real.
- The pain is real.
- The stupidity is, HOHO, WAY TOO REAL.
But the disturbing part?
Even though I don’t gamble… even though I don’t chase casinos… the environment alone was enough to override my reasoning.
And if that can happen to someone who isn’t a gambler, imagine what happens to someone who willingly walks into a casino every day —because that’s exactly what crypto "investors" do.
Crypto markets are casinos with better screens, countless memes, screaming influencers and worse odds.
And "investors" forget far too quickly.
Crypto "Investors" Forget Too Quickly —
Just Like Casino Gamblers Who Keep Coming Back for More
Crypto "investors" have one of the shortest memories in financial markets.
- Not because they are stupid.
- Not because they don’t care.
- But because the entire crypto environment is engineered to erase pain and preserve hope — exactly like a casino.
Put a gambler in a casino, and he forgets last night’s disaster the moment he sees the lights again.
This comparison is not metaphorical.
It is psychologically identical.
Let’s break it down properly.
1. The Human Brain Is Not Built for Crypto — or Casinos
Both environments share the same psychological architecture:
- bright colors
- fast feedback loops
- uncertainty
- intermittent rewards
- emotional highs
- catastrophic lows
- near-wins that feel like wins
- an illusion of control
Neuroscience calls this:
Intermittent Reinforcement
The most addictive reward structure ever discovered.
Slot machines are built on it.
Most crypto charts mimic it.
Volatility fuels it.
When rewards arrive unpredictably:
- dopamine spikes
- memory of losses fades
- the brain overvalues the next opportunity
- the pain of the past gets overwritten
- the hope of future reward dominates
This is why gamblers return.
And this is why crypto "investors" buy the same s..ts.
2. The Crypto Cycle Erases Memory by Design
After every bull run for an obscure coin:
- big money is made (by insiders)
- screenshots are posted
- what if you have bought with 100usd appear
- influencers multiply
- everyone becomes a “trading wizard”
- Twitter becomes an ego playground
- greed replaces rationality
After every strong bear move:
- portfolios crash 90-95%
- people swear “never again”
- Telegram groups die
- influencers delete posts
- conviction collapses
- despair dominates
But then…
When a new "narrative" appears:
- Everything resets.
- Crypto "investors" forget instantly.
No other financial market resets memory this fast.
- In stocks, a crash leaves scars.
- In forex, blown accounts create caution.
- In real estate, downturns shape behavior for years.
But in crypto?
The new "narative"/ the new hyped coin erases the old one like chalk on a board.
3. The TrumpCoin & MelaniaCoin Episode (Just an Example):
The Best Proof That Crypto Traders Forget Too Quickly
TrumpCoin and MelaniaCoin didn’t have real value.
They weren’t serious projects.
They weren’t even clever memes.
They were psychological traps built on celebrity gravity.
People bought because:
- the names were big
- the media amplified the narrative
- the symbolism felt powerful
- the story was exciting
And the wipeout was brutal.
But the key point is: traders forgot instantly.
Within weeks, they were already hunting for:
- “the next TrumpCoin”
- “the next politician meme”
- “the next celebrity pump”
- “the next token with a ‘name’ behind it”
- "the next 100x"
"the next, the next, the next" and is always the same
- Not the next valuable project.
- Not the next real innovation.
- Not the next sustainable investment.
No.
The next symbol.
This is not market behavior.
This is casino relapse psychology.
4. These Coins Didn’t Fail Because They Were Memes —They Failed Because They Were Nothing
TrumpCoin & MelaniaCoin ( Again, is just an example) pretended to matter because the names mattered.
- Traders didn’t buy utility.
- They bought a fantasy.
The same way gamblers believe a “lucky table” changes their odds.
In crypto, people believe:
- the celebrity matters
- the narrative matters
- the hype matters
Reality doesn’t.
5. Why Crypto "Investors" Don’t Learn: Because They Don’t Remember
Crypto "investors" are not stupid.
They are forgetful.
They forget the months of pain and remember only the few happy moments.
They forget:
- drawdowns
- stress
- panic
- illusions
- scams
- broken promises
- influencers lies
They remember:
- one good run
- one moonshot
- one dream
This is why most altcoins and memes thrive.
Not because they deserve to.
But because forgetting resets demand every time.
6. The Industry Is Designed to Exploit This Amnesia
If traders remembered:
- Luna
- FTX
- SafeMoon
- ICO (2017) crashes
- NFT (2021) collapses
- Meme mania recently
…the most of the altcoin sector would evaporate overnight.
But "investors" forget —so altcoins with a "nice" story resurrect.
Like slot machines resetting after every gambler walks away.
7. The Cure: You Don’t Need Better Tools — You Need a Better Memory
The greatest edge in crypto is not fancy indicators, bots to be the first in, or whatever invention comes next.
It’s remembering.
Remember:
- why you lost
- how you lost
- which narrative fooled you
- how the market humiliated you
- what the casino environment does to your brain
- how celebrity tokens wiped people out
Crypto trading requires memory, not optimism.
Conclusion:
Crypto "Investors" Forget Too Quickly —And That’s Why They Keep Losing
Crypto "investors" don’t think like REAL investors.
They think like gamblers:
- emotional
- hopeful
- impulsive
- forgetful
convinced “this time will be different”
The latest meme mania proved this perfectly.
Crypto is not dangerous because it is volatile.
Crypto is dangerous because it erases your memory.
The "investor" who forgets loses.
The "investor" who remembers wins.
Because in crypto:
The moment you stop forgetting is the moment you finally start winning.
P.S. (A Necessary Clarification, Said Gently — and Honestly)
Throughout this article I used the word “investors” in quotation marks — and it wasn’t an accident.
Most of the people who call themselves investors in crypto are not actually investing.
They are speculating, chasing, hoping, and gambling on meme coins and obscure altcoins purely because “they have 100x potential.”
Let’s be honest:
- buying a token named after a frog
- or a coin launched yesterday by anonymous developers
- or a “next big narrative” pump with zero product
- or a celebrity meme coin
- or something that exists only on Twitter…is not investing.
It’s gambling dressed in nice vocabulary.
And that’s okay — as long as you know what it is.
Also, to be clear:
When I critique “altcoins,” I am not talking about all of them.
There are real infrastructure projects, real protocols, real technology, and real builders out there.
But let’s not pretend:
90% of altcoins exist for hype, for extraction, for speculation, and for the dopamine of “maybe this one will moon.”
I’m talking about those coins — the ones that behave like slot machines and survive only because traders forget too quickly.
If this article made you uncomfortable, good.
Sometimes the truth has to sting before it can help.
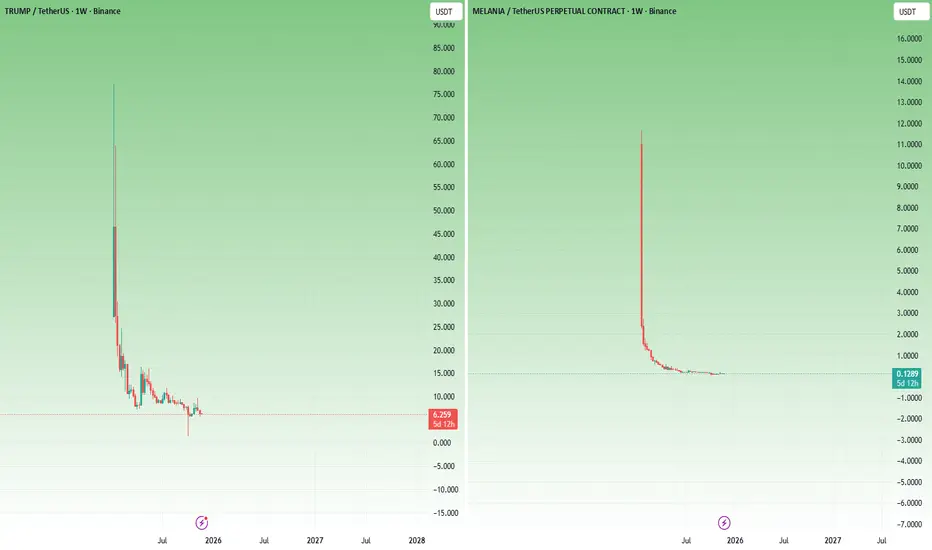
Candlestick Patterns That Actually MatterTraders often approach candlestick patterns by memorizing long lists instead of understanding the behaviour behind them. Crypto moves aggressively, hunts liquidity, and punishes textbook interpretations unless they occur at meaningful locations. The goal is not pattern collection. The goal is to recognize the few formations that consistently reveal intention when aligned with structure, liquidity, and context.
Engulfing Candles, Displacement and Control
What it shows: a clear shift where one side fully absorbs the other. This is participation, not random volatility.
When it matters: after impulses, at support or resistance, during liquidity sweeps, or when confirming a trend shift.
Why it’s valuable: engulfing candles often provide the first structural evidence that control has changed hands.
Rejection Wicks, Liquidity Taken, Pressure Reverses
What it shows: price tapped a high or low, triggered stops, and immediately met stronger opposing orders. This is how sweeps appear on a single candle.
When it matters: at equal highs/lows, session extremes, failed breakouts, and major swing points.
Why it’s valuable: wicks expose trapped traders and reveal where true supply or demand sits. They are early indicators of shifting intent.
Inside and Outside Bars, Compression and Expansion
Inside Bar: compression, tighter ranges, and reduced volatility ahead of expansion.
Outside Bar: immediate expansion where one side overwhelms both directions.
When they matter: at key levels before breakouts, during corrective legs, at consolidation boundaries, and after liquidity events.
Why they’re valuable: inside bars show preparation; outside bars show decision.
Treat these signals as behavioural information. Their value increases when combined with higher timeframe structure, liquidity mapping, momentum, volume, and session context.
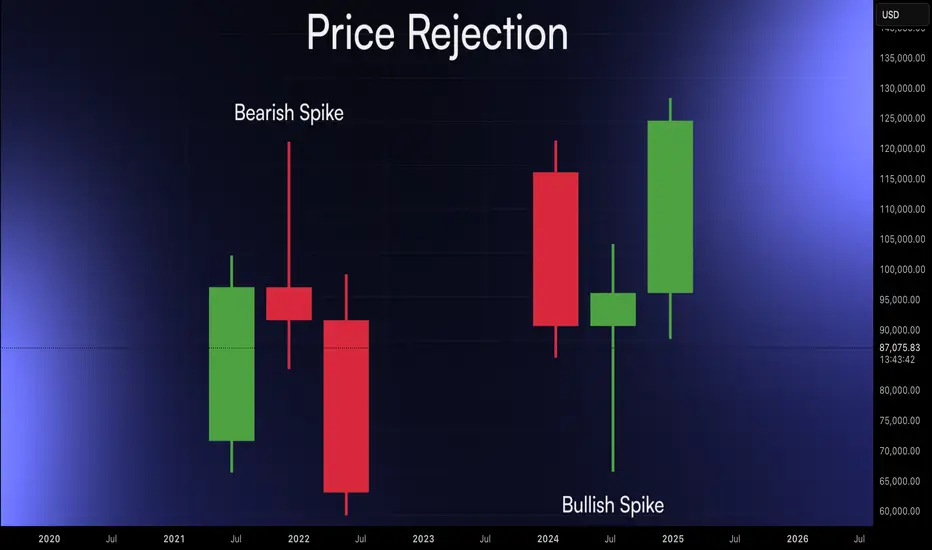
Haunt training levelsHello friends
We are back with another tutorial.
This time we are going to tell you a more advanced strategy.
Well, when a trend or structure forms, it doesn't matter whether it's bullish or bearish. In our example, it's an bullish structure. You should be careful that every structure eventually ends, and this ending has a series of signs. In this strategy, we'll teach you what those signs are and how to enter a trade and make a profit.
Well, as you can see, the buyers raised the price, and considering the higher ceilings and floors, we can tell that our structure is bullish and the buyers' hand is strong...
Here we are waiting for buyers to weaken, which is the important moment when, after hitting a ceiling, sellers push the price down, and you think that the structure has changed and enter a sell trade, placing your stop loss above the spike and waiting for the structure to change.
This is where the buyers come in and make their final move, hunting the previous high and your stop loss is triggered.
What to do now?
So, as we said, when you see the weakness of the structure, draw a resistance level like the level we have specified for you.
Now the price is falling from the ceiling and we are just waiting and when the price reaches the level again and cannot stabilize above our level and does not have the strength, so to speak, our level is hunted and the price falls, we do not expect to be able to enter the trade right there Because we need more confirmations.
So the price comes back and reaches our level, which we call a pullback. At this point, we must be very careful that the price weakens before our level or weakens at the level and cannot stabilize higher prices. This is where we enter the trade and our stop loss is placed exactly behind the hunted ceiling.
The target can also be the first price bottom and then, if the sellers are strong, lower bottoms...
Be careful that the win rate of this strategy is 70.
Be sure to observe risk and capital management.
*Trade safely with us*
