BTCUSD 15 min Elliott Wave AnalysisThe 15 min BTC chart has currently completed ABC retracement structure with B as triangle. Next is C wave up.
Elliottwaveanalyis

Novo Nordisk: New Long-term Entry Area!Novo Nordisk's stock has continued to rally since our last update. We've taken a deeper dive into our count and have identified a blue long-term entry area.
The primary scenario suggests that the price is currently working through a turquoise upward structure, potentially leading up to the high of the major wave into the red short target zone between €70.63 and €84.59.
We've further segmented the subordinate turquoise wave 3 into a magenta structure, with wave expected to soon establish its low in the aforementioned blue entry area before moving higher.
This entry zone offers opportunities for long entries. We plan a long-term purchase for our investment portfolio and have shared exact coordinates with our Subscribers.
In the red target zone, NOV is likely to pivot downward from the top of the green wave to begin the final descent stage within the broader correction: The green wave aims to reach into the green target zone between €29.63 and €15.65 to complete the beige wave II.
A sustainable upward trend is expected to start following this. Hence, the green zone also offers opportunities for long entries. Additionally, there’s a slight 34% chance that prices might skip the rise to the red zone and dive straight into the green zone.

Argenta Silver Corp Daily OutlookI have taken an initial position on TSXV:AGAG
I'm looking for price to continue higher following a small retracement in wave (ii) in orange. It's quite possible the retracement could develop further in time and price but irrespective based on this count, I consider this a worthwhile initial entry.
A potential target zone for this next leg higher is the green zone. After which we could see some consolidation in red 2. although it would be a little frustrating to hold the position, assuming red 2 retraces towards my entry, i think it will be short term pain for longer term upside as red wave 3 unfolds.
More comments on the chart

ETH/USD: A global bearish zigzag on Ethereum1. The main idea is a global zigzag {a}-{b}-{c} to the downside.
2. Wave {a} can be counted as a double zigzag WXY, but I don’t want to do that.
3. However, I still want to break this move down into a leading diagonal triangle (LDT), which is what I’m showing on the chart.
4. Locally, there is no clear strength, and the price action looks corrective.
5. So it’s crucial to know whether wave {b} is complete, as this move may develop into a more complex correction.
6. If wave {b} is complete, we may already be seeing the development of wave (iii) of {c} on the local scale.
7. The downside move could extend for a minimum of two more months toward the lower channel boundary.
8. If wave {b} becomes more complex, we may still see its full development into another corrective pattern, followed by the advance of wave {c}.
9. The basic targets of the decline are the 0.618 and 1 Fibonacci levels. For now, I don’t want to include the 1.618 Fibonacci level on the chart.
10. There’s a strong chance that in the future the price could reach the range between $2,033 and $1,141.

GBP/USD Forming Potential Triangle – Short Setup on BreakoutGBP/USD appears to be developing a contracting triangle for wave iv, following a sharp drop from the (b) high. If this triangle completes and breaks to the downside, we could see a final wave v move toward key Fibonacci targets.
This structure supports the broader flat correction count, with Wave C potentially nearing completion.
Trade Setup (Conditional):
Entry: Short on confirmed triangle breakout (close below 1.3400 zone)
Stop: Above triangle high (~1.3455)
Target 1: 1.3350
Technical Confluence:
Wave v of (c) expected following triangle
161.8% C vs A = 1.3342 (confluence for Target 1)
61.8% Wave 5 vs 1+3 = 1.3355 - 1.3335
Volatility compression within triangle suggests breakout soon
⚠️ No trade until breakout confirms. If price breaks upward instead, triangle may be invalidated or part of a complex correction.

XAU/USD Facing Decision Time – Volatility AheadThe Gold chart shows that the price is trading near a strong resistance zone after completing several impulsive waves inside an upward channel. The structure suggests Gold is likely finishing a Wave (3) or Wave (5) near the top, where selling pressure usually appears. The recent sideways-to-down movement looks like a developing Wave (4) correction, which could lead to a deeper pullback before the next big move. If the price fails to break and hold above the resistance zone, Gold may continue lower toward the lower channel support. However, if buyers push the price higher and break above the resistance cleanly, one more upside leg could form before a larger correction. Overall, the chart signals short-term weakness inside a bigger bullish structure, so caution is needed near the highs.
Stay tuned!
@Money_Dictators
Thank you :)

XAUUSD H-4 PROJECTIONKindly remember, Elliott Wave is highly subjective, i will post if there's a new update on my perspective. Trade safe, Everyone! Cheers.

NZDCAD– Bullish “Market is forming a bullish ABC structure. Wave C may continue upward if support holds.”

XAGUSD Silver Outlook (Count 2)Here is my primary view on FX_IDC:XAGUSD . This is an updated view taking in to account the monthly time frame chart which i have recently shared, i may work on publishing the monthly idea soon.
In this outlook silver is currently close to working through a series of wave 4's and 5's. As I mention on the chart if the projected levels change but the sequence is accurate then I’ll be happy with that.
I have added some more comments in the chart regarding the Elliott wave guideline of alternation, which we should consider when forecasting future price action.
In line with the monthly chart, this outlook now shows the $87 target, and the analysis behind it. I have changed the wave degrees to reflect this current impulsive rally being in the cyan primary degree sitting under the purple cycle degree wave III.
More comments on the chart.

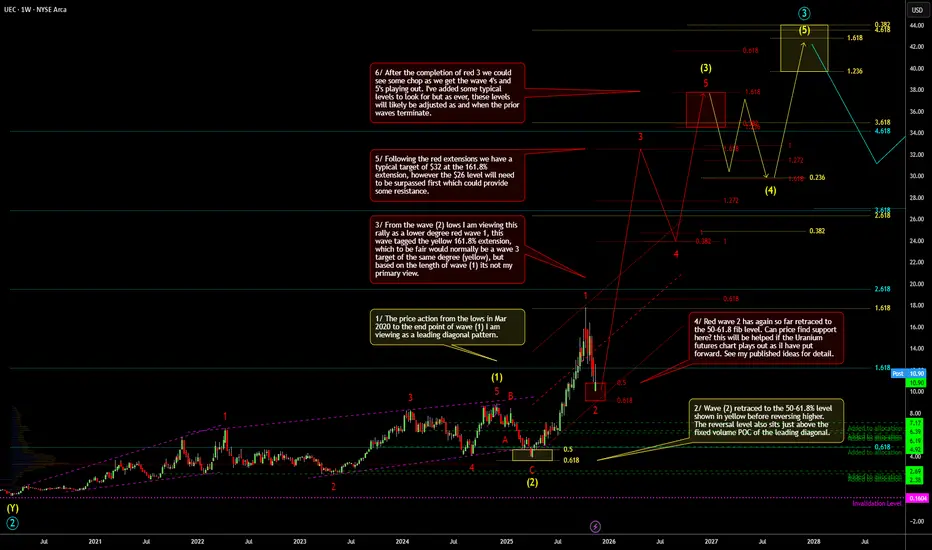
Uranium Energy Corp Weekly Outlook (Count 1)Here is my weekly outlook on AMEX:UEC .
UEC is one of my bigger holdings, I've added at various times as shown on the chart (see green dashed lines).
In this outlook i am viewing the price action from the lows in Mar 2020 to the end point of wave (1) as a leading diagonal pattern. After that we have seen wave (2) and another wave 1 and 2 in the red degree (red wave 2 may not be complete yet).
Are we next going to see a breakout in red wave 3? the case for this will be helped if the COMEX:UX2! Uranium Futures chart plays out as predicted along with LSE:YCA & TSX:U.UN ...see my linked charts
More comments on the chart!
Note: My analysis is more focused on price levels as opposed to wave duration, so bear that in mind if you see a particular price level at a certain date in the future and think i'm rigid on both price and time.
DXY (Dollar Index) Daily Outlook (Count 3)This is a daily timeframe outlook of the TVC:DXY . This is in alignment with my previously posted weekly outlook and is a slight alteration of the last posted Daily outlook, both shown in the related publications area.
In this update I am looking for the DXY to continue lower potentially in an ending diagonal pattern towards the red and yellow target zones at around 93.8. As mentioned on the chart, if we see price decline in a traditional impulse with no overlap between wave 4 and 1 then the measured move target will be surpassed.
I have a short trade shown on the DXY chart but this is only indicative of the move I expect, I am instead long FX:EURUSD which moves inversely to the DXY. More comments on the chart.

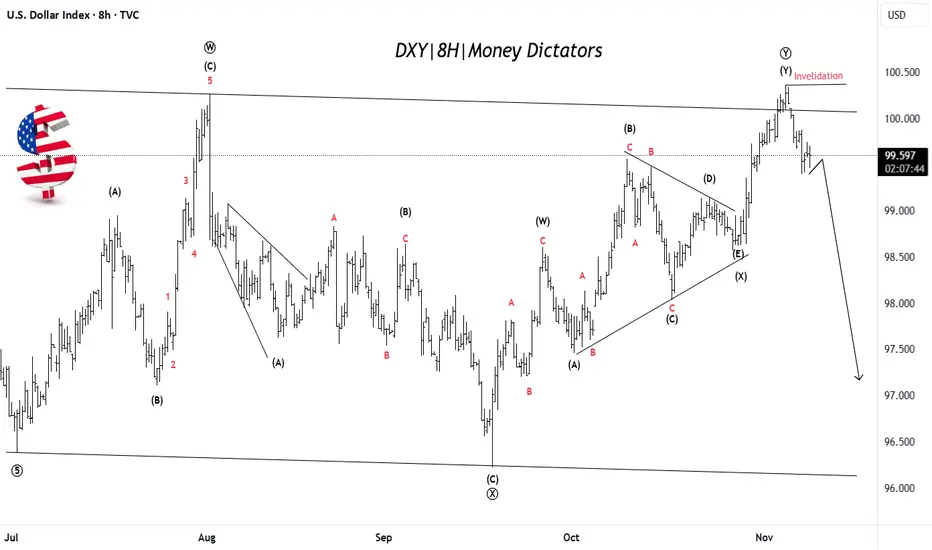
US Dollar Weakness Likely After Final Push UpDXY has completed a complex corrective W–X–Y pattern, with the final leg (Y) recently topping near the 100.50 zone. Price has failed to break above the invalidation level, suggesting the uptrend is losing strength. This signals that the dollar may have finished its corrective phase and could now start a fresh bearish wave targeting lower zones near 97–98. The overall structure indicates that momentum is shifting from bullish to bearish. In simple terms: rally is likely over → downside move toward new lows expected next.
Stay tuned!
@Money_Dictators
Thank you :)
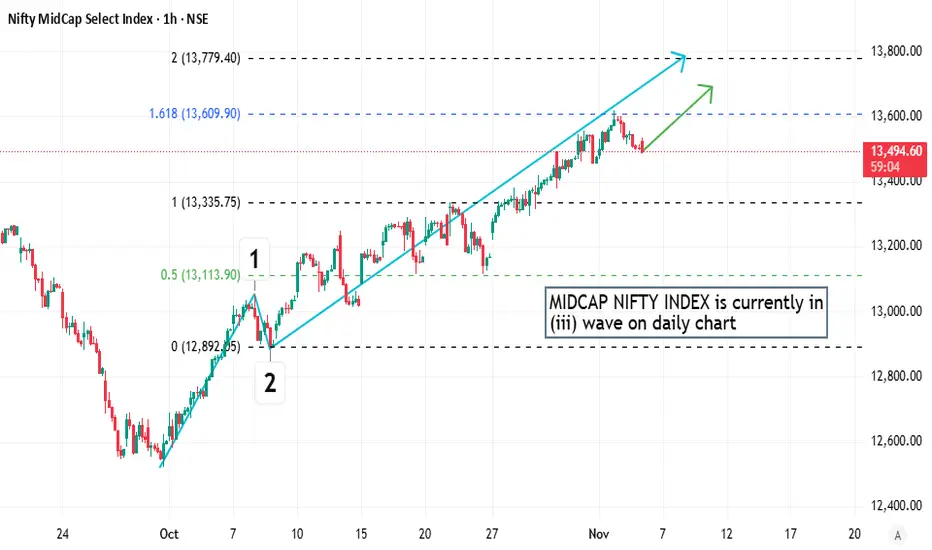
Elliot Wave Analysis of MIDCAP NIFTYThe chart is currently doing (iii) up sub-wave on daily chart and this up wave is underway and more to go. After that, a retracement down should follow in sub-wave (iv).
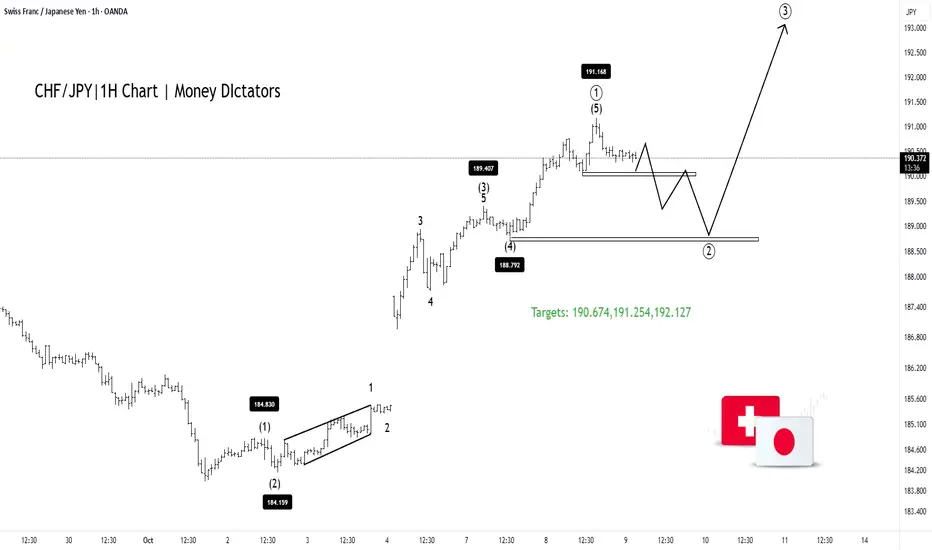
CHF/JPY Builds Momentum for Next Wave HigherThe CHF/JPY 1-hour chart shows a completed wave (1) near the 191.17 level, confirming a strong bullish impulse after a previous decline. The pair is now entering a wave (2) corrective phase, which is likely to retrace toward the 188.7–189.0 support zone before resuming the next upward move. This pullback appears to be a healthy correction within the broader uptrend. Once the correction is complete, wave (3) is expected to begin, targeting levels above 193.0 . The overall market structure remains bullish, suggesting that any short-term dips could offer potential buying opportunities for traders waiting for the next impulsive rally
Stay tuned
@Money_Dictators
Thank you.
NAS100 Forecast: A Fresh Bullish Impulse Toward New HighsThe NAS100 index is currently moving within a classic Elliott Wave structure. After completing wave (3), the market entered a correction phase that formed wave (4). This correction appears to have ended in the highlighted support zone, where buyers stepped in strongly. The five-wave pattern before wave (4) confirms a solid bullish trend. Now, the index seems to be preparing for the final upward move wave (5). This wave often represents the last push of a rally before a larger correction starts. As long as the price stays above the recent support near 24,400 , the next targets could be seen around 25,200–25,600 . In simple terms, the market is expected to continue its uptrend after a short pullback, following the typical Elliott Wave sequence of five upward waves and three corrective ones.

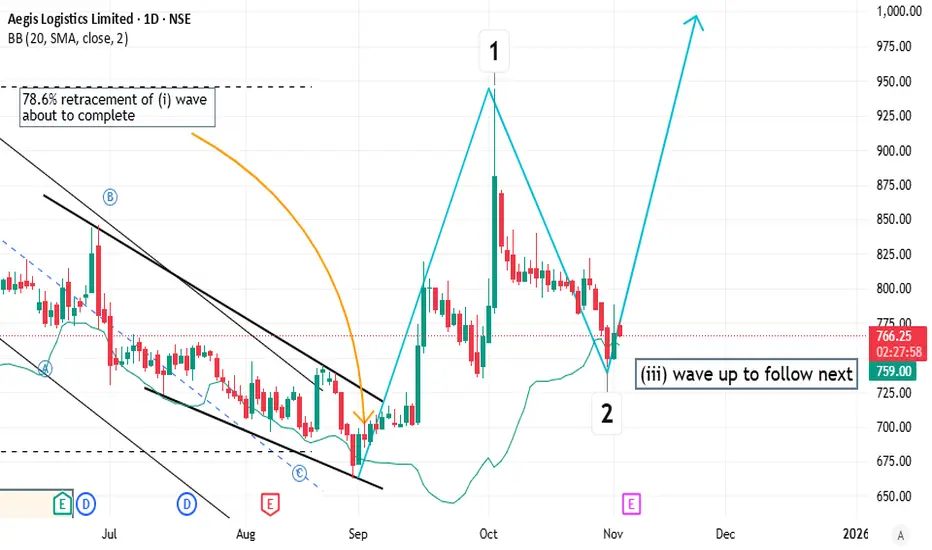
Elliott Wave Analysis of AEGISLOGIn line with previous analysis,
(ii) subwave retracement is done
(iii) wave up should follow next
Elliott Wave Analysis of CNXFMXGFMCG index is well underway its 3rd wave
Currently in (ii) of 3rd
(iii) up swiftly should follow next

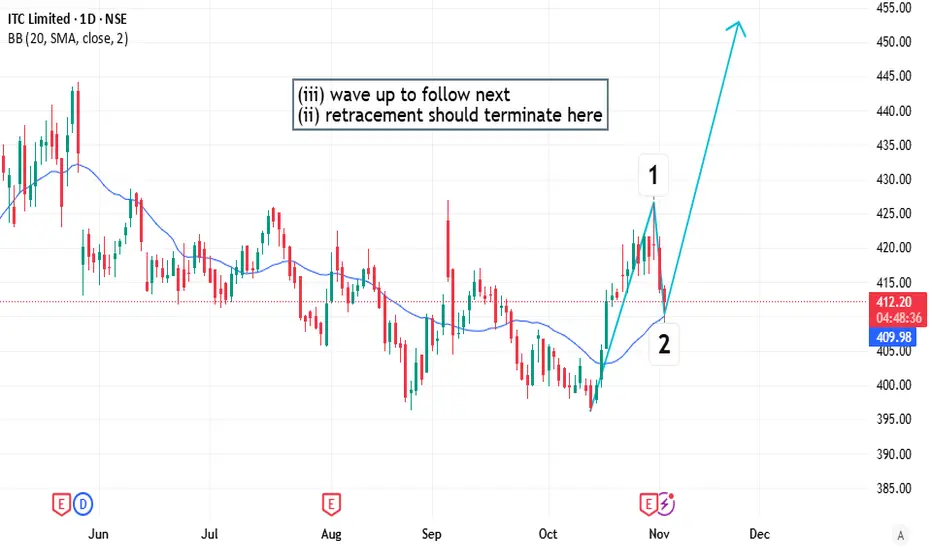
Elliott Wave Analysis of ITCITC and FMCG index will start their (iii) - 3rd wave next and (ii) wave should terminate here.
(ii) wave in ITC had a flat corrective structure, that means (iii) wave might be extended.
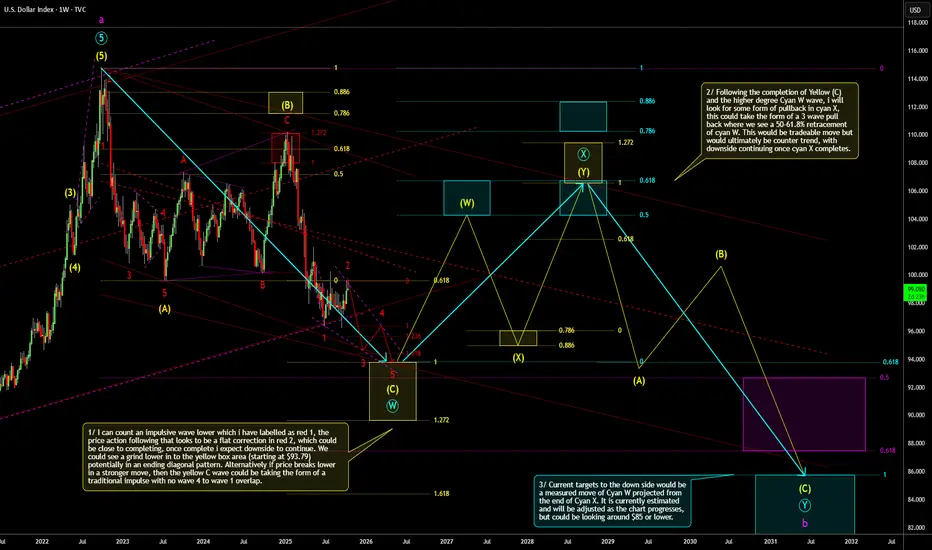
DXY Weekly Outlook (Count 3)This is a weekly timeframe outlook of the TVC:DXY . This is in alignment with my previously posted outlook which so far is playing out close to how I expected. This shows the wider view of what I think could be playing out. Still targeting the same yellow zone for a potential termination of the yellow (C) wave, after which we could see a counter trend consolidation. Current price action on the lower timeframe looks like it is forming a bearish flat correction which could be wave 2 in red. I'll look get a lower time frame update together, when time allows. More comments on the chart.
ETHUSD: Where Price Could Go?4h tf
ETHUSD has bounced back strongly from around $3,826 after completing an A-B-C wave pattern. Right now, the price is testing resistance near $4,756. It could drop a little to around $4,440 before moving higher again. If the uptrend continues, the next target levels are $4,955, $5,300, and $5,500.
Stay tuned!
Thank you,
@Money_Dictators

NQ TradesB wave is in. Currently within 1st minutte wave of the intermediate C wave down, of the current 4th wave. Entry of the 382 retracement of the most recent 3rd wave, SL coveres upto 618. Looking for just 161.8% trend based fib of the 1-2 waves. Effectively predicting the terminus of the 3rd wave, we then allow a 4th to occur, then 5 to complete the first wave down of the C wave. Bosch.

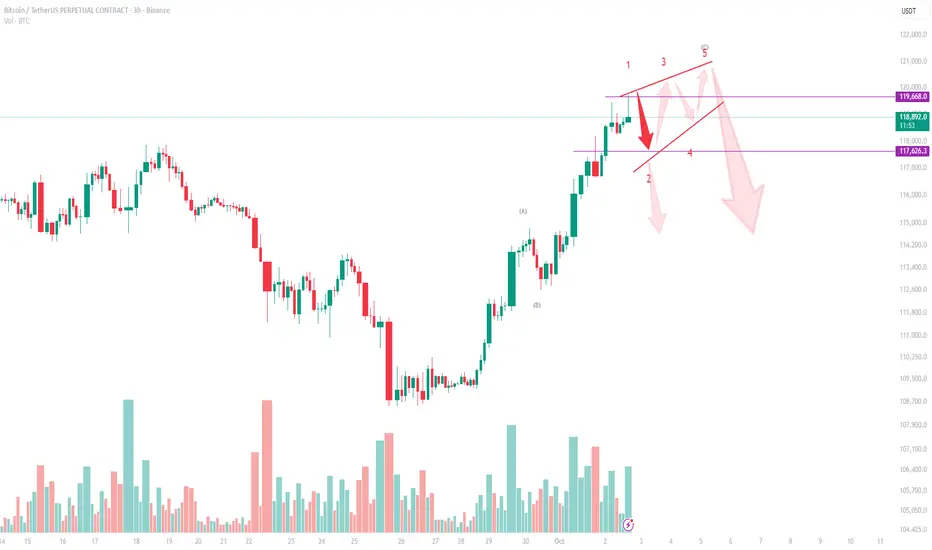
Bitcoin (BTC/USDT) Technical Analysis – 3H ChartWave Structure Outlook
Bitcoin is currently trading near $119,300, where the wave structure suggests a possible Ending Diagonal formation. This leaves us with two bearish scenarios to monitor:
Scenario 1 – Immediate Downside After 1–5 Completion
The 1–5 wave sequence may already be completed.
If so, the market could trigger an immediate downside move, breaking wedge support.
First critical level is $117,600. A clean break below this level would confirm the start of a deeper correction, opening the way toward $115,000 – $113,000.
Scenario 2 – Choppy Ending Diagonal (Light Red Arrows)
Alternatively, BTC may still extend within an Ending Diagonal.
This would mean choppy, back-and-forth price action (small up-and-down moves) before the final breakdown.
In this case, price may retest the $119,800 – $120,000 zone, but the structure remains corrective, and the eventual expectation is still bearish reversal.
Key Levels to Watch
Resistance: $119,800 – $120,000 (upper wedge boundary)
Support: $117,600 (first breakdown level)
Bearish Targets: $115,000 → $113,000
Conclusion
BTC is losing momentum at the end of a 5-wave structure. Whether the market follows Scenario 1 (immediate breakdown) or Scenario 2 (choppy diagonal ending before reversal), the overall outlook is bearish in the short term.
Nifty 50: Genuine Rally or Selloff Setup?The Nifty 50 Index went up, but this upward move was likely just a temporary correction, not the start of a new, long-term rise.
Bottom (Wave W): The index first hit a low around 24,377
Bounce (Wave X): It then went up to a high near 25,448. This rise was a clear, three-part corrective move (like an ABC pattern) that stayed inside a rising channel .
Clue: Because the move from the bottom (W) to the peak (X) was corrective, it suggests the overall trend is still bearish (downward).
Points to look at:
1. Reversal: The index is currently around 24,836 and is starting to turn down from the top of that rising channel. This suggests the temporary rise is over.
2. Projected Drop (Wave Y): The main prediction is a significant drop (Wave Y) that will likely break the previous low of 24,377 .
3. Target: This decline is expected to head toward the lower blue trendline on the chart, completing a larger WXY corrective pattern.
4. Projection: Ending point of wave (Y) can act as the ride for the new impulse cycle.
5. Bearish Stance: Traders should be cautiously bearish (expecting the price to fall).
6. Price action perspective: Previous swing is bearish, better to look at short positions for safe entry.
7. Selling Opportunities: Any small upward movements (retracements) are seen as good selling opportunities (betting on the price going down), as long as the price doesn't break above the recent highs or the channel ceiling.24,300 is indeed a strong demand zone.
Stay tuned!
Money Dictators :)
