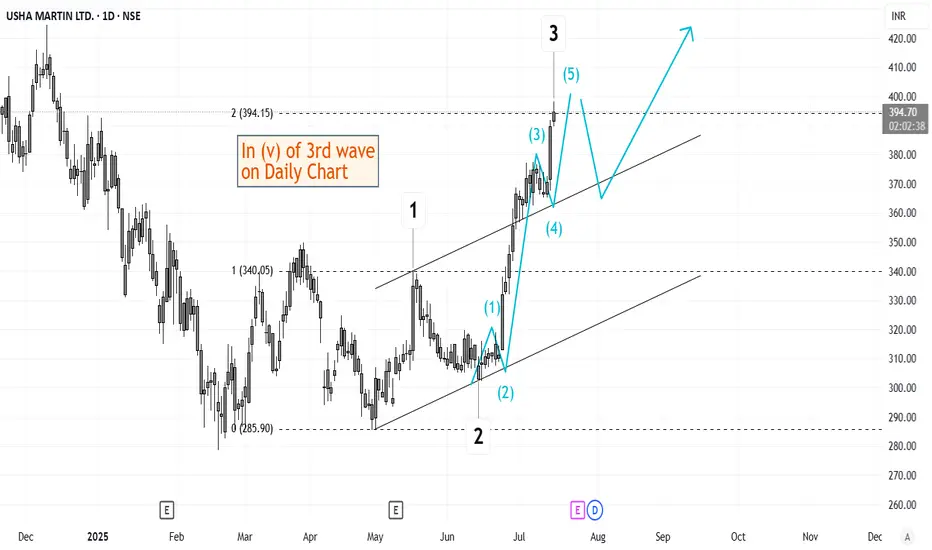
Elliott Wave Analysis of Usha Martin USHAMARTThe script is currently in (v) of 3rd wave on daily time frame. This should be followed by a short retracement and then a 5th wave up. Will keep updating this chart as it progresses.
Elliottwaveanalyis
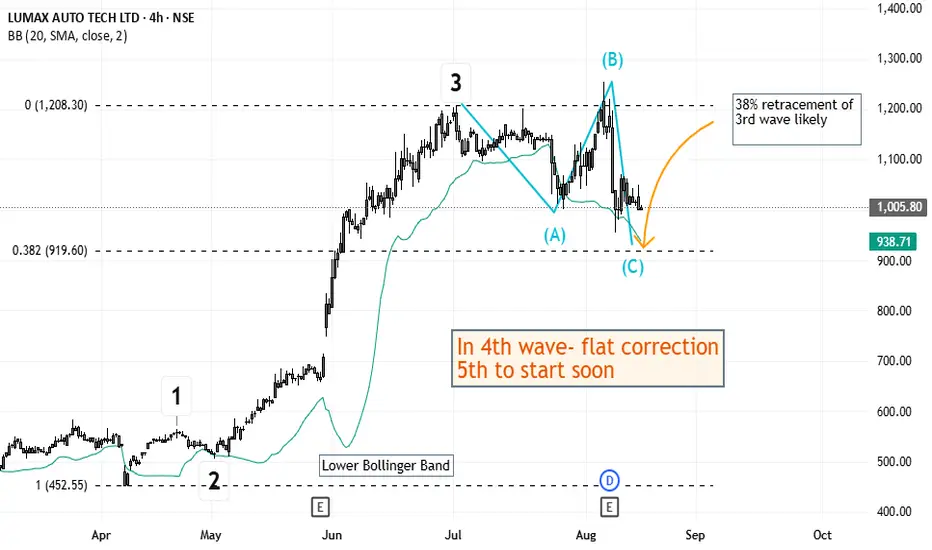
Elliott Wave Analysis of Lumax Auto Technologies LUMAXTECHLumax appears to be in 4th wave currently. The 4th wave turned out to be a flat corrective wave with (3-3-5) internal waves. One lower low is probably remaining before 4th is completed.
Elliott Wave Analysis of Ashapura Minechem ASHAPURMINThe script is currently in retracement wave 4 and at a crucial support. When completed, next 5 waves impulse should follow in 5th wave.

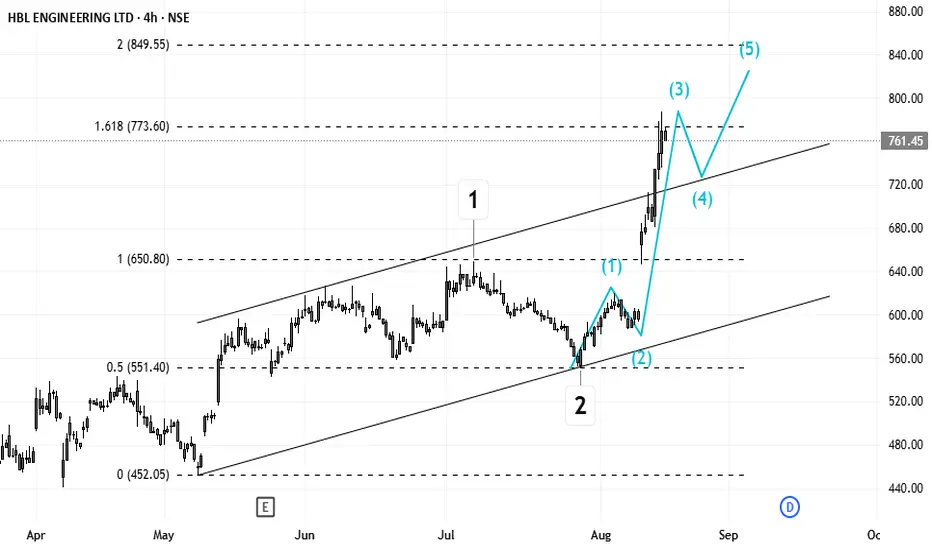
Elliott Wave Analysis of HBL Power Systems HBLENGINEThe script seems to be doing 3rd wave on daily time-frame. The first wave was diagonal. After 3rd is done, a retracement should follow and then again an impulse wave 5th to complete the larger impulse move.
Elliott Wave Analysis of Apollo Tyres APOLLOTYREApollo Tyres has completed a complex correction which seems to be a combination of a flat wave and a zigzag wave. Also, the B wave in zigzag was a triangle retracement. A 5 wave impulse should follow after this.

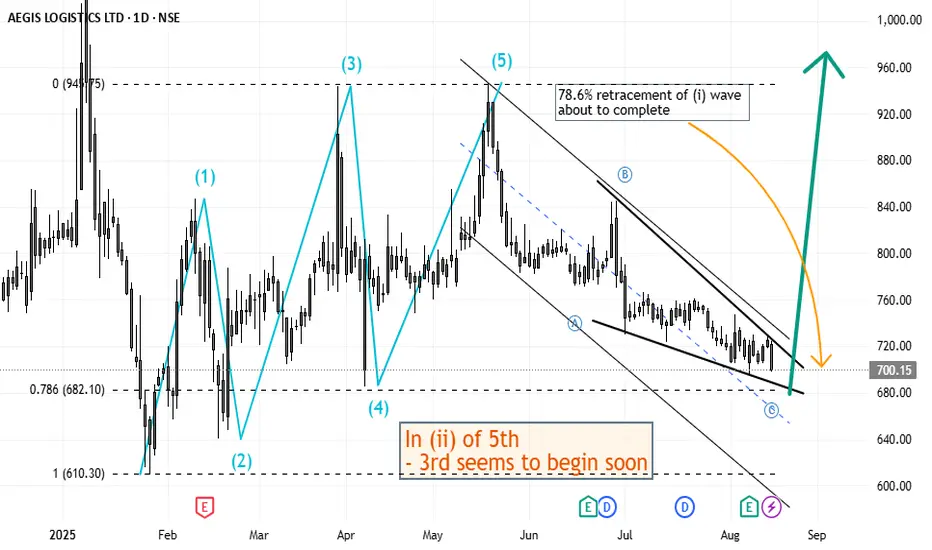
Elliott Wave Analysis of Aegis Logistics AEGISLOGThe script is doing 5th of weekly time-frame and seems to about to complete (i) of 5th with 78.6% retracement. The (i) was a diagonal impulse wave. And now in retracement, the C wave also appears to be forming an ending diagonal. After this is completed, (iii) wave should start.
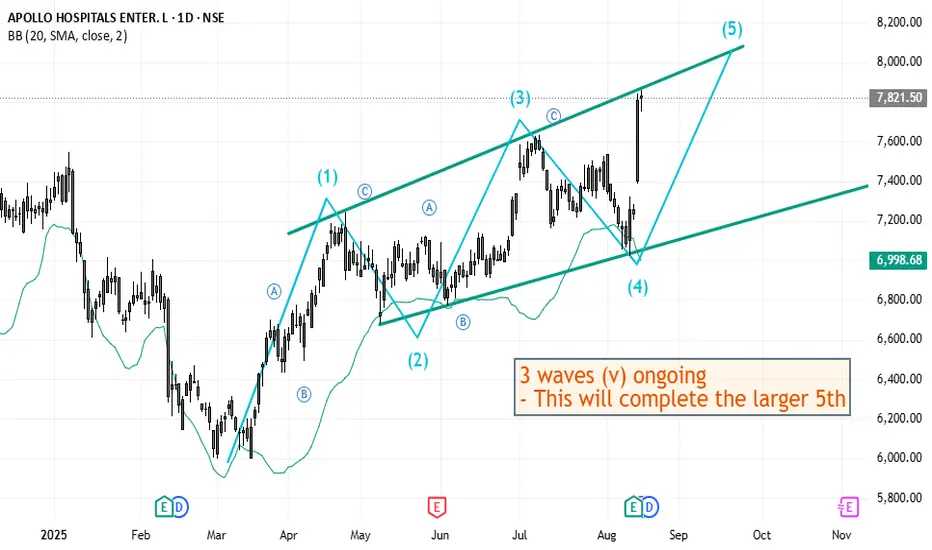
Elliott Wave Analysis of Apollo Hospitals APOLLOHOSPApollo Hospitals has been doing a diagonal and is currently in the (v) wave of the diagonal 5th. After this short term long, it appears to be followed by a bigger retracement.
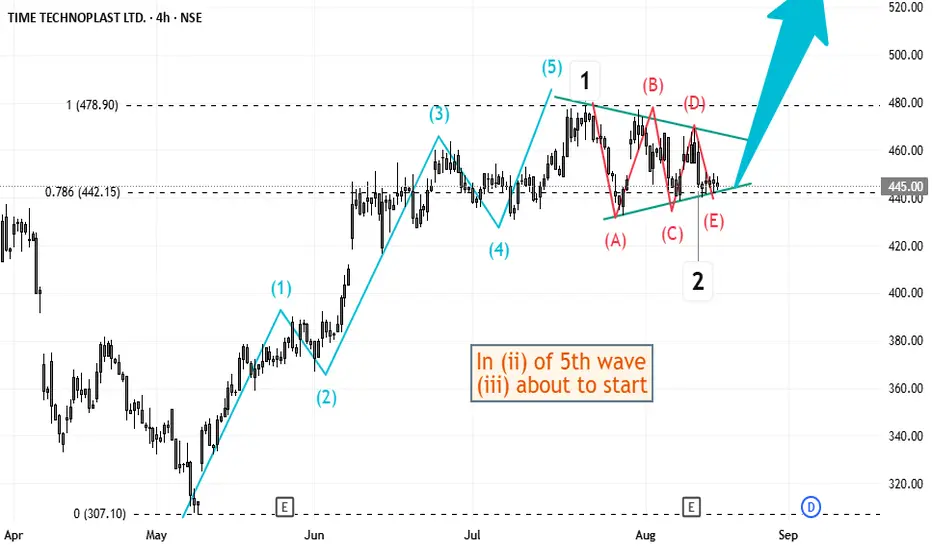
Elliott Wave Analysis of Time Technoplast TIMETECHNOThis script appears to have just completed a triangle retraction after a 5 waves move in 5th wave. This means, a next 5 waves move up might be in play on daily time-frame. But the 2nd wave did not go deep as usual, so one also needs to be cautious of the possibility of a complex retracement forming.
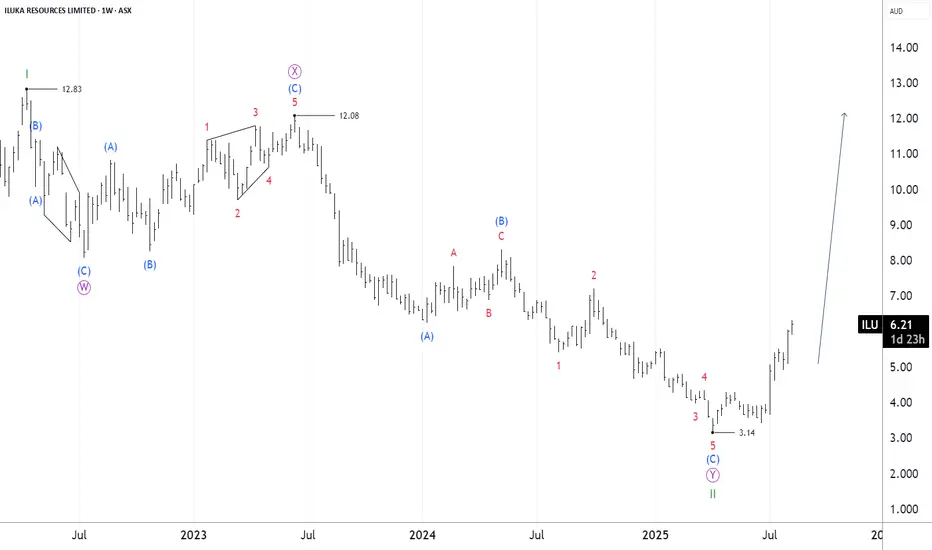
ASX:ILU - 13 AUG, 2025 - ELLIOTT WAVE ANALYSISConclusion: Wave III-green could be moving higher.
Key takeaways: Wave II-green ended as a Double Zigzag at 3.14. Wave III-green then moved higher, targeting the nearest target at 12.83. While price must remain above 3.14 to keep this bullish view valid.
©By Hua Chi Cuong (Shane), CEWA-M | Certififed Elliott Wave Analyst - Master Level
SILVER (XAG/USD): 12 AUG, 2025 | ELLIOTT WAVE ANALYSISConclusion: The C-red wave may be moving lower.
Bottom line: The C-red wave is pushing down to the nearest target at 37.07 or possibly lower, depending on the price action reaction at that level.
On the other hand, the ALT alternate wave count depicted on the chart is gaining weight. But in the short term, the ALT view is likely to also move to 37.07. Then, if it moves higher above 38.50, it will trigger the ALT scenario.
Invalidation Point: 39.52
©By Hua Chi Cuong (Shane), CEWA-M | Certified Elliott Wave Analysis - Master Level.

BITCOIN (BTCUSDT): 12 AUG, 2025 || ELLIOTT WAVE ANALYSISConclusion: Wave iii))-green is continuing to move higher.
Key Points: Wave iii))-green is extending, and subdividing into wave i)-purple to wave iv)-purple. I am not sure if wave iv)-purple is finished, but it should not move lower than 115,720 (Invalidation Point: Wave 4 should not overlap wave 1).
On the other hand, 118,050.11 acts as a key level that price needs to hold higher, to gain confidence, weight for this view.
©By Hua Chi Cuong (Shane), CEWA-M | Certified Elliott Wave Analyst - Master Level

XAG/USD Eyes Upside Targets as Wave C MaturesXAG/USD is currently trading in a corrective phase where wave B appears to have completed, and wave C is currently forming. Based on the current price action, it doesn’t seem likely that this entire move will result in a full bullish recovery. The structure suggests that this could be sub-wave C of wave 4, potentially completing around the 26.79944 level. Going forward, if the 5th wave begins to unfold, potential targets could be in the range of 29.74182 to 30.57528.

dollar elliott wave countingdxy is falling since it peaked in Q4 2022
since their last 75bps hike dollar is constantly falling and stocks, gold, bitcoin constantly rising and making new all time high
wave W = wave Y
(equal in length, 100% projection for wave Y)
since starting of the year due to trump tariff dollar is falling
this is year in first half dollar saw biggest collapse since end of gold standard
now 100% projection target for wave Y at 95 area is big static support level
if dxy recover back to 100 area then this will be first sign of reversal

Dollar In Fifth Wave-Reversal In Trend May Not Be Far Away.The Fed will announce its latest policy decision later, and expectations are that Powell will keep rates on hold, especially after last week's slightly higher inflation print and still solid US jobs data. We can see some stabilization in the US dollar ahead of this event, but we have to keep an eye on geopolitical tensions in the Middle East, which coudl also play a key role in driving safe haven flows.
Meanwhile, the stock market continues to trade sideways, and I don't expect any major breakouts or strong moves ahead of the Fed. Also, tomorrow is a holiday in the US, so that could contribute to slower market conditions into the end of the week, unless, of course, the situation in the Middle East gets worse.
Looking at the DXY waves structure, I see athree-wave move from the most recent lows, so the fourth wave I highlighted a few days ago could now be approaching completion near this week’s key resistance around the 99 level. That’s definitely a level to watch for a potential fresh, but possibly final sell-off toward new lows around 97, maybe even 96.
That’s where the DXY could stabilize, as ending diagonal pattern signals that we are likely in the late stages of wave five, meaning this bearish cycle could soon come to an end.

Gold (XAUUSD) – Lower TF Wave (B) Top in Place? Higher TF Conflu⚠️ Price has now completed what appears to be a clean 5-wave advance into the key supply zone — potentially completing wave ((C)) of (B) on the lower timeframe.
• Wave ((ii)) = expanding flat
• Wave ((iv)) = expanding triangle
• Final ((v)) push into supply with RSI/MACD divergence
A breakdown below 3435 could confirm the reversal into wave (C). Downside fib targets align around 3400, 3350, and 3280.
A marginal high can’t be ruled out, but structure is now favouring bears short term.

Hellena | EUR/USD (4H): LONG to the resistance area 1.15691.Colleagues, I believe that wave “5” of higher order has actively started an upward movement.
At the moment I see movement in wave “1” of medium order and it means that a correction in wave “2” to the area of 50% Fibonacci level (1.12434) is expected. But I would still advise to consider only upward movement and use pending limit orders.
I see the maximum of wave “3” - resistance area 1.15691 as the target.
Manage your capital correctly and competently! Only enter trades based on reliable patterns!

SOL Hits Major Resistance — Patience Over FOMOOne of the most common mistakes traders make—especially in fast-moving markets—is jumping into trades impulsively at major resistance. It feels exciting when price is surging, but ironically, this is often where risk is highest and reward is most limited.
Why? Because historical resistance zones—like the $175–$183 region on SOL—tend to attract heavy sell pressure. These are levels where many past buyers look to exit, where smart money hunts liquidity, and where false breakouts are most common. Without volume confirmation and a proper retest, breakouts through such zones often fail.
That’s why experienced traders wait. The smarter approach is to let the market come to you, and only act when one of two things happens:
A pullback into a well-defined, confluence-rich support zone
A clean breakout above resistance, followed by a retest and confirmation
SOL has respected structure beautifully, but now is not the time to chase. Either wait for a healthy correction into support, or let price prove its strength through a confirmed breakout. No trade is also a trade — and capital preservation is the foundation of long-term success.
Patience isn’t passive — it’s a strategy. Let the market come to your desired levels. You don't need to catch every move, only the high-probability trades and there aren’t born from impulse — they’re built on patience, structure, and right timing. 💎
Technical Breakdown
SOL has entered a major resistance zone between $175 and $183 — a historically significant level respected for over a year.
Within this zone lie two key highs:
$179.85: Recently swept with a clean Swing Failure Pattern (SFP)
$180.52: Still untested — if broken, it would confirm a strong bullish continuation
Breaking through such a well-established resistance on the first attempt is uncommon — it typically requires momentum and structure. A rejection here would suggest that SOL needs a healthy correction before mustering the strength for a true breakout.
📉 Elliott Wave Count
Looking at the structure, we’ve completed a 5-wave sequence — signaling the potential end of this impulse leg. According to Elliott Wave Theory, a corrective phase is now expected before continuation.
📐 Additional Confluence: Fib Speed Fan
The 0.618 Fib Speed Fan — drawn from the all-time high at $295.83 to the swing low at $95.26 — aligns perfectly with this resistance zone, adding more weight to the idea of a potential rejection or pause.
🟢 Long Setup: The Next High-Probability Entry Zone
We now shift our focus to where the next long opportunity could arise. Here’s the technical confluence:
Anchored VWAP from the recent low at $141.41 sits at $164.70
4H bullish order block around $164.46
0.382 Fib retracement of the full 5-wave impulse: $165.42
0.412 Fib retracement: $164.25
All these levels converge in a tight band, providing a solid long entry zone between:
Long Entry Zone: $165.50 to $164.25
Stop-Loss: Below $160 (to protect against any deep wick)
Targets:
TP1: $171.75 (Point of Control from the range)
TP2: $180.00 (resistance retest)
TP3: $200.00 (psychological level)
Estimated R:R: ~6:1 — High-conviction setup
Bonus: If price returns to this $165 zone within 24 hours, it will also be supported by the 0.618 Speed Fan — adding one more layer of support.
🔴 Short Setup: Reversal Play at $200
For those watching from the sidelines or looking to fade the rally, the psychological level at $200 presents a strong short opportunity — but only on confirmation (e.g., SFP or bearish engulfing).
Short Entry: On rejection at $200
Stop-Loss: $206.10
Target: $187.00
Estimated R:R: ~2:1
🧠 Summary:
Completed 5-wave structure → potential correction phase underway
Strong resistance at $175–$183 with SFP and speed fan alignment
High-probability long setup at $165.5–$164.25 with multi-layered confluence
Potential short at $200 on confirmation
⚠️ Key Takeaway: Don’t Chase the Highs
This is where many traders slip — FOMOing into trades at major resistance. Please, don’t do it. Instead, wait for:
A pullback into well-defined support (like the $165 zone), or
A clean breakout above $180, followed by a confirmed retest
____________________________________
If you found this helpful, leave a like and comment below! Got requests for the next technical analysis? Let me know.

Gold Is Doing What Ever Gold Wants To DoPreviously I posted a reading where I said gold was to go a bit down before is went up. But Gold didn't go down, and went straight up.
But it did go up right :D
Right now I strongly believe gold is in a wxy correction.
And I think will finish the y-wave i the green box area somewhere between 3,147 and 3,077, which is the 100-123% fib-level of the w-wave.
The reason I believe this, is at that timewise the y-wave will here have taken as long as the w-wave, and I the price is heading for that cyan median line. And normally price will also go to the bottom and a bit below of the Kennedy line.
Multiple factors are pointing to that level.
When price hits that level, I believe we will see a 5th level to the upside where 4,000 definitely is in play.
I will include a link to a higher degree reading, where you can see I believe gold has finished a third wave, so we still need a 5th wave to the upside.

Nifty: Correction aheadNifty is likely to correct lower towards 23400-23000 zone before resuming up.

Russell 2000 - Sell till late May & Buy in Early June?
Wave (ii) is still in progress. Slight update to the primary wave count from the previous one below.
200 & 100 SMA's are sloping firmly to the downside therefore I will continue to keep selling at technical levels. Late May or early June would be a good time to go long...
Support levels are shown in green.

[BTC/USDT] Wave (4) Completed? Road to $140K Begins HereBitcoin is consolidating just above key support after a textbook correction. The first chart shows a completed Falling Wedge breakout from Wave ④, while the second chart lays out macro Fibonacci targets for Wave (5).
Chart 1 (Daily): Local Breakout Setup
• Falling wedge breakout above 83.9K–84.3K
• Completed structure: Wave ③ → ④ → Potential Wave ⑤
• Invalidation: Below 73.8K or worst-case 69.5K
• Bullish continuation requires break & close above 86K
Chart 2 (Weekly): Macro Target Projections
Using Fibonacci extension from Wave (3), BTC shows:
• 0.618 Target = $114,983
• 1.000 Target = $140,033
• 1.618 Target = $180,560
If current support holds, Bitcoin could be entering a massive Wave (5) cycle with upside potential towards $140K–$180K. Reclaiming levels like $92.5K, $101K, and $106K will confirm the bullish structure.
What’s your Wave 5 target?
#Bitcoin #BTC #BTCUSDT #CryptoAnalysis #ElliottWave #Fibonacci #CryptoTA

Russell 2000 - one more drop to complete the correction?Looking for the double zig zag correction to complete (Y) leg in the blue zone. Will be looking for five waves to the downside for the target.
Updated the wave count from my previous chart below...
This drop from the 25th November 2024 to the expected target zone would be more or less similar to the Covid drop in terms of percentage.

Russell 2000 - time to Buy pullbacks...Shorts were good while it lasted... looks like a good time to buy pullbacks.
It would be wise to wait for a clear 3 wave correction though.
Elliot Wave Analysis shows a larger degree wave IV was completed in March 2020.
Since then, the Russell 2000 has been nesting within a bullish rectangle chart pattern, possibly working its way up to the larger degree wave V.
Seasonality Chart shows a bullish April with a possible correction in May.
Nevertheless, I will not commit to long trades till the chart clearly shows that we are out of the woods. A clear 3 waves move down closer to 1800 in the hourly/4 hourly time frame would be a good setup.
