1D chart | XRP/USDT – Bigger 5th Wave in Play: or WXYXZ?I’m tracking the development of the larger 5th wave for OKX:XRPUSDT , which currently has a target range between 4.0600 and 5.4003 .
My main scenario is a standard 5-wave impulse. In this case, wave 3 should extend toward 4.2766 , with the full 5th wave likely pushing deeper into the broader target zone.
The alternative scenario is a complex W–X–Y–X–Z correction. This would imply a minimum target of 3.6618 , but more realistically it should go within the 4.4348–4.9888 zone before the structure completes.
For now, I lean toward the impulsive count, but I’ll be watching price behaviour near these key levels for confirmation.
💬 Which scenario do you think is more likely to play out?
Elliott Wave

RKLB: Elliott Wave Analysis. TARGET $71
RKLB is in its final move up to complete its fifth wave in wave three.
If W1=W5 target is 71.
After this move a deep retracement likely a complex Wave 4 should unfold before we see continuation to the upside.

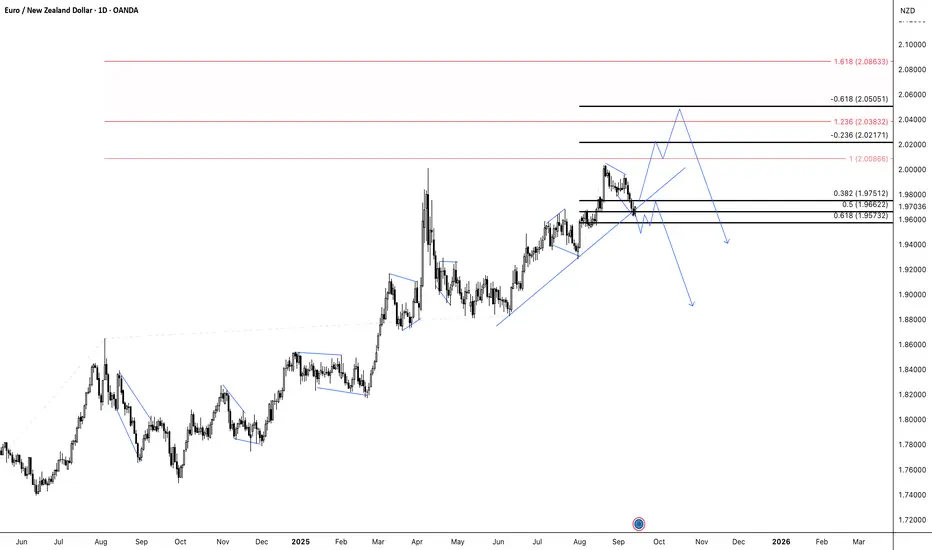
EURNZD – Wave Analysis OutlookThe structure on EURNZD suggests the pair is unfolding within a broader impulsive sequence, but the short-term leg appears corrective in nature. Price is currently reacting around the 1.96 – 1.97 zone, which aligns with a cluster of Fibonacci retracements.
From a wave perspective, the decline from recent highs looks corrective, hinting that another upward leg could still develop before the larger cycle turns lower.
If price holds above the 1.95 – 1.96 support region, an extension higher toward the 2.02 – 2.04 zone remains possible.
That zone coincides with Fibonacci projections and could serve as the completion area for the current upward phase.
Once that move matures, the broader structure points to a potential bearish transition, with deeper downside targets unfolding in line with the larger corrective path.
Wave analysis often reveals how markets expand in measured phases shorter-term corrections feeding into higher-degree swings. The key is to monitor whether price respects the current corrective floor or breaks it, which would confirm an earlier shift into the downward sequence.
👉 I’ll be looking for a sell setup if price reaches the 2.02 – 2.04 zone or if we break below the current trendline and consolidate.
⚠️ Disclaimer: This outlook is based on personal wave analysis and shared for educational purposes only. It is not financial advice. Trading involves risk—always do your own research before acting.
USD/CAD – Wave Analysis Outlook The current structure on USD/CAD shows price unfolding within a developing corrective sequence. The market has been progressing in overlapping swings, hinting at a temporary continuation higher before a potential reversal.
Based on wave analysis, price appears to be completing a smaller-degree upward leg that could stretch toward the 1.39 – 1.40 zone.
Once that phase matures, the larger context suggests the market may transition into the next downward leg, aligning with the broader corrective cycle.
A failure to sustain above the 1.40 handle would strengthen the bearish case, opening the path toward deeper downside projections.
This perspective highlights how wave formations often build in layers—smaller moves feeding into larger corrective patterns. The key is to observe whether the market respects the unfolding sequence or extends beyond it, which will reveal the true wave count in play.
⚠️ Disclaimer: This post reflects my personal wave analysis for educational purposes only. It is not financial advice. Trading carries risk, and you should always do your own research before making decisions.

Downtrend Ascending TriangleTrading note 2025 Sept 12
Downtrend ascending triangle vs. elliot 5 waves.

GBPNZD Wave analysis W1 (Scenario 2) - 12/9/2025GBPNZD Wave analysis W1 (Scenario 2) - 12/9/2025
There are 2 Scenarios for down trend and this is one of two

GBPNZD Wave analysis W1 (Scenario 1) - 12/9/2025GBPNZD Wave analysis W1 (Scenario 1) - 12/9/2025
There are 2 Scenarios for down trend and this is one of two.


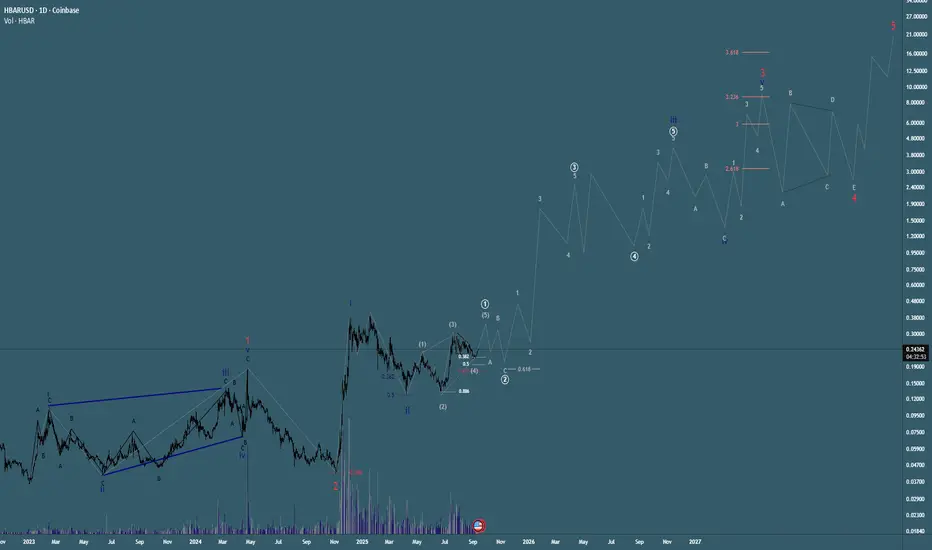
HTF Elliott Wave Count on HBAR! Super Bullish!!Here is the macro bullish outlook on HBAR using the Elliott Wave Theory. Currently we are making progress to the upside to complete the grey wave 5 to finish the leading diagonal in white. Next expect a retracement between .21 (extreme of wave 4) - .18 (.618 of diagonal), it could retrace deeper as is common with a wave 2, although the extreme bullish nature of this impulsive structure makes me think it could be a shallow retracement (38.2% - 50%) before blasting off on everyone looking for their entry to be hit. Exciting times ahead for HBAR i believe. Happy Trading
Something to keep eye on.. v2.0updating the previous idea
Diagonal down perhaps A
Flat B
Wave C to be executed

BTC/USDTI think wave five has completed for correction in the ABC, I will open a sell position with this setup.
BTC(based on NEo wave)bitcoin is making a bow-tie diametric and finale wave is starting.
pay attention: do not buy bitcoin on this final correction,its a good time to buy altcoins like eth,doge,sol and others.
NZDUSD Hits Strong Resistances – Bearish Reversal Ahead?NZDUSD ( OANDA:NZDUSD ) is currently trading near the Resistance zone($0.6000-$0.5958) , Potential Reversal Zone(PRZ) , and Resistance lines .
From a classical technical analysis perspective, NZDUSD seems to be completing the Ascending Broadening Wedge Pattern .
From an Elliott wave theory perspective, NZDUSD seems to have completed the microwave C of the microwave Y of the main wave B . So we should wait for the next bearish waves .
Also, we can see the Regular Divergence(RD-) between Consecutive Peaks .
I expect NZDUSD to drop to at least $0.5890(First Target) .
Second Target: $0.5865
Third Target: $0.5828
Stop Loss(SL): $0.5983
Note: Today's US data release could cause a shock to NZDUSD, but ultimately, NZDUSD will continue its downward trend (at least to the first target).
Please respect each other's ideas and express them politely if you agree or disagree.
New Zealand Dollar/ U.S. Dollar Analyze (NZDUSD), 1-hour time frame.
Be sure to follow the updated ideas.
Do not forget to put a Stop loss for your positions (For every position you want to open).
Please follow your strategy and updates; this is just my Idea, and I will gladly see your ideas in this post.
Please do not forget the ✅' like '✅ button 🙏😊 & Share it with your friends; thanks, and Trade safe.

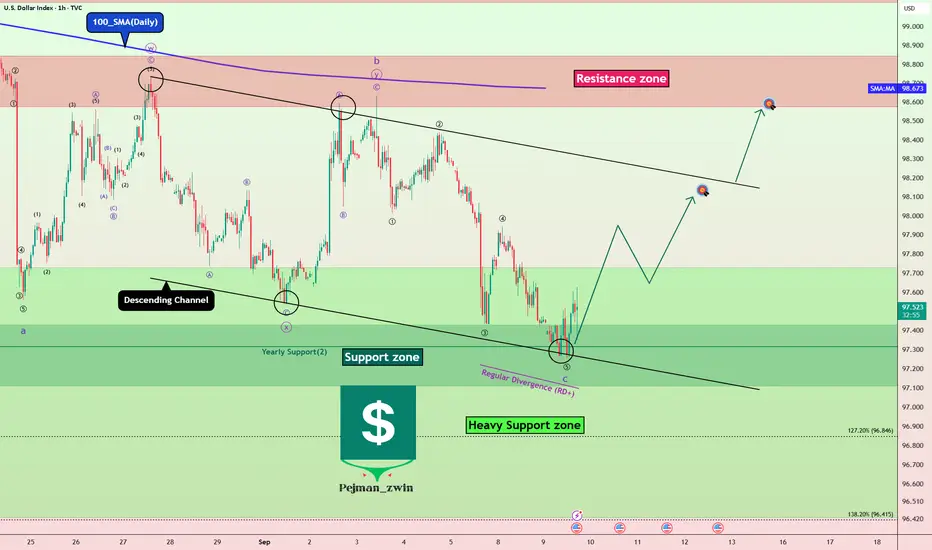
DXY at Major Support – Dollar Ready to Rebound?Today, I want to analyze the DXY index ( TVC:DXY ) for you. First, I must say that this week, US indexes can have an impact on the DXY index trend .
US indexes to be released this week:
Core PPI m/m: Tomorrow
PPI m/m: Tomorrow
Core CPI m/m: Thursday
CPI m/m: Thursday
CPI y/y: Thursday
Unemployment Claims: Thursday
Prelim UoM Consumer Sentiment: Friday
Prelim UoM Inflation Expectations: Friday
The DXY Index is currently moving near the Support zone($97.989-$97.834) , Yearly Support(2) , and the lower line of the descending channel .
In terms of Elliott Wave theory , it seems that the DXY index has managed to complete microwave 5 of the main wave C . The corrective structure is of the Zigzag Correction(ABC/5-3-5) type.
Also, we can see the Regular Divergence (RD+) between consecutive valleys .
I expect the DXY index to rise to at least $98.07(First Target) before the US indexes are announced.
Second Target: $98.56
Stop Loss(SL): $96.997
Note: With the DXY index rising, we can expect a correction in Gold( OANDA:XAUUSD ), Bitcoin( BINANCE:BTCUSDT ), and major Forex pairs (dollar strength).
Please respect each other's ideas and express them politely if you agree or disagree.
U.S. Dollar Index Analyze (DXYUSD), 1-hour time frame.
Be sure to follow the updated ideas.
Do not forget to put a Stop loss for your positions (For every position you want to open).
Please follow your strategy and updates; this is just my Idea, and I will gladly see your ideas in this post.
Please do not forget the ✅' like '✅ button 🙏😊 & Share it with your friends; thanks, and Trade safe.
Understanding Elliott Wave Theory with BTC/USD If you’ve ever stared at a Bitcoin chart and thought, “ This looks like chaos ”, Ralph Nelson Elliott might disagree with you. Back in the 1930s, Elliott proposed that markets aren’t just random squiggles — they actually move in recognizable rhythms. This became known as Elliott Wave Theory .
So, what is Elliott Wave Theory? In the simplest terms, it’s the idea that market psychology unfolds in waves: five steps forward, three steps back, repeat. Not every chart follows it perfectly, but when you see it play out, it feels like spotting order in the middle of crypto madness.
⚠️ Before we dive in: remember, no single tool or pattern works alone. Elliott wave trading is most useful when combined with other methods.
The Elliott Wave Principle
At the heart of the Elliott Wave principle are two phases:
Impulse Waves (5 waves) : Markets advance in five moves — three with the trend, two counter-trend. This is when optimism snowballs.
Corrective Waves (3 waves) : The market cools off in three moves. Usually messy, choppy, and fueled by doubt.
Put them together, and you get a “5-3“ structure that repeats at different scales. That’s what gives Elliott Wave its fractal character. Again, don’t treat this as a crystal ball. Elliott Wave Theory rules are guidelines, not guarantees. Real-world Bitcoin charts bend, stretch, and sometimes ignore them altogether.
Elliott Wave Theory Explained with BTC
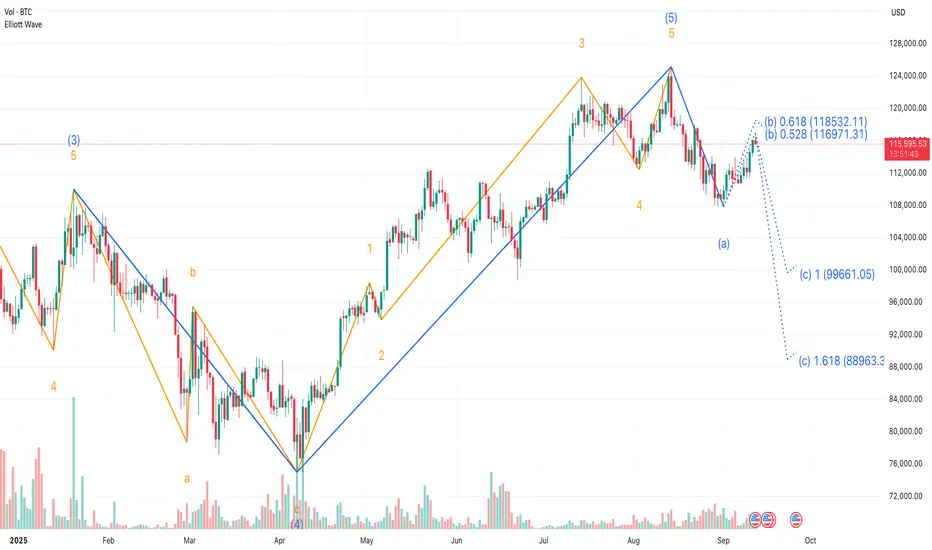
Let’s use an example: Bitcoin’s rally from early 2025 till now .
This downturn marked the first step in a broader consolidation, signaling that momentum was beginning to fade.
The corrective sequence unfolded in a classic A-B-C structure.
❗This three-part move effectively reset the market, washing out excess leverage and preparing the ground for the next impulsive cycle.
From that low, Bitcoin launched into a textbook five-wave impulsive rally.
This initial leg down, labeled wave (a), suggested that a larger corrective phase was now underway, replacing the bullish momentum with profit-taking and distribution.
That’s a textbook case of Bitcoin Elliott wave analysis . But notice: it wasn’t clean. Some traders counted the waves differently. Some saw extensions or truncations. That’s the thing with Elliott — interpretation matters as much as the rules.
Elliott Wave Theory Rules and Flexibility
The classic Elliott wave rules say things like: Wave 2 can’t retrace more than 100% of Wave 1. Wave 3 is never the shortest impulse wave. Wave 4 can’t overlap with Wave 1 in most cases.
But in practice, Bitcoin often blurs these lines. Extreme volatility, liquidation cascades, and macro shocks can distort wave counts. That’s why even seasoned analysts will say, “This is my Elliott count,” not the Elliott count.
The takeaway? Think of Elliott as a lens, not a lawbook.
Tools That Pair with Elliott
Many traders use the MT5 Elliott Wave Indicator or TradingView drawing tools to sketch their wave counts. Despite the waves becoming far more meaningful when tied to other signals:
Fibonacci Retracements: For example, watching how corrections line up with golden pocket levels. Momentum Oscillators: That confirm or contradict the wave structure. Macro Sentiment: Shifts that often align with corrective or impulsive phases.
Elliott Wave Theory trading doesn’t exist in a vacuum. Used alone, it’s like trying to predict the weather with just cloud shapes.
Why Beginners Should Care
If you’re new, you might be asking: “ Okay, but why bother with this at all? ” The answer: Elliott Wave Theory explained the psychology behind price swings long before the existence of cryptocurrency. It captures the human emotions behind markets — fear, greed, doubt, euphoria. And Bitcoin, perhaps more than any other asset, runs on psychology.
So whether you’re sketching waves, testing them on the Bitcoin Elliott wave chart , or just trying to understand why BTC always seems to surge then collapse, this framework helps put the chaos into context.
Final Thoughts 🌊
What is Elliott Wave Theory in trading? It’s not a magic formula. It’s a structured way of looking at markets through recurring patterns of optimism and pessimism.
And just like with every other tool we’ve discussed, it’s not about using it alone. The best insights come when you combine the Elliott Wave principle with other indicators: Fibonacci, moving averages, and even plain old support and resistance.
So the next time someone posts a “ wave count ” on a Bitcoin Elliott Wave analysis, don’t take it as gospel. Treat it as one possible map of where we are in the cycle. Because in trading, it’s never about certainty. It’s about perspective.
This analysis is performed on historical data, does not relate to current market conditions, is for educational purposes only, and is not a trading recommendation.
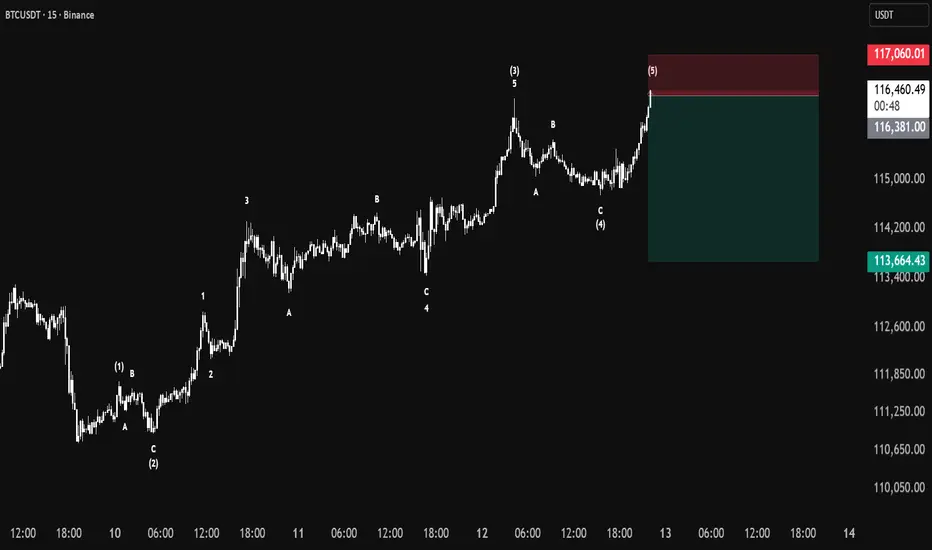
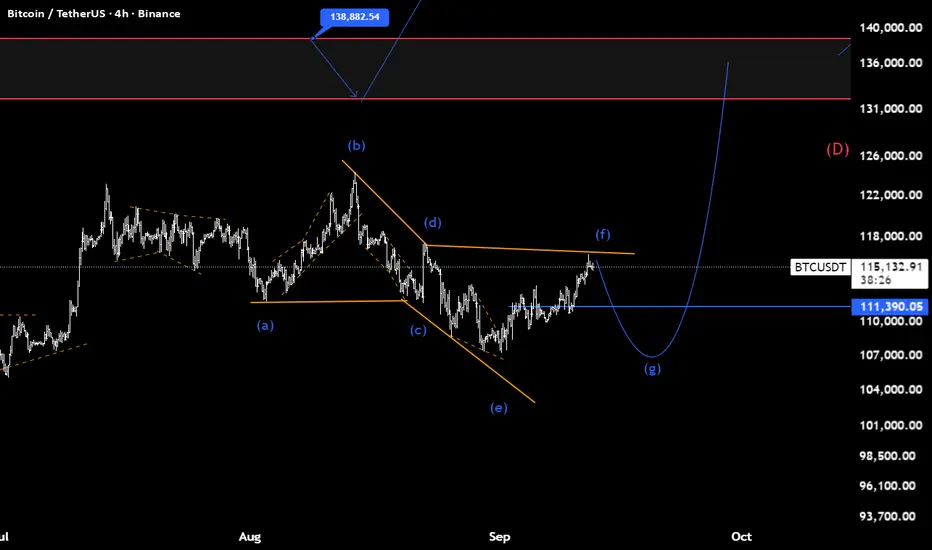
PPI Shock Pushes Bitcoin Higher – Fake Pump Before Drop?Bitcoin ( BINANCE:BTCUSDT ) has been making high momentum Sharpe moves over the last few days , which has made it a little difficult to trade, which is why I am still sticking to my previous analysis , and this analysis is an update of targets and even new entry points .
Bitcoin is currently moving near the Resistance zone($114,720-$113,580) , Reversal Zone(PRZ) , Cumulative Short Liquidation Leverage($114,510-$113,771) , Monthly Pivot Point , and Resistance lines = a set of Resistances
A few minutes ago, the US Core PPI m/m and PPI m/m data were released, which triggered a pump in Bitcoin . In my view, we should wait for Bitcoin to digest this shock and then continue its real trend .
Do you agree with me?
In terms of Elliott Wave theory , it seems that Bitcoin has completed microwave 5 of microwave C of the main wave Y , and we can expect a downtrend .
I expect Bitcoin to drop again to at least $111,600(First Target) .
Second Target: $110,883
Third Target: $110,000 and more dumps.
Stop Loss(SL): $114,923(Worst)
CME Gap: $117,235-$113,800
Cumulative Long Liquidation Leverage: $110,822-$109,752
Note: Be sure to follow capital management and do not take risks.
Please respect each other's ideas and express them politely if you agree or disagree.
Bitcoin Analysis (BTCUSDT), 1-hour time frame.
Be sure to follow the updated ideas.
Do not forget to put a Stop loss for your positions (For every position you want to open).
Please follow your strategy and updates; this is just my Idea, and I will gladly see your ideas in this post.
Please do not forget the ✅' like '✅ button 🙏😊 & Share it with your friends; thanks, and Trade safe.


Elliot Wave📚 Elliott Wave Trading Strategy — Education Framework
1. Origins & Philosophy
Ralph Nelson Elliott (1920s–1930s): Found that markets, while seeming chaotic, often move in repeating wave structures.
Core Belief: Market psychology cycles between optimism and pessimism in a fractal pattern.
Purpose: Provides a roadmap of where the market could be within a cycle (not a certainty).
2. The Two Types of Waves
Impulse (Motive) Waves (1–5):
Move in the direction of the main trend.
Rules:
Wave 2 never retraces >100% of Wave 1.
Wave 3 is never the shortest.
Wave 4 doesn’t overlap Wave 1.
Net result = trend continuation.
Corrective Waves (A–B–C):
Move against the main trend.
Three-wave structure: down (A), up (B), down (C) in a bull market.
Typically retraces a Fibonacci % of the prior impulse.
3. Key Components
Fractals: Small waves make up bigger ones, across timeframes.
Degrees of Waves: From Grand Supercycle (multi-century) to Subminuette (intraday).
Fibonacci Ratios: Common retracement levels (38.2%, 50%, 61.8%) and extensions (161.8%) guide targets.
4. Practical Trading Strategy
Elliott Wave by itself is subjective. The edge comes when combined with confirming indicators.
Example Workflow for Swing Trading
Identify Trend Direction:
Use 50-day/200-day MA, Ichimoku, or ADX.
Wave Counting:
Label impulse waves 1–5.
Wait for a corrective wave A–B–C.
Entry:
Many Enter end of Wave 2 or Wave 4 (buy dips in uptrend). Try entering a wave earlier, so that you lock in better Risk to Reward.
Use momentum oscillators (RSI/Stochastics) to confirm end of correction.
Exit/Profit Target:
Project Wave 3 or 5 using Fibonacci extensions (often 161.8% of Wave 1).
Stop Loss:
Below Wave 1 start (if long).
Above Wave 1 start (if short in a bear sequence).
5. Who Uses Elliott Wave?
Day Traders / Swing Traders: To catch impulse waves.
Long-term Investors: To avoid topping markets (useful in bubbles).
Cross-Market Traders: Applies in stocks, forex, commodities, crypto.
6. Advantages
✅ Provides forward-looking framework (not just lagging).
✅ Works across asset classes and timeframes.
✅ Helps identify where we are in a market cycle.
✅ Blends well with Fibonacci, RSI, and trend filters.
7. Disadvantages
❌ Highly subjective (two traders may count waves differently).
❌ No guarantee — probabilities, not certainties.
❌ Developed in the 1930s, critics argue it hasn’t adapted well to algorithmic/modern markets.
8. Famous Elliott Wave Calls
Dow 2002–03 Crash: Prechter predicted drop from 11,000 → 7,000.
Gold 2011 Peak: Predicted ~$1,900 top.
Bitcoin 2017: Analysts called $20K top → $3K.
9. Common Mistakes
Forcing wave counts (bias confirmation).
Ignoring other indicators.
Trading every wave → instead, focus on the big impulses.
No patience (wave structures can take weeks or months).
✅ Summary Strategy (Simple Version)
Use MAs or trendlines → determine main trend.
Count impulse waves → focus on Wave 3 and Wave 5 (strongest).
Wait for corrective pullback (Wave 2 or 4).
Enter with oscillator confirmation + Fibonacci retracement.
Exit at Fibonacci extension or trend exhaustion.

Oil bullish for 3rd waveOil could be breaking for long bull trend
The bottom for ABC correction is 62% retrace for previous long term trend.
sorry for labeling errors in charts... but you'll get the idea.

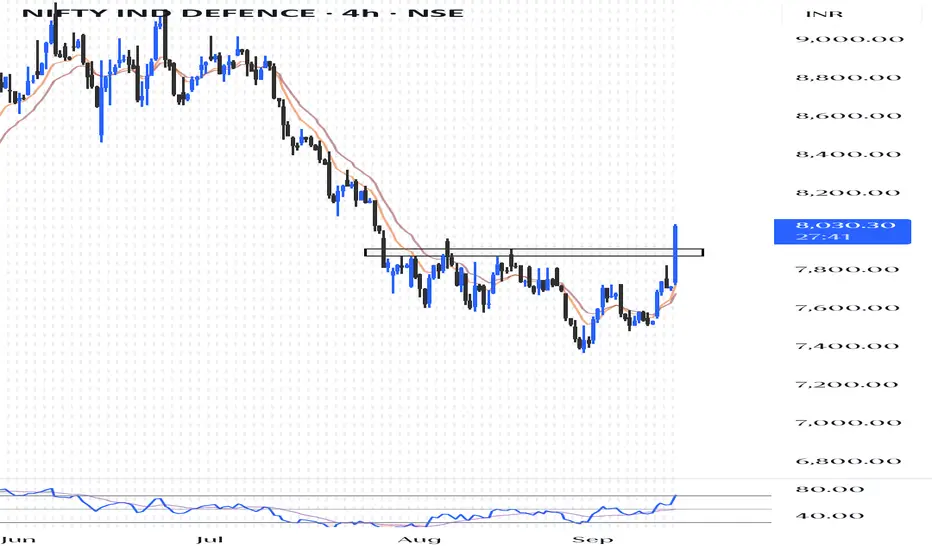
Defence sector showing strength Nifty defence showing strength potential breakout candidiates will be hal bel mazagon dock bdl keep on radar
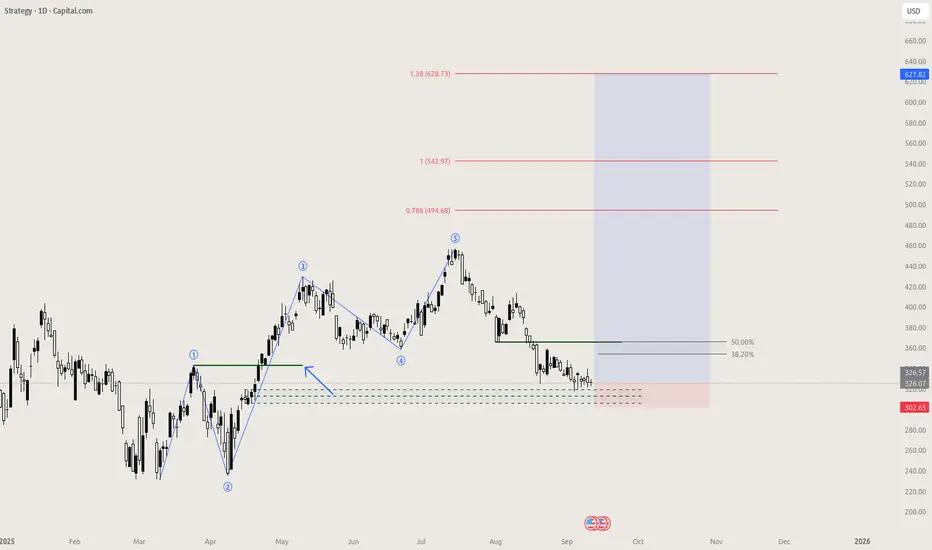
$MSTR Micro Strategy 🎯 Technical Setup:
Daily demand zone at ~$302-320 providing STRONG support
Break of structure (BOS) confirmed with rejection from demand
Perfect 1-2 Elliott Wave setup developing after correction
Target: 50% retracement minimum = $365+ (15%+ gain from current levels)
🚀 MicroStrategy BITCOIN BEAST:
Bitcoin Treasury King: 444,262 BTC worth $49+ billion in reserves
Saylor's Vision: World's largest corporate Bitcoin holder
Infinite Money Glitch: Issue convertible debt → Buy Bitcoin → Stock rises → Repeat
2.5x Bitcoin Leverage: MSTR moves 2.5x whatever Bitcoin does
💰 The Ultimate Bitcoin Play:
Pure Bitcoin Exposure: No mining costs, just pure BTC appreciation
Corporate Treasury Revolution: Leading the Bitcoin-as-reserve-asset movement
Institutional Gateway: Wall Street's favorite way to get Bitcoin exposure
Convertible Debt Machine: $42 billion raised to buy more Bitcoin
🎪 Why This Could Be EXPLOSIVE:
Demand Zone Bounce: $302-320 institutional accumulation zone holding
Bitcoin Catalyst: Any BTC move above $115K triggers MSTR mania
Wave 3 Setup: Most powerful Elliott Wave about to begin
Saylor Effect: Michael Saylor's Bitcoin evangelism driving adoption
Entry Strategy:
Current: $326 (bouncing perfectly off daily demand)
Confirmation: Above $340 with volume surge
Stop: Below $300 (demand zone violation)
Target 1: $365 (50% Fibonacci level)
Target 2: $450+ (if Bitcoin breaks $120K)
MSTR = Bitcoin on steroids at perfect technical entry! 🚀
BTC will hit 116500 , then fall to 100kElliott Wave analysis shows that Bitcoin has started its corrective wave 4. Usually, Elliott Wave 4 is a broad wave and records a lot of fluctuations in its path. My prediction is that Bitcoin can grow to the 116500 range and then continue its downward trend to 100k. I would be happy if you like it so that we can continue with more strength.

GOLD → Retest 3620 - 3600 (imbalance zones) on the uptrendFX:XAUUSD is consolidating ahead of important news. The market is currently testing support, but the bullish pattern remains intact despite the intraday correction.
Gold is trading near $3650 in anticipation of US inflation data (CPI), which will determine the further trend. So far, the metal is consolidating below a record high of $3675.
High CPI data: will strengthen the dollar and weaken gold (bets on Fed easing will decline).
Low data: will push gold to new highs (the likelihood of aggressive rate cuts will be confirmed).
At the moment, the probability of a rate cut on September 17 is 92% (25 bps), with an 8% chance of 50 bps.
Technically, the chart is forming a consolidation against the backdrop of a bullish trend, the market is testing support, and if the bulls hold their ground in the key zone, traders may return to buying.
Resistance levels: 3638, 3649, 3657
Support levels: 3620, 3607, 3600
There is a battle for the 3620 zone. Consolidation above this zone will confirm bullish strength; otherwise, we can expect a deeper correction to the 3607-3600 zone to retest the imbalance area before further growth.
Best regards, R. Linda!
