Hellena | GOLD (4H): LONG to 161.8% Fibo 4728 .Colleagues, the price is updating its maximum, and I think we shouldn't stop there.
After re-marking the waves, I realized that it would be more correct to place wave “3” at the 4549 level, since 5 waves fit well into it.
This means that the price is now in wave “5,” which can be quite unpredictable, but if we look at the blue waves, we can assume that there is now a medium-term impulse wave “3,” which means we can apply Fibonacci extension levels and see the 161.8% level as the target.
But I don't want to take such a risk and will set a slightly lower target - in the 4728 area. At the moment, we need to be very careful.
Manage your capital correctly and competently! Only enter trades based on reliable patterns!
Elliotwaveanalysis

Dollar At Resistance As you know, yesterday we got the US inflation data, which did not change and remained at 2.7% on a yearly basis, exactly as expected. The real moves came later, after Trump said that Powell is again too late with cutting rates and that markets should move higher on good news rather than falling. He clearly wants to give the impression that it is the Fed’s fault when markets react negatively to positive data.
Another important topic is Greenland, which remains under the spotlight. Trump has repeated several times that the US must own Greenland and even suggested that the US does not rule out using force to take control. This is one of the reasons why we are seeing a pretty strong recovery in energy prices, and there could be even more upside ahead. But despite this uncertainty around potential military actions, stocks are still holding up relatively well for now.
But my eyes are all on the USD. ...it seems to be this correction still appears to be in play since the end of December, but at resistance. It could be a seven swing move rather than a simple ABC rally, but it is still a counter trend movement. Notice that the dollar is now back at the very important 99.30 level, which can be potentially interesting reversal area going into 2nd half of this week. A drop out of the corrective channel and a break below 98.67 could be the first trigger for bears to push the dollar lower.
GH

NVO – Long-Term Cycle View (5–7 Years)Thesis
NYSE:NVO is transitioning from a completed Cycle Wave 2 into a new multi-year expansion phase. The long-term bull structure remains intact, with fundamentals now acting as a catalyst for the next cycle leg.
Context
- Weekly timeframe
- Primary bull trend originates from the 2009 GFC low (< $1)
- Cycle Wave 1 completed in July 2024
- Deep corrective Cycle Wave 2 now appears complete
What I see
-Structural reversal underway from long-term trend support
- Price stabilizing in a major accumulation / buy zone
- New Wegovy pill acts as a fundamental trigger aligning with the technical reversal
- Momentum and structure support the start of Cycle Wave 3
What matters now
- Holding the current base keeps the Cycle Wave 3 thesis intact
- This phase is about accumulation, not timing short-term moves
Buy / Accumulation zone
- Current zone remains suitable for long-term positioning
- This is where multi-year risk/reward is defined
Targets
- Cycle Wave 3 (1.618 Fib): ~$273. Expected around early 2029. Approx. +450% from the buy area
- Cycle Wave 5: ~$415. Expected around 2033. Approx. +730% from the buy area
Income
- Dividend yield ~2.1% adds meaningful carry while holding
Conclusion
Strong technical cycle alignment + improving fundamentals make NYSE:NVO a compelling long-term hold. This is a position built to be held through volatility, not traded.

Hellena | SPX500 (4H): LONG to resistance area of 7010.Colleagues, I expect the upward movement in the medium-term wave “1” to continue.
The minor wave “3” should still be developing, and I expect a repeat update of the high of the higher-order wave “3” (6929.4).
I consider the 7010 area to be the nearest target. If we calculate using Fibonacci expansion, the target is higher, but I always play it safe and take the nearest targets.
Manage your capital correctly and competently! Only enter trades based on reliable patterns!

Elliot Waves Strategy ExplainedElliott Wave theory is not a forecasting tool. The moment it’s used that way, it becomes useless. It does not tell you where price will go. It describes how participation unfolds once direction is already present.
At its simplest, markets alternate between expansion and digestion. Impulse waves show commitment and follow-through. Corrective waves show hesitation, overlap, and redistribution. Everything else traders add on top is interpretation, not edge.
Most traders fail with Elliott Waves because they try to label the market instead of read it. Wave counts are adjusted after every pullback to protect bias. When a count needs defending, it has already lost its value for execution.
Wave completion does not mean reversal. Strong trends extend, truncate, or move into complex corrections without ever giving clean countertrend entries. Acting on a “finished” wave without a structural break is just early positioning dressed up as analysis.
The subjectivity of Elliott Waves is the warning label. If two valid counts exist, neither can justify risk on its own. Structure, location, and participation come first. The wave count only adds context to what price is already showing.
Used correctly, Elliott Waves help with expectations and trade management. They stop traders from chasing late impulses and from exiting too early during normal corrections. Used incorrectly, they create the illusion of control over an uncertain market.
Elliott Waves don’t give certainty. They give restraint. And restraint is far more valuable.

Silver Is Consolidating, Likely Looking For More UpsideHey guys, today I am looking at silver,
as you know it made a blow-off top back in December, during the Christmas and holiday period, near 85, from where we then saw a sharp pullback of around 14–15% in just a few days. After that decline, the market stabilized around 70, and this kind of stabilization and choppy price action is very normal after a fast move higher followed by a sharp reversal lower. The next phase is usually consolidation, so for now we can see a relatively limited range, roughly between 70 and 84.
From an Elliott wave perspective, it looks like silver is pausing for wave four. Wave four can take different forms, it can be a flat, a triangle, or a more complex combination. Based on the most recent substructure, especially on the 4-hour time frame, a triangle looks quite likely, which means we could still be missing a few legs before the market eventually resumes higher.
The first key support area for a triangle is around 72.70, which also matches this week’s opening area and a small gap left behind, making it an interesting near-term support. Below that, a deeper and more important support zone comes in around 69–67. This lower area would matter if we see more liquidation and extended sideways action, and it could later provide a very attractive rebound zone.
Overall, this still looks like a healthy pause within an uptrend, with potential for one more push higher in the first one to two months of 2026. The key invalidation level for this view is 54.43, since the market should not trade back into that area. Even a move closer to the 61.8% retracement near 62.35 would already raise concerns that this is not a wave four of the degree we are tracking. For now, price is still well above those levels, so patience is needed, allowing the market to settle and consolidate before the next directional move, all within the broader bullish trend visible on the daily and weekly charts.
Thank you for your support
Grega

Hellena | EUR/USD (4H): LONG to resistance area 1.17420.Colleagues, the price has either completed or is completing a corrective movement in wave “2,” and I expect an upward movement to begin, which has either already started or will start soon.
I believe there is a possibility of the local minimum of 1.16180 being updated to the 1.16036 area, but the main target is the 1.17420 area, which is the maximum area of the average corrective wave “B” and confirmation of the start of the upward wave “3”.
Manage your capital correctly and competently! Only enter trades based on reliable patterns!

Palantir: Air is getting thin NASDAQ:PLTR recently reached our designated red short Target Zone, triggering an active short trade. We have been managing risk proactively, reducing the position by 50% after hitting the initial take-profit level. As a result, our stop-loss is now set at the entry price. As the weekly chart indicates, the stock is primarily in a major corrective phase, identified as wave II in beige. This correction is expected to continue, first pausing in the upper green Target Zone ($117.54–$95.10) before potentially extending down to the lower green Target Zone between $72.58 and $40.66. Alternatively, there is at least a 33% chance that the stock could first post a new high for wave alt.I in beige, above resistance at $207.23.

Hellena | Oil (4H): LONG to resistance area 62.545.Colleagues, after a strong upward movement, I decided to observe the price and understand what is happening.
Now I believe that this movement resembles the beginning of an “ABC” correction, which means that the higher-order wave “A” ended at 54.956.
This means that we can expect the upward movement to continue at least to the resistance area of 62.545.
A correction to the support area of 58.890 is possible.
Manage your capital correctly and competently! Only enter trades based on reliable patterns!

ETHUSD – Weekly Update | Key Level Being TestedThesis
CRYPTOCAP:ETH remains in a long-term bullish structure. Price is rotating higher without a full reset to the 200WMA, suggesting underlying strength and a continuation bias.
Context
- Weekly timeframe
- Long-term ascending wedge intact
- Prior cycle highs still acting as structural reference
What I see
- ETH did not retest the 200WMA around $2450
- Price reclaimed the 50-day MA around $3000
- ETH is now testing the 0.5 Fibonacci level near $3160
- Structure shows higher lows and improving momentum
What matters now
- $3160 needs to flip to support to confirm continuation
- A successful hold here opens a move toward the upper wedge boundary
- Momentum remains constructive while price stays above the 50-day MA
Buy / Accumulation zone
- Current area around $3160 becomes actionable if confirmed as support
- Deeper pullbacks toward moving averages remain secondary opportunities
Targets
- Near-term: $3800 area (200-day MA + upper wedge confluence)
- Long-term cycle target: ~$9000 (Wave 5 extension)
Risk / Invalidation
- Loss of $3000 and failure to hold the 50-day MA would delay the bullish scenario

$BABA Breaking Out Of A Bull FlagAlibaba has been trading within a downward channel for last few months, but the structure still looks corrective due to the clear overlaps. Because of that, traders can still watch for a potential turn higher, especially now after a rebound from 147.68 support area, which was also the high back in March 2025. If price can close and finish the day out of a downward channel, as well as above the bullish level at 163.94, then another fifth wave higher could unfold.
At the same time, it is important to keep an eye on 134.35, as a break below that level would question the impulsive trend. Also note the weekly chart, which suggests the market may be in the later stages of wave C, with potential strong resistance later this year near the 78.6% retracement, slightly above the 200 level.
Highlights
– Overlapping structure suggests the move lower is corrective
– Key support to watch is around 147.68
– Daily close above 163.94 would open the door for wave five higher
– Invalidation sits at 134.35
–

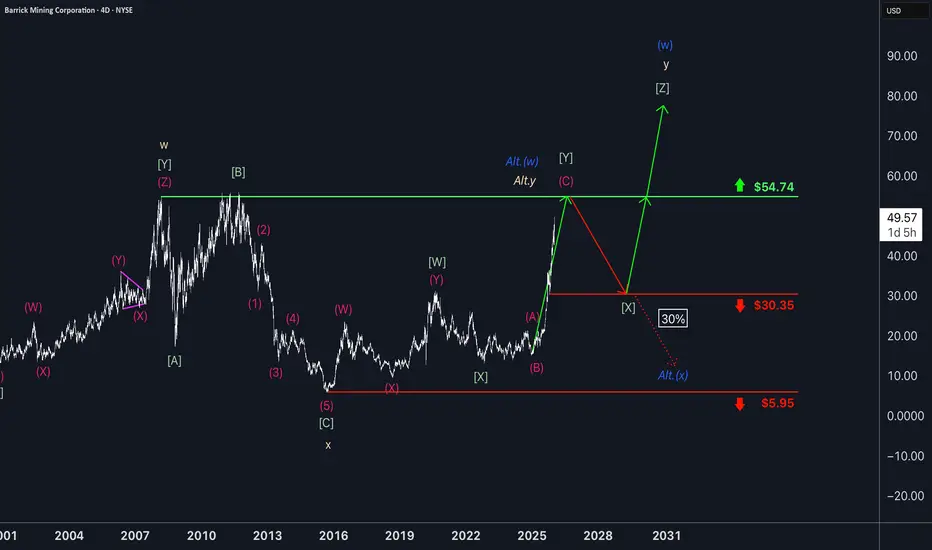
Barrick Gold slowly advancingWithin the ongoing three-wave pattern, the magenta wave (C) is expected to give the miner another boost, ultimately completing the green wave just below the resistance at $54.74. The following wave should then pull the stock back toward support at $30.35, from which wave is likely to start again. This move should once again lift Barrick higher, with the blue wave (w) projected to finish well above the $54.74 level. There is, however, a 30% chance that wave Alt.(w) could wrap up imminently. In that scenario, wave Alt.(x) would push price directly below $30.35, but would still bottom out before reaching the support at $5.95.
OPEN: base building for upsideOpendoor Technologies remains a highly volatile stock, but current price action suggests a potential medium-term reversal. The company continues adjusting its business model to a high-rate environment, focusing on cost control and cash flow stabilization. The US housing market is showing early signs of normalization, while expectations of future monetary easing increase investor interest in deeply oversold growth stocks. OPEN trades far below its historical highs, making it highly reactive to improving macro conditions or positive earnings developments.
Technically, the price has broken out of a long-term descending channel with a strong impulsive move. After the breakout, the stock entered a consolidation phase, forming a price accumulation zone above the broken trendline. Price holds above key EMAs, supporting a bullish structure. The primary scenario favors trend continuation after accumulation, with gradual movement toward higher target zones. The scenario is invalidated if price falls back below the breakout area and holds there.

ETH/USD: Triangle or Double Three in Wave B of a Zigzag?1. We are still in a sideways range.
2. This is a continuation of the previous idea, but the wave B of zigzag is not yet completed.
3. As I said earlier, another pattern may develop in wave B.
4. I am inclined towards a triangle or a double three.
5. However, Ethereum has not yet shown its strength globally, so there is every chance that it will fall even lower, which is why I presented this idea as the main one.

Hellena | GOLD (4H): LONG to max wave "1" 4564.Wave “2” appears to be complete, as waves “abc” are clearly visible, and at the moment I expect a correction in wave ‘2’ of the middle order 4397 to continue the upward momentum of the large wave “3”. The plan is to update the maximum of wave “1” and reach at least 4564.
Next, we will look for an opportunity to continue the upward movement.
Manage your capital correctly and competently! Only enter trades based on reliable patterns!

QQQ – Weekly Update | Breakout Being TestedThesis
QQQ remains in a late-stage bullish structure. Price is testing the upper boundary of a bullish wedge, with Wave 5 still the primary scenario while key supports hold.
Context
- Weekly timeframe
- Long-term bull trend intact
- Market approaching the final phase of the broader cycle
What I see
- Price tested the wedge breakout level twice this week
- Weekly close held right on the breakout line near $623
- 50-day MA has now been tested and appears to be flipping to support
- Structure remains compressive, not distributive
What matters now
- Breakout level needs to be clearly flipped to support to confirm continuation
- Market is not pricing near-term event risk (tariff ruling next week) as bearish
- As long as price holds above the $600 area, upside structure remains intact
Buy / Accumulation zone
- No aggressive adds at current levels
- Long-term accumulation remains near the $440 area (200WMA confluence)
Targets
- Primary Wave 5 reference: $720–$725 area (2.618 Fib)
Risk / Invalidation
- Loss of $600 and failure to hold the wedge breakout would shift the structure to consolidation

US30 (Dow Jones) – 1-Hour Timeframe Tradertilki AnalysisMy friends, greetings,
I have prepared a US30 analysis for you.
My friends, if the US30-Dow Jones index manages to close a candle above the levels of 48392.3-48151.0, I will open a buy position and target the 48,900 level.
At the moment, the most important levels are 48392.3-48151.0. Expecting an upward move without breaking above these levels does not seem logical right now.
My friends, I share these analyses thanks to each like I receive from you. Your likes increase my motivation and encourage me to support you in this way.🙏✨
Thank you to all my friends who support me with their likes.❤️

SPY – ATH into Heavy Macro Week | Trend Still IntactThesis
AMEX:SPY continues to trade in a mature but intact bullish cycle, pushing to new all-time highs despite a heavy macro and event-driven calendar.
Context
- Weekly timeframe
- CPI, PPI, Jobless Claims ahead
- Start of key earnings season
- Supreme Court ruling delayed into next week, adding uncertainty
What I see
- Market printed another ATH and closed the week at the highs
- Price remains well above rising trend support
- No visible distribution or topping structure yet
- Momentum remains strong despite known macro risks
What matters now
- As long as price holds above the rising channel, the trend remains bullish
- Last CPI print came in much cooler than expected
- A second consecutive soft CPI would confirm a disinflation trend and likely fuel further upside
- Market is clearly not pricing near-term stress
Buy / Accumulation zone
- This is not an area for aggressive new buying
- Focus shifts from adding risk to managing and cleaning the portfolio
- Selectively trimming positions that fully rode the last 5–6 years of the cycle
Targets
- Trend-following extension remains open toward higher Fib projections
- No confirmed cycle top yet
Risk / Invalidation
- A sustained loss of the rising channel would signal the need to reduce exposure
- Until then, price action favors holding, not anticipating a top

XAUUSD – Structure Holding at the Blue BoxHi fellow traders,
On the 1H XAUUSD chart, I am applying Elliott Wave principles to outline a potential continuation scenario. After a sharp corrective move, price is reacting from the blue box and holding above the key structural level, suggesting the correction may be complete and continuation to the upside remains possible.
I am entering at the current price, with a Stop Loss at 4270.00. My Take Profit is set at 4574.60, targeting continuation within the larger impulsive structure.
If price breaks below the stop level, this trade is no longer valid.
Structure first. Noise second.
Good luck and trade safe!

BABA: Multi-Year Rounding Bottom Breakout — Wave 4 Support CheckThis chart for Alibaba (BABA) showcases a massive multi-year accumulation pattern, specifically a "Rounding Bottom" or "Cup" formation that began in late 2022. From an Elliott Wave perspective, the stock appears to have completed a primary Wave 3 impulse peak near the $190 level in late 2025 and is currently in the late stages of a Wave 4 corrective pullback.
The long-term outlook for BABA remains highly bullish as it successfully transitions from a multi-year basing phase into a structural uptrend. The recent pullback from the October 2025 highs represents a textbook Wave 4 correction, which has found precision support at the 0.382 Fibonacci retracement level ($143.58). This level aligns perfectly with the breakout point of the major rounding base, transforming old resistance into new support.
Key Technical Levels:
* Support Zone: The $143 - $150 area is critical; as long as the pivot at point 4 holds, the impulsive structure remains intact.
* Wave 5 Target 1: A 1.0 Fibonacci extension projects an initial target of $205.42, which would reclaim the 52-week highs.
* Wave 5 Target 2: The primary 1.618 extension sits at $242.59, aligning with major historical supply zones from early 2021.
* Invalidation: A sustained daily close below the Wave 2 low (approx. $70-$80) would invalidate this specific count, though the $143 level is the immediate "line in the sand" for bulls.
Projected Outlook:
The current price action at $150.96 is forming what looks like a bullish consolidation (handle) following the massive cup breakout. With cloud and AI demand accelerating revenue growth into 2026, the fundamental narrative supports a re-rating toward the $200+ consensus analyst targets. Traders should watch for a breakout above the Wave 3 peak to confirm the start of the final fifth-wave leg higher.

ELF - Completion of 5-Wave Impulse Down - Bullish ABC Underway?This daily chart highlights a potential trend reversal following the significant 1-2-3-4-5 impulse decline observed throughout late 2024 and 2025. The completion of this 5-wave sequence at the $49.40 low appears to have set the stage for a major corrective recovery or the start of a new bullish cycle. We are currently tracking an ABC zig-zag structure, with Wave 'b' recently finding support near the $80 level, aligning with the bottom of the descending parallel channel.
Key Technical Levels:
* Wave 'C' Target: The immediate focus is the 1.0 Fibonacci extension at $168.82, which represents an equal-leg move (a=c).
* Long-Term Extensions: If the recovery develops into a larger impulsive move, the 1.618 extensions at $202.67 and $231.52 serve as secondary targets.
* Invalidation: A breakdown below the recent pivot at point 'b' (approx. $75-$80) would delay the bullish outlook and suggest further consolidation within the channel.
Projected Outlook:
The price action is currently reacting to the median line of the descending channel. A sustained breakout above the $100-$110 resistance zone would confirm the Wave 'c' trajectory toward the May 2026 target window. This setup offers a favorable risk/reward ratio for those looking to play the recovery of a quality growth stock that was heavily oversold in 2025.

ETH/USD: A global bearish zigzag on Ethereum1. The main idea is a global zigzag {a}-{b}-{c} to the downside.
2. Wave {a} can be counted as a double zigzag WXY, but I don’t want to do that.
3. However, I still want to break this move down into a leading diagonal triangle (LDT), which is what I’m showing on the chart.
4. Locally, there is no clear strength, and the price action looks corrective.
5. So it’s crucial to know whether wave {b} is complete, as this move may develop into a more complex correction.
6. If wave {b} is complete, we may already be seeing the development of wave (iii) of {c} on the local scale.
7. The downside move could extend for a minimum of two more months toward the lower channel boundary.
8. If wave {b} becomes more complex, we may still see its full development into another corrective pattern, followed by the advance of wave {c}.
9. The basic targets of the decline are the 0.618 and 1 Fibonacci levels. For now, I don’t want to include the 1.618 Fibonacci level on the chart.
10. There’s a strong chance that in the future the price could reach the range between $2,033 and $1,141.

Silver Pulls Back After Double Top TestSilver futures bounced off resistance at $82.67 on Tuesday. According to our primary scenario, the next key move will be for price to break through this level, which would open the way toward the red Target Zone between $92.25 and $111.28. In that area, we expect the prominent top of the green-labeled wave to form, followed by a larger corrective move. Based on this outlook, traders could consider entering short positions within the $92.25 to $111.28 range, using a stop set 1% above the upper boundary of the zone. Alternatively, it’s possible that the green wave alt. already peaked at $82.67 and price is now correcting directly below support at $69.26. If this scenario plays out—which we assign a 35% probability—a direct pullback into the alternative green long Target Zone between $53.26 and $47.16 would be expected.
