NVIDIA (NVDA): Where Are We in the Cycle?Ticker: NVDA
Category: Market Structure / Elliott Wave Analysis
Author’s note: Educational analysis — not financial advice.
🧠 Market Context
NVIDIA has been one of the strongest growth stories in the last market cycle. However, after such a powerful move, many traders are now asking: Where are we in the broader structure — and what could come next?
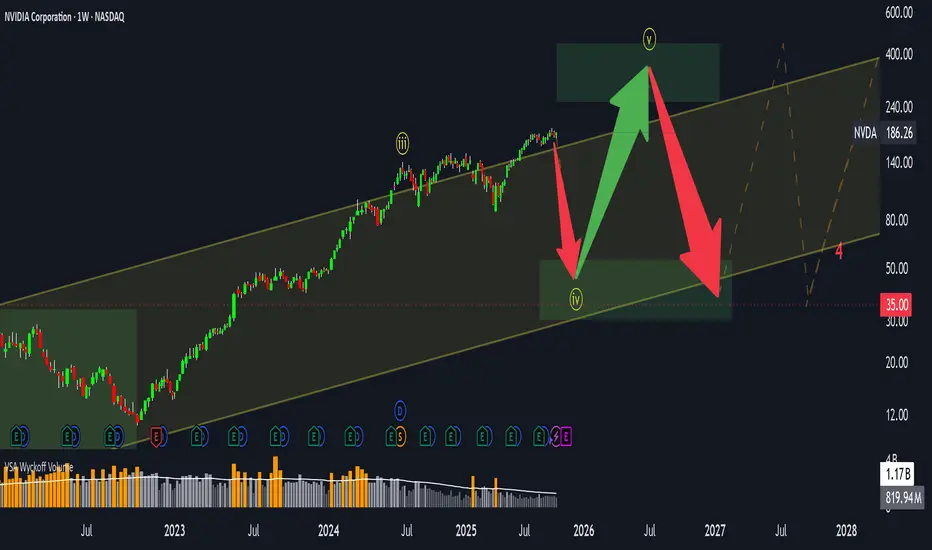
From a structural perspective, NVDA appears to have completed its third Elliott Wave, with the fourth wave currently in progress. This phase often reflects a period of consolidation, where the market digests previous gains before potentially starting the fifth wave.
📊 Elliott Wave Structure
Through the lens of Elliott Wave theory:
Wave 3 — likely completed after the parabolic advance that marked NVIDIA’s latest all-time highs.
Wave 4 — a corrective phase, potentially forming a sideways or slightly downward structure.
Wave 5 (ahead?) — may still occur, possibly extending above the upper boundary of the current price channel.
However, once the fifth wave completes, markets typically enter a longer consolidation or corrective phase — often retracing 50–60% of the total move from the highs.
⚙️ Volatility and Price Range
Currently, NVDA is trading within a broad channel, roughly between $100 and $400+.
Volatility remains elevated — which suggests that the sideways phase could persist for several months, or even longer.
Such behavior is common in late-cycle stages when large market participants distribute part of their holdings while retail interest remains high.
📈 Key Takeaways
The main impulsive move seems to have already played out.
The market may enter a range-bound or sideways phase, with local rallies still possible.
Correction risks are gradually increasing, especially if the fifth wave develops and fails to sustain new highs.
In short, this might not be the best time to chase — but rather to observe how price behaves within the current channel.
💬 Final Thoughts
This analysis is purely educational and reflects one possible scenario based on market structure.
No one can predict the exact timing or depth of the next move — the market always decides.
👉 What do you think?
Are we already in the correction phase, or is there still one more leg up left for NVDA?
Share your view in the comments below 👇
Elliotwaveanalysis
TSLA: Fundamentals Are Collapsing While Valuation Stays in OrbitTesla is trading near multi-month highs… but the fundamentals tell a very different story.
EPS has dropped by 50%, revenue growth has almost stalled, and yet the stock still carries a Forward P/E of 164.
This combination — slowing growth and extreme valuation — looks like the definition of an institutional bubble setup.
🧮 Fundamental Context
Over the past few years, Tesla’s growth has slowed dramatically:
Revenue rose from 31B → 53B → 81B → 96B → 97B — barely any increase.
EPS climbed from 0.2 → 1.6 → 3.6 → 4.3 — and then fell by half.
Quarter-over-quarter metrics remain negative, with no visible recovery trend.
Meanwhile, the Forward P/E of 164 implies double-digit expansion ahead — which clearly isn’t happening.
The fundamentals simply do not justify this kind of valuation.
Right now, Tesla’s numbers resemble the early phase of a valuation compression cycle — where prices eventually catch up with reality.
📉 Technical Structure
Technically, Tesla has been moving in a broad sideways range, forming what looks like a long-term Wave 4 structure.
We’re currently inside the “B” leg, which could already be complete or near completion.
Once that wave ends, the next expected move is a Wave C decline.
Key levels to watch:
📍 Upper resistance zone: $400 – $550
📍 Primary cluster: around $250
📍 Support zone: $150 – $200
The chart shows clear volume concentration around $250 — once that level breaks, the next liquidity pocket sits between $150 and $200.
That’s where a potential bottoming cluster could form before the final upward leg.
⚠️ Market Outlook
While other FANG names maintain solid balance sheets and stable earnings, Tesla’s fundamentals are deteriorating sharply.
Yes, the stock may still see short-term pumps driven by sentiment or Musk’s fan base — but markets always return to fundamentals.
And those fundamentals are pointing downward.
📊 Summary
EPS and revenue both trending lower 📉
Forward P/E at 164 — completely disconnected from growth metrics
Technical range suggests potential decline toward $200–$150
Current price action likely part of a larger corrective structure
Long-term investors should exercise extreme caution ⚠️
Tesla isn’t a short-term “growth story” anymore — it’s a valuation risk story.
Until earnings stabilize and margins recover, this stock looks massively overpriced.

Bitcoin: Is the Market Reaching a Historical Turning Point?📅 Update: October 2025
💡 Format: Educational analysis — not financial advice
Historical Context
Looking back at Bitcoin’s (BTC) price history, a clear pattern emerges: roughly every four years, the market experiences a major correction following a strong bullish cycle.
Key examples include:
2011
2013–2014
2018
2022
Each time, Bitcoin saw a drawdown of –75% to –93% from its previous highs. These deep retracements have historically marked the end of a growth phase and the beginning of a new accumulation cycle.
Current Elliott Wave Structure
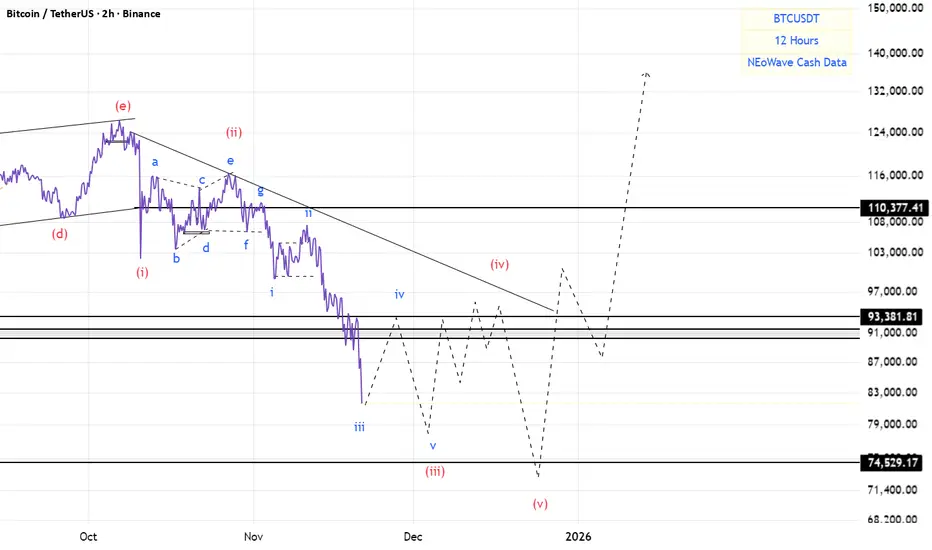
According to Elliott Wave analysis, Bitcoin appears to have completed its third and fourth waves, while the fifth wave is currently unfolding.
However, the recent price action suggests that this fifth wave might already be nearing its conclusion.
The price remains within an upward channel, testing the trendline for the fourth time — a technical signal that often indicates weakening bullish momentum and a potential transition to a corrective phase.
Main Scenario: Possible Trend Reversal
For a confirmed shift in trend, Bitcoin would need to break below the channel’s lower boundary.
A typical technical sequence would look like this:
A breakdown below the trendline
A retest of the broken level from below
The beginning of a stronger downward move
This process usually unfolds over months, not days — a slow structural change rather than a sudden reversal.
Potential Downside Range
Based on historical patterns, a post-peak correction could bring Bitcoin into the $40,000–$30,000 range.
This is not a forecast, but rather an educational scenario grounded in the recurring market behavior seen in previous cycles.
Conclusion and Community Discussion
📊 At this stage, Bitcoin’s overall structure remains bullish, but signs of momentum exhaustion are becoming more apparent.
The key factor to watch is how price reacts to the main trendline — whether it holds as support or gives way to a deeper retracement.
❓Which scenario do you find more likely?
Continued growth and new highs
Or a corrective phase toward lower levels?
🗨 Share your thoughts and charts in the comments — let’s discuss it together.
🔔 Follow for more educational breakdowns, and suggest which tickers you’d like to see analyzed next.

Solana: Room for moreSOL recently dipped further into the now green Target Zone between $155.80 and $113.20. Within this area, we expect the low of wave ii in orange to be established imminently. Afterward, we anticipate a strong wave iii rally, which should peak above resistance at $295.31.

"LLY's Bear Market Mode ON | Crash Incoming"“ LLY is gearing up for a sharp correction down to the $35–$17 zone — a critical reset that could flush out weak hands before the next explosive bull run. Stay sharp, this is where big opportunities form. ⚠️
🔥 Summary:
Eli Lilly (LLY) looks ready for a major market reset after completing a historic five-wave climb. This could be the start of a long-term corrective Wave 2 , potentially wiping out years of gains before the next explosive super-cycle takes off. The bull run isn’t over — but it’s taking a serious pause. ⚠️📉
🌊 Wave Theory Outlook
LLY’s multi-decade Elliott structure shows a completed Cycle Wave 1 peaking near the 2.618 extension zone around $1029. Historically, such extensions often mark exhaustion.
Next comes Wave 2 , which could retrace deep into the $35–$17 zone (the 0.618–0.786 Fibonacci region and prior structural base). Expect a complex W-X-Y pattern , shaking weak hands before a powerful Wave 3 bull expansion later this decade.
📉 Price Action & Smart Money Context
The chart shows exhaustion wicks, momentum divergence, and slowing volume — classic signs of distribution .
Smart money is likely off-loading near the highs , preparing to reload at discount levels once liquidity below 2020–2022 lows is taken.
Expect liquidity sweeps, imbalance fills, and a long-term accumulation base forming near the orange demand zone before the next breakout.
💰 Fundamental Alignment
Despite incredible fundamentals — obesity and diabetes drug leadership, global demand growth, and innovation — valuation gravity always returns .
A deep correction would align price with sustainable earnings and provide institutional re-entry opportunities at fair value.
🧠 Traders ,
"the charts are whispering — a major LLY correction is loading.
Our projections highlight the $35–$17 zone as the key accumulation region before the next super-cycle.
Stay alert, plan your levels, and don’t fight the wave. 🌊📉
Where do you think LLY bottoms out? Share your thoughts below 👇”
— Team FIBCOS
#LLY #EliLilly #BearMarket #Correction #WaveTheory #SmartMoney #ElliottWave #Fibcos #TechnicalAnalysis #PriceAction #Investing #PharmaStocks #StockMarket #MarketCycle #ChartAnalysis #Bearish #Wave2 #TradingView #StockAlert #MarketReset

BTC(based on NEo wave)everything is ok with flat.
time of wave B is more than wave A and wave C is making a beautiful impulse wave.
bitcoin price under 74500$ is a bear trap!

BTCUSDT – Blue Box Reversal IncomingHi fellow traders,
On the 1D BTCUSDT chart, I am applying Elliott Wave principles to outline a potential long setup. Price has tapped into the blue box after completing a ZIGZAG correction, and this region may provide the foundation for the next impulsive leg within the higher-degree structure.
I am entering at the current price, with a Stop Loss at 73,900.00. My Take Profit is set at 132,366.25, based on the projected continuation of the larger impulsive count.
If price breaks below the structural low around the stop level, this trade is no longer valid.
Good luck and trade safe!

BTC(based on NEo wave)This branch has impulsive structure.
so why now there is an impulse wave here?
because this 5 waves are wave (c) of a flat.
when this 5 wave finished strong bullish wave will start.
BTC TrendI don't believe in the curve trend line for BTC; I think the Schiff Pitchfork is the best way to illustrate the BTC trend.
From the last BTC analysis, I indicated on the chart that a bear market is approaching. My targets for this downtrend are 80, 78, 75, and 69.

Pgsus is about the end WXY correctionPegasus Airlines about the finish WXY correction as c of abc correction as an ending diagonal which is strict rules that wave 5 must be shorter than wave 3 so we have a clear stop loss point which is 190,5.

Hellena | SPX500 (4H): LONG to resistance area of 6775.Dear colleagues, according to the last forecast the price is at the support level, but as it turned out, the correction in wave “4” is a bit more complicated than I thought.
Wave “4” consists of three waves “ABC” and should be over soon. The upward movement is still in priority, but I will target the not so distant resistance area of 6775.
Once it is reached, we will think about how to reach higher levels.
Manage your capital correctly and competently! Only enter trades based on reliable patterns!

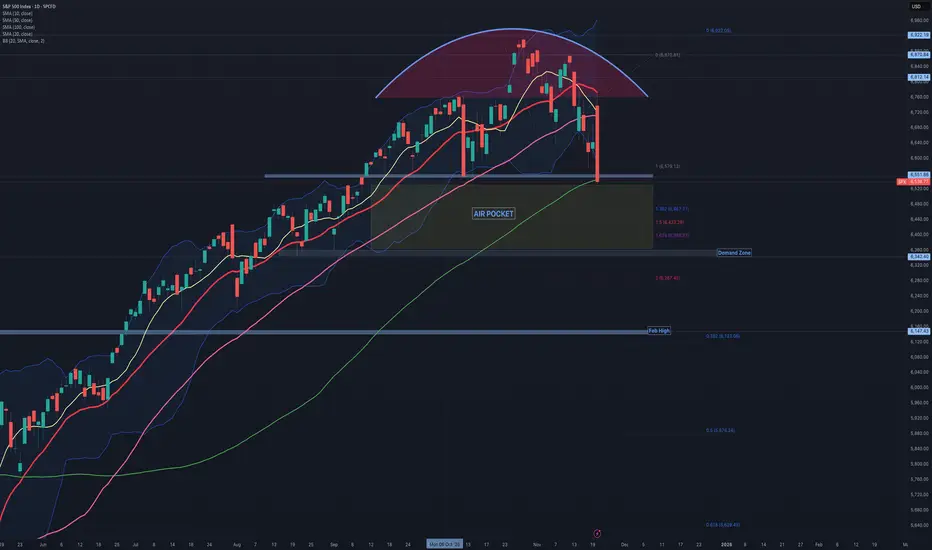
$SPX: A worrying Intraday Turnaround!While everyone, even the taxi driver, was celebrating NVDA's positive earnings report, the SP:SPX suddenly reversed. After touching the 20-day simple moving average, it dropped sharply with no buyers stepping in. With a 3.5% swing between the intraday high and low, the SP:SPX closed slightly below the horizontal support level at 6,550 and the 100-day moving average.
It's unfortunate that the right shoulder is missing, as it would otherwise form a perfect head and shoulders pattern—though it might be more accurately described as the head of a one-armed head and shoulders. Jokes aside, the technical outlook for the SP:SPX has significantly deteriorated. The market's bullish sentiment has evaporated, making it more challenging to establish a bottom.
If the S&P 500 doesn’t recover and consolidate support around 6,550 by Friday—an extremely important level that also aligns with the 1:1 extension below—we could face an “Air Pocket” of approximately 175 points. Within this Air Pocket area, we have extensions at 1.382, 1.5, and 1.618. The 14-period RSI is approaching oversold conditions, but it's not quite there yet.
Apple: Pause - but New Highs Likely Ahead Apple has recently shown signs of sluggishness, trading mostly sideways. For now, we expect this pause to give way to renewed gains, allowing the green wave to reach a new high. However, there is also a 31% chance that the current consolidation could break to the downside, leading to imminent sell-offs below the $212.94 support level. In that scenario, we would view the previous advances as merely corrective and anticipate a new, broader corrective low in the blue wave alt.(IV), although this would still form above the lower $168 mark.

GOLD - Elliott Wave AnalysisGold has now confirmed a breakout from the contracting triangle, completing the B wave of the corrective structure. This breakout supports the expectation that price is preparing for a C-wave advance toward the upper Fibonacci cluster.
Current Structure
• Triangle confirmed as wave B
• Breakout aligns with the internal subdivisions
• Wave (2) still unfolding as a W-X-Y / ABC-type correction
• C-wave upside targets: 4140–4180
• Key fib levels: 0.618 = 4153, 0.764 = 4188
What to Expect Next
A clean impulsive rise is anticipated as the C-wave develops.
Invalidation remains below the B-wave low.
Completion of Wave (2) in the highlighted zone would maintain the broader bearish sequence.
Structure remains clear and the roadmap is intact.

Fly "XAUUSD"I’m back after a long time!
In my opinion, gold has recently completed its corrective waves, and the major wave 5 has just started.
The large structure that has formed is called a running flat correction.
I’d be happy if you follow and benefit from the analyses. ❤️

Hellena | EUR/USD (4H): SHORT to the support area 1.14647.Colleagues, the corrective movement in wave “4” seems to be completed at 1.16529.
Further I expect the continuation of the impulse movement in wave “5” at least to the support area at 1.14647.
All this impulse will mark the movement in the bigger wave “C”.
Fundamental Context
The US Dollar remains firm as markets downgrade expectations for further Fed rate cuts. This keeps pressure on the euro, especially since Eurozone macro data is still weak and provides little support. At the moment, EUR/USD is mostly driven by USD dynamics rather than European fundamentals.
Manage your capital correctly and competently! Only enter trades based on reliable patterns!

Nvidia: Downside Pressure Nvidia has recently faced notable downward pressure, but so far has managed to hold above the support level at $176.21. As a result, we continue to anticipate an imminent rally as part of the beige wave V, which should lift the stock into the now-red Target Zone between $227.38 and $260.60. However, if the stock immediately drops below the $176.21 mark, we would expect a new low for the beige wave alt.IV, with the lower $145.50 level still likely to hold.

Blackrock Inc (BLK) | Institutional Footprints Revealed📈 BlackRock (BLK) | Institutional-Grade Supercycle Analysis
Elliott Wave × Market Structure × SMC × Fibonacci × Macro Integration
This is a comprehensive high-timeframe structural map for BlackRock NYSE:BLK , integrating multiple institutional frameworks to define the current Supercycle position and its projected trajectory.
The objective is to identify where we are in the market cycle , where long-term capital will likely reposition , and where the next asymmetric opportunities lie .
1. Supercycle Positioning — Structural Context
BLK has completed a textbook extended Supercycle Wave III , reaching near the 2.618 Fibonacci expansion relative to Wave I .
The magnitude and duration of this wave strongly suggest that the market is now transitioning into Supercycle Wave IV , typically a multi-year corrective phase characterized by liquidity redistribution, volatility clustering, and structural rebalancing.
Wave IV historically aligns with:
Macro capital flow deceleration
AUM contractions during broad equity drawdowns
Repricing of risk premia across institutional portfolios
Rotation from cyclical equity exposure toward defensive allocations
This environment is already manifesting across major indices and B-Tier asset managers.
2. Structural Market Outlook — Wave IV Correction
Wave IV is unfolding through a complex corrective formation (likely W–X–Y) rather than a simple ABC.
This aligns with current market behavior: overlapping price structures, declining momentum, failed breakouts, and liquidity sweeps — all indicative of institutional distribution.
Key corrective targets (Fibonacci Alignment):
0.382 Retracement | $500-450
Structural demand + prior weekly inefficiency + rebalanced liquidity
0.5–0.618 Golden Pocket | $350–$300
High-probability reaccumulation zone used by discretionary and systematic funds
Confluence with multi-year unmitigated demand
These zones carry materially higher probability for macro accumulation and long-duration capital deployment.
3. Smart Money & Orderflow Alignment
The price action around the prior ATH displays:
A clean liquidity sweep above structural highs
Formation of a macro distribution range
Break of structure on the weekly timeframe
Unfilled fair value gaps to the downside, consistent with Wave IV corrective targets
Classic displacement patterns signaling institutional orderflow rotation
This behavior suggests the transition from expansion to correction has already begun, positioning the market in the early-to-mid phase of Wave IV.
4. Macro & Fundamental Confluence
From a macro-fundamental standpoint:
BLK’s earnings sensitivity to equity markets is significant
Periods of elevated volatility materially affect net flows and AUM stability
Regulatory and rate-cycle uncertainty persists
Secular growth drivers remain intact, supporting a strong Wave V recovery phase
The macro environment fully supports a medium-term corrective repricing before a long-term structural continuation.
5. Forward Projection — Supercycle Wave V
Upon completing the corrective leg, BLK enters the next structural expansion: Supercycle Wave V.
Probabilistic Wave V targets:
3.618 Fibonacci Expansion | $3,700–$4,000+
Supported by long-term earnings growth trajectory
Strong confluence with high-timeframe extensions and historical BLK trend behavior
This aligns with typical final-wave macro expansions that drive multi-year secular highs.
6. Executive Summary
Near–mid term (corrective):
Anticipating continuation of Wave IV into $500 → $300 liquidity zones
Expect volatility clusters, complex corrective behavior, and structural retests
Long term (expansion):
Initiation of Supercycle Wave V post-2027/2029 accumulation
Probable macro expansion to the $3.7k–$4k region
Aligns with both structural and fundamental models
This framework provides a clear roadmap for long-horizon investors, wave practitioners, and advanced SMC traders.
If You Found Value
We provide institutional-grade breakdowns combining macro structure, advanced Elliott Wave modeling, liquidity analysis, and high-timeframe confluence mapping.
For deeper insights, premium updates, or multi-asset coverage —
Follow and enable notifications for ongoing institutional-level analysis.
Share this chart if you believe traders deserve deeper, institutional-level insight.
Not financial advice. For educational purposes only. Do your own research.
#BLK #BlackRock #ElliottWave #SmartMoney #MarketStructure #Fibonacci #LongTermInvesting #Stocks #TradingView #WaveAnalysis #Macro #Liquidity #Investing #StockMarket #TechnicalAnalysis

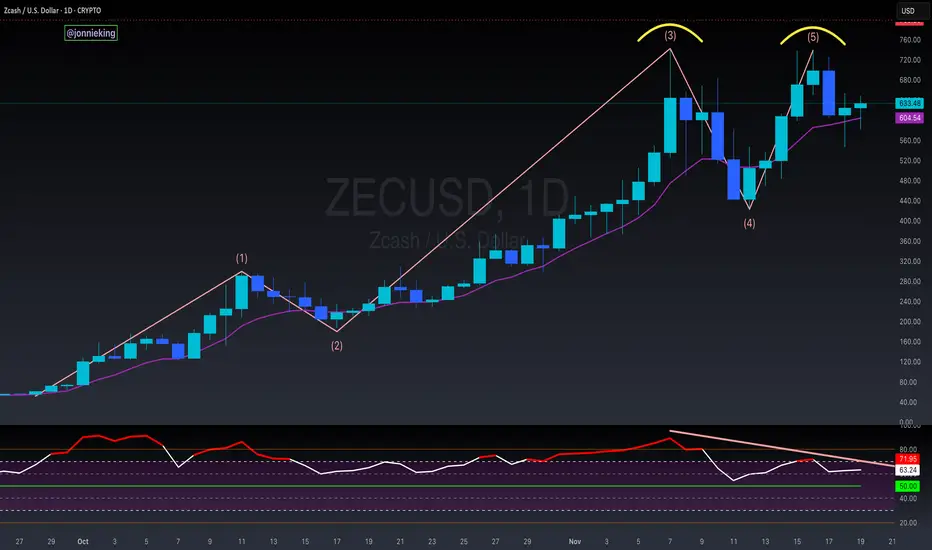
$ZEC 5-Wave Impulsive End of MoveZcash is one of those things that has thrown me off the most these past couple months.
Everything else including CRYPTOCAP:BTC has been nuking, but CRYPTOCAP:ZEC has shown insane strength.
It now appears this dino-coin is nearing the end of its run.
🚩 Double Top formed after impulsive 5-wave move.
🚩 Doji Candle followed by Bearish Engulfing on the Daily
🚩 Exaggerated Bearish Divergence on the RSI
🚩 Euphoria has been diminishing from the TL
⚠️ If it loses the 9EMA, this should confirm the next corrective wave down.
I like the ideology behind Zcash and what it offers to the market, but it has no right to be pumping with ₿itcoin nuking.
XAUUSD COMPLETING WAVE 4according to plan, unfold into zigzag correction 12345 - abc - 12345
downward could be an impulse 12345. reentry at wave 2 whan abc completed.

XAUUSD Wave count updatei think it will be a correction to wave 4. it will be invalidated if it crosses the peak of wave 1 (marked with horizontal line).
monitor the end wave in impulse form 12345

Hellena | GBP/USD (4H): SHORT to min wave "4" area 1.30100.Colleagues, I haven't reviewed the pound for a long time and now I finally did it)
The wave layout shows that the downward movement is not over yet. I think that wave “4” will soon complete its development and the impulse in wave ‘5’ will start, which will complete the big correction “C”. The minimum target is the support area at 1.30103.
Further we will observe the activity in this area.
Manage your capital correctly and competently! Only enter trades based on reliable patterns!

Tesla: DownwardShortly after our last update, Tesla experienced noticeable downward momentum, initially entering our previously magenta alternative target zone, which has already been stopped out. We currently consider the green wave complete, and the alternative target zone has been deactivated and grayed out. However, there's still a chance the stock could rise sharply, confirming an ongoing upward trend. If this alternative scenario, which has a 35% probability, plays out, we would mark blue wave alt.(II) as complete and expect gains above the resistance at $509.50 and $532.92 within a magenta upward impulse. Primarily, we anticipate further sell-offs and expect the regular wave-(II) correction low to occur first in our green target zone between $157.88 and $46.70. This green zone could potentially be suitable for long entries, protected by a stop 1% below the zone's lower edge.
