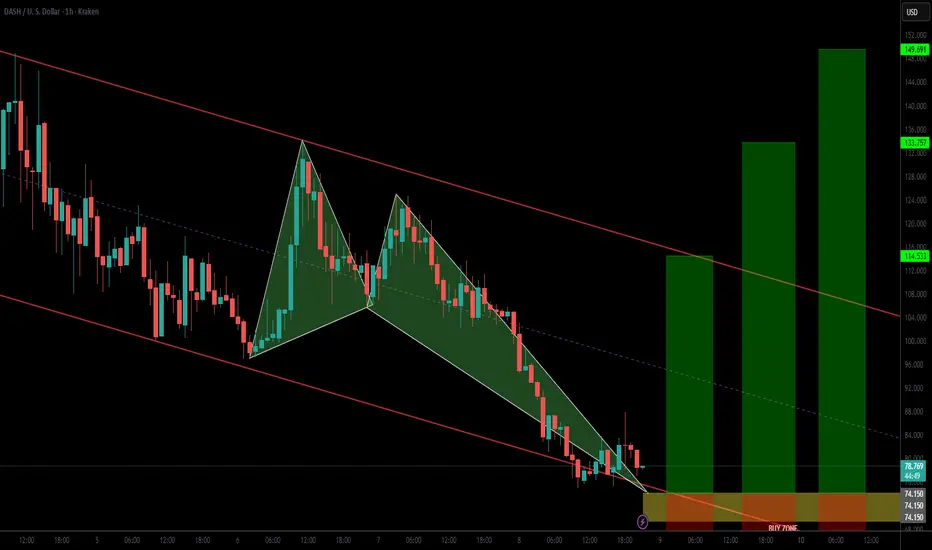
BULLISH CRAB PATTERN COMPLETING ON DASHA Bullish Crab pattern is nearing completion on the DASH/USD chart, suggesting a potential reversal zone as price action approaches the final leg (point D). The harmonic structure aligns with key Fibonacci ratios across the XA, AB, BC, and CD legs, reinforcing the validity of the setup.
Additionally, a potential Wave 2 correction appears to be completing within the .618–.786 Fibonacci golden pocket, adding strong confluence between harmonic and Elliott Wave structures. This overlap highlights a high-probability reversal region that could trigger a significant bullish reaction.
I’ve outlined potential entry levels and profit targets based on this confluence zone for educational and analytical purposes. Traders should watch for bullish confirmation signals such as candlestick reversals, volume increase, or bullish RSI divergence before considering entries.
⚠️ Disclaimer: I am not a financial advisor. This analysis is for educational purposes only and should not be taken as financial advice. Always conduct your own research and manage risk appropriately.
Elliotwaveanalysis
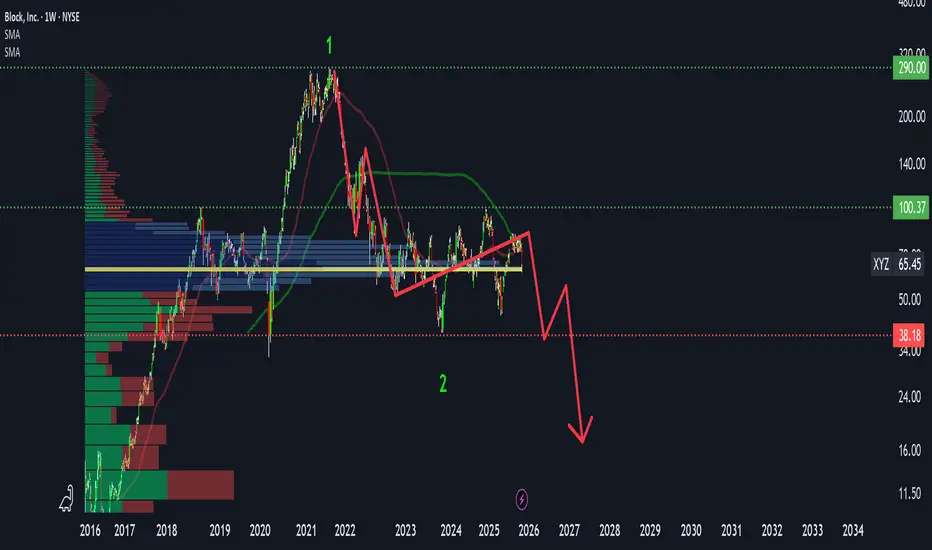
Block (XYZ): Weak Earnings, Bitcoin Exposure, and the Next Move📊 Fundamental Overview
I entered Block (XYZ) about a year ago when the company’s cash flow trends were very strong.
However, right now the picture is becoming more concerning.
EPS growth is not stable.
Previously, EPS was growing rapidly (65%, 38%, 155%), but the last two quarters showed only –10% and +13% growth.
Revenue growth stagnated.
Year-over-year revenue used to grow strongly —
2019: $4M → 2020: $9M → 2021: $17M → 2023: $21M → 2024: $24M — but is now roughly flat (~+1% YoY).
Forward P/E: ~22.7 — not particularly attractive considering the company’s decelerating fundamentals.
Share dilution stopped.
Since 2022, Block has halted share issuance, and total shares outstanding remain stable within ±2%, which is a positive signal compared to other fintech peers.
💥 Q3 Earnings Miss
In the latest earnings report:
Expected EPS: $0.63 → Actual: $0.54
Revenue: $6.11 B (below expectations)
The miss triggered a 15–18% drop after earnings, followed by a partial rebound as dip buyers stepped in.
But fundamentally, the company is clearly losing growth momentum.
₿ Bitcoin Exposure Risk
Block currently holds about 8,700 BTC (~$1 billion) on its balance sheet.
While this gives long-term upside potential, it also adds massive volatility risk.
If Bitcoin enters a –70% correction (which I expect in the next 3–4 months), that could hit Block’s balance sheet hard and accelerate the drawdown.
📈 Technical Structure
Technically, the stock has already corrected about –86% from its all-time high.
We’re currently sitting inside a major accumulation cluster between $50–80 — a very strong volume node.
If this cluster breaks down, the next major support zone is $8–15, which would imply a potential –90%+ drawdown, typically a “pre-bankruptcy” level of decline.
After the latest earnings report, XYZ dropped by nearly 18%, forming a noticeable gap down. However, the volume on this sell-off was relatively low compared to the massive volume spikes seen in July 2025.
Typically, such sharp post-earnings drops come with high capitulation volume, signaling panic selling and potential bottom formation, but this time, that confirmation is missing.
This raises the risk that the current decline might not yet be over, and that smart money may still be waiting lower, around the next demand zone.
From a wave-structure perspective, it looks like wave 1 is complete, followed by a sharp corrective move that has already exceeded the typical 38–62% retracement range, falling by about 86%, an unusually deep correction, but not impossible within a prolonged cycle.
The ongoing consolidation phase has lasted significantly longer than previous ones, which increases the probability of a final downward push, forming a classic zigzag pattern (A–B–C), a drop, consolidation, and one more leg down to complete seller capitulation.
Volume patterns in such structures usually peak in the middle of the formation, aligning with current price behavior.
Technically, both outcomes remain open,
we could see a short-term bounce from this zone or a double zigzag (dZ) structure unfolding lower before the true bottom forms.
Upside momentum currently lacks fuel, fundamentals don’t support a strong rally yet.
If price breaks above $100, the next upside target sits around $280, offering roughly 4× potential from current levels.
So the setup remains binary, either accumulation continues before reversal, or we break down further in sync with BTC weakness.
⚠️ Risk View
Fundamental growth has stalled.
Earnings miss raises red flags.
Bitcoin exposure magnifies downside risk.
If price breaks below $32–30, that would confirm a breakdown, potential free-fall to $8–15.
On the positive side, the company stopped share dilution, maintains good liquidity, and still has strong brand power in fintech.
🧩 My Position
I currently hold a protected position (protective puts) till march 2026, limited downside, but I’m considering a full exit.
There’s no visible fuel for strong upside, and with BTC risk rising, the short-term picture remains shaky.
If we see capitulation into the $30–40 range with BTC bottoming, that could be a smart-money accumulation zone again.
🔑 Key Levels
$100 → breakout confirmation, opens path to $280
$50–80 → main accumulation cluster
$32–30 → invalidation / stop-loss zone
$8–15 → next major demand zone if breakdown continues
🧭 Summary
Block’s fundamentals are slowing, its Bitcoin exposure is a double-edged sword, and technically we’re at a critical level.
If BTC corrects sharply, Block could retest the $30–40 area or even lower, but if it holds and reverses above $100, the next bull wave could be massive.
At this stage, risk management and patience are key.
Ethereum: Slipped belowEthereum recently slipped back below support at $3,357 and is currently struggling to reclaim this level. In line with our primary scenario, we expect further downside below this threshold to complete magenta wave within the lower magenta Target Zone ($2,749 – $2,149). From there, a significant corrective rally is likely, targeting the high of magenta wave (B) in the upper magenta Target Zone ($5,805 – $7,326).

NAS100 Rejection last 4H candle# 📊 NAS100 (SPOT NASDAQ100) Rejection TECHNICAL ANALYSIS 🎯
## Week of November 10-14, 2025 | Intraday & Swing Trade Setup
Close Price: 25,121 | Entry Point: November 8, 2025, 12:54 AM UTC+4 💹
---
## 🔍 EXECUTIVE SUMMARY - MULTI-TIMEFRAME PERSPECTIVE
The Nasdaq-100 index exhibits a compelling convergence of technical signals across all analyzed timeframes. Elliott Wave structure suggests we're navigating wave cycles with potential breakout scenarios emerging through harmonic pattern confirmations. Bollinger Bands are contracting, indicating volatility consolidation before directional expansion. RSI readings across 5M-1H timeframes show overbought extremes transitioning to neutral zones, creating premium entry opportunities for disciplined traders. Volume analysis reveals institutional interest patterns correlating with Ichimoku Cloud positioning.
---
## 📈 TIMEFRAME-BY-TIMEFRAME ANALYSIS
### 5-MINUTE (Intraday Scalping) ⚡
Candle Pattern: Japanese candlesticks reveal micro-trend reversals with consecutive hammer formations suggesting buyer rejection zones. Evening Star patterns detected at resistance levels.
Elliott Wave: Sub-wave completion suggests wave 4 consolidation before wave 5 impulse move. Wave structure favors breakout traders targeting 25,280-25,420 resistance confluence.
Bollinger Bands: Middle band acts as dynamic support; lower band rejection patterns create high-probability short setups. Band squeeze indicating imminent volatility breakout.
RSI (14): Oscillating between 35-65 range—avoiding extremes. Divergences between price highs and RSI highs signal potential reversals at 25,180 and 25,240 levels.
Support & Resistance: Micro S/R zones at 25,095 | 25,140 | 25,180 | 25,220 | 25,280. Volume nodes clustered around 25,150.
VWAP: Price oscillating around session VWAP—each touch generates scalp opportunity. Aggressive traders fade upper band extremes.
### 15-MINUTE (Quick Swing) 🎢
Candlestick Analysis: Three-candle patterns emerging—flag continuation structures with potential for 60-80 pip breakouts. Engulfing bars confirming directional bias shifts.
Harmonic Patterns: Gartley Pattern formation detected—potential reversal zone (PRZ) at 25,165-25,195. Risk-reward ratio favorable at 1:2.5 for harmonic traders.
Wyckoff Theory: Accumulation phase evident with volume concentration and price consolidation. Distribution signs emerging—caution at resistance clusters.
Bollinger Bands: Band squeeze tightening—historical data shows 40-120 pip moves follow. Upper band resistance at 25,285; lower band support at 25,085.
Volume Analysis: Volume profile reveals point of control (POC) at 25,140—high-probability rejection zone. Volume surge required for breakout confirmation above 25,250.
Ichimoku Cloud: Price above cloud (bullish). Tenkan-sen at 25,205 acts as dynamic support. Kijun-sen (25,160) provides secondary support for pullback traders.
### 30-MINUTE (Intraday Swing) 🔄
Pattern Formation: Symmetrical Triangle formation with apex target at 25,290. Ascending triangle variant shows bullish bias—breakout above 25,270 targets 25,380-25,420 extension.
Dow Theory: Confirming higher highs & higher lows structure. Secondary trend remains bullish; pullbacks to moving average (EMA 20) present optimal entry zones.
RSI Divergence: Positive RSI divergence confirmed—price making lower lows while RSI forms higher lows at 42 level. Classic reversal setup targeting 25,260 minimum.
Exponential Moving Average: EMA 9 above EMA 21—bullish alignment. Price hugging EMA 9 (25,125) indicates strong intraday uptrend. EMA 50 (25,080) provides stop-loss anchor.
Support Zones: 25,080 (EMA 50) | 25,120 (EMA 9) | 25,160 (Kijun-sen) | 25,200 (Demand Zone)
Resistance Zones: 25,250 (Breakout trigger) | 25,290 (Triangle apex) | 25,350 (Weekly resistance)
### 1-HOUR (Core Swing Trade) 🎯
Elliott Wave Complete Picture: Primary trend shows potential Wave 3 completion near 25,350. Wave 4 correction (current consolidation) targeting 25,140-25,180 support zone. Wave 5 breakout anticipated—target: 25,450-25,520.
Pennant Pattern: Bullish Pennant formation within consolidation—breakout confirmation above 25,280 validates pattern. Minimum target: 25,450 (measured move from pole).
Bollinger Bands (1H): Upper band at 25,380 represents squeeze breakout target. Middle band (25,200) = bullish support. Lower band rejection creates risk-reward optimization point.
VWAP Daily: Price trading above VWAP—bullish gradient confirmed. Each hourly candle close above VWAP strengthens trend continuation probability. Rejection below VWAP = caution signal.
Volume Profile: Heavily traded at 25,150-25,180 (support) and 25,240-25,280 (resistance). Imbalances favor upside—low volume zone above 25,300 suggesting vacuum to fill.
Ichimoku Alignment: Price above Senkou Span A & B—cloud thickness indicates strong support. Chikou Span lag above candles = bullish confirmation. Cloud color shift (bullish green) reinforces uptrend.
Gann Theory: 45-degree angle trendline from swing low confirms rally angle. Resistance at 38.2% Fibonacci extension (25,280) precedes aggressive breakout phase.
### 4-HOUR (Swing Trade Foundation) 💼
Daily Chart Alignment: 4H timeframe shows potential Inverse Head & Shoulders pattern—right shoulder completing (current zone: 25,120-25,180). Breakout above 25,280 neckline targets 25,450-25,520 extension.
Wyckoff Accumulation: Institutional buying evident—small barometer move (SBM) triggers accumulation phase. Spring tests below support anticipated 25,080-25,100 zone.
RSI 4H: RSI at 54-60 range—neutral bullish. Still room for upside extension without extreme overbought. RSI above 70 targets 25,350+. Below 30 requires defensive posturing.
Cup & Handle Pattern: Potential bullish Cup formation completing—handle stabilization near 25,150-25,200. Breakout above handle (25,280) targets cup depth extension = 25,420.
EMA Ribbon: EMA 8, 13, 21, 50, 200 = bullish alignment. Compression and expansion cycles indicate momentum phases. Ribbon support at 25,120 = critical hold level.
Support Tiers 4H: 25,050 (structural) | 25,120 (EMA 8) | 25,160 (EMA 21) | 25,200 (demand cluster)
Resistance Tiers 4H: 25,280 (key breakout) | 25,350 (extension) | 25,420 (major target) | 25,500 (weekly projection)
### DAILY CHART (Swing Trade Thesis) 📅
Macro Elliott Wave: We're potentially in Wave 3 of a larger cycle—still room for aggressive expansion. Wave structure favors break of 25,350 targeting 25,500-25,650 daily close.
Double Bottom Recognition: Historical pattern shows Double Bottom formation near 25,000 support—confirmed breakthrough above 25,250 neckline triggered. Second target near 25,450-25,500.
Bollinger Bands Daily: Upper band at 25,480 = realistic daily target. Mean (25,200) = healthy pullback support. Band slope indicates volatility expansion—expect 250-400 pip daily ranges.
Volume Signature: Daily volume profile shows strong buying volume bar at 25,050-25,100 zone (institutional accumulation marker). Selling volume decreasing—demand controlling.
Ichimoku Daily: Cloud thickness growing—bullish trend strengthening. Cloud support around 25,150-25,200. Kumo Breakout anticipated—targets cloud top edge at 25,350-25,420.
Harmonic Analysis: Butterfly Pattern potential completion—PRZ at 25,280-25,320 suggests reversal zone OR breakout confirmation. Confluence amplifies probability.
Gann Angles & Fibonacci: 50% retracement (25,100) + 61.8% extension (25,420) = key reversal zones. Gann fan angles suggest 25,350-25,400 as structural resistance before continuation.
Key Daily Support: 25,000 (psychological/structural) | 25,050 (accumulation) | 25,140 (weekly midpoint) | 25,200 (demand zone)
Key Daily Resistance: 25,280 (breakout trigger) | 25,350 (extension) | 25,420 (measured move) | 25,500 (weekly target)
---
## 🎪 TRADING SETUP PLAYBOOK - NOV 10-14
### BULLISH SCENARIO (Probability: 72%) ✅
Trigger: 4H candle close above 25,280 + volume surge + RSI above 55
Entry Zone: 25,200-25,250 (with breakout confirmation)
Target 1: 25,350 | Target 2: 25,420 | Target 3: 25,500
Stop Loss: 25,120 (below EMA support)
Risk/Reward: 1:2.8 (excellent entry)
### BEARISH SCENARIO (Probability: 28%) ⚠️
Trigger: Daily close below 25,200 + volume increase + RSI divergence
Entry Zone: 25,280-25,300 (short setup)
Target 1: 25,200 | Target 2: 25,140 | Target 3: 25,050
Stop Loss: 25,350 (above resistance)
Risk/Reward: 1:2.1 (acceptable but lower probability)
---
## ⚠️ VOLATILITY & OVERBOUGHT/OVERSOLD CONDITIONS
Current Volatility Status: Moderate compression → Expect expansion soon
5M/15M: RSI in 40-65 range (neutral)—room for 25-40 pip moves
30M/1H: RSI near 55-60 (bullish bias, not extreme)
4H: RSI 54-62 range—still room to run without overbought
Daily: RSI 58-68 (approaching caution zone)—be defensive if daily RSI>75
Overbought Recognition Points:
Watch for RSI>75 combined with Band upper rejection + Ichimoku cloud top break fails. Take profits on technical extremes.
Oversold Setups:
RSI<30 on 1H + price below EMA 50 = high-probability bounce back to 25,200-25,250.
---
## 🎯 ENTRY & EXIT OPTIMIZATION
### OPTIMAL ENTRY TIMING
For Bullish Scalpers (5M): RSI bounce from 40-45 zone after Band lower touch = 15-25 pip scalp target
For Swing Traders (15M-30M): 15M candle close above 25,250 with 4H alignment = 60-120 pip swing target
For Core Swings (1H-4H): 4H pennant breakout above 25,280 on volume = 150-300+ pip target (hold 24-48 hours)
For Position Traders (Daily): Daily close above 25,350 = continuation play targeting 25,500-25,650 (hold 5-7 days)
### EXIT STRATEGIES
Take Profit Levels: 1. Fibonacci 38.2% = 25,280 | 2. Harmonic PRZ = 25,320 | 3. Daily Band upper = 25,420 | 4. Weekly target = 25,500
Stop Loss Placement: Below most recent swing low + 10 pips (risk management priority)
Trailing Stops: Activate at 25,350—trail with 40-50 pip buffer for 4H+ trades
Breakeven Exit: Move stops to entry after 1:1 risk/reward achieved—reduce emotional trading
---
## 🔔 REVERSAL & BREAKOUT RECOGNITION CHECKLIST
### REVERSAL SIGNALS TO WATCH:
RSI divergence (lower highs on price, higher lows on indicator)
Candlestick engulfing patterns at resistance/support zones
Volume breakdown (declining volume on breakout attempts)
Ichimoku Cloud rejection (price fails to penetrate cloud layer)
Harmonic pattern completion (Gartley/Butterfly PRZ exact hit)
Elliott Wave 5th wave failure (truncation pattern)
### BREAKOUT CONFIRMATION RULES:
Close beyond resistance on high volume (>20% volume increase)
RSI confirms breakout direction (above 55 for bullish, below 45 for bearish)
VWAP crosses align with directional move
Bollinger Band breakout with band expansion (squeeze release)
Multiple timeframe confluence (5M + 15M + 1H aligned)
Ichimoku Cloud break (price clears all clouds smoothly)
---
## 💡 WEEK FORECAST SUMMARY - NOV 10-14
Monday (10th): Consolidation continuation—watch for range break direction. European open volatility catalyst expected.
Tuesday-Wednesday: Breakout window opens—25,280 represents key decision point. Expect 150-250 pip daily moves.
Thursday: Potential pullback/consolidation after breakout (profit-taking). Support retest of 25,250-25,200.
Friday (14th): Weekly close pattern formation—extension run anticipated if above 25,350. Week target: 25,420-25,500.
---
## 📍 CRITICAL CONFLUENCE ZONES
25,080-25,100: Major support (accumulation zone, Wyckoff spring testing area)
25,140-25,180: Secondary support (EMA 9, Ichimoku, volume POC)
25,200-25,250: Entry zone (demand cluster, Cup handle support)
25,280-25,320: KEY BREAKOUT ZONE (all timeframe resistance, harmonic confluence)
25,350-25,420: Primary upside target (Elliott Wave 5, daily Band, measured move extension)
25,500+: Weekly resistance/extension target
---
## 🏆 RISK MANAGEMENT SUMMARY
✅ Never risk >2% account per trade
✅ Use 1:2+ risk/reward minimum on all entries
✅ Scale profits at 1:1 and 1:2 levels
✅ Maintain tight stops (10-15 pips on 1H trades)
✅ Avoid breakout FOMO—wait for close confirmation
✅ Respect daily support zones—psychological holds matter
---
## #TRADINGSETUP #NAS100 #TECHNICALANALYSIS #NASDAQ100
#ELLIOTTWAVE #HARMONICPATTERN #BREAKOUTTRADING #SWINGTRADER
#DAYTRADING #INTRADAY #FOREX #TRADING #ANALYSIS #TRADINGVIEW
#BOLLINGER BANDS #RSI #ICHIMOKU #VWAP #TRADINGSTRATEGY
#WYCKOFFMETHOD #GANNTHEORY #DOWTHEORY #TECHNICALS
#SUPPORTANDRESISTANCE #VOLUMEANALYSIS #OVERBOUGHT #OVERSOLD
---
Disclaimer: This analysis is educational only. Always conduct your own research and use appropriate risk management. Past performance ≠ future results. Trade at your own risk.
Analysis Created: November 8, 2025 | Valid Through: November 14, 2025

XAUUSD 3 more waves to complte triple combo wave correctionyes as expected, it went up as wave a. can expect 3 waves combo to complete to (z). will continue to monitor next week and anticipating a buy after abc correction (bearish)

triple combo wave ideawxy. maybe another push to (c) to make it triple combo wave correction before plunging downsouth.
it feels like that, seems like every impulsive move downwards is only resumed with another abc upwards making the impulse wave as a connector instead

BTCUSD following impulse correctionits going for impulse correction.
the last leg will be impulse for wave c correction

Hellena | Oil (4H): LONG to resistance area 64.8.Colleagues, in fact, I have not changed the wave markup, but I have a slightly different view on the near-term price movement plan.
In the last forecast I emphasized that the target is the area of 58.9, but now it looks more likely that the completion of wave “C” in a complex correction (resistance area 64.8). Then I will consider the long-awaited downward movement again.
Manage your capital correctly and competently! Only enter trades based on reliable patterns!

S&P500: Rebound S&P 500 futures managed to stage a modest rebound in yesterday’s session and are now showing renewed upward momentum. In our primary scenario, we expect magenta wave (5) to continue climbing and to ultimately mark a final high that completes the larger blue wave (III). Afterward, we anticipate a corrective phase via magenta wave (A), which should pull the index toward support at 6,371 points. However, if prices drop directly below the 6,371 points support, our alternative scenario will come into play. In that case, the alternative wave alt.(4) would likely extend further downward, finding its low within the magenta alternative Target Zone between 6,055 and 5,822 points.

XAUUSD outlookPossible double zig-zag with a triangle X wave. After successful completion of the triangle expect a continuation to the downside

Nvidia: Acceleration Toward New Highs Nvidia gained strong upward momentum shortly after our last update, surging past the $196.45 mark, which had previously served as resistance. As a result, our prior short-term alternative scenario was triggered, and we have now adjusted the chart accordingly (with minor modifications). We now view the green wave as complete and believe that the joint top of green wave and beige wave III, as well as the low of wave IV, have already been established. The Target Zone we had initially set for the wave- low has therefore been removed. In our updated short-term alternative scenario, we still see a 30% probability of a new low for beige wave alt.IV below the $176.21 support level. In this case, however, price would likely rebound above the lower $145.50 level.

Educational BTC Analysis: Decoding BTC's Wave (C) DownHello Friends, Welcome to RK_Chaarts.
Today we are going to understand Elliott Wave Teaching Points from the BTCUSD Daily Chart,
This chart sequence perfectly illustrates the difference between motive (impulse) and corrective waves, as well as the important structures and rules of a larger correction.
1. The Structure of a Corrective Pattern (A-B-C)The Big Picture: The overall movement, labeled Intermediate Wave (A), (B), and (C) (Blue), is a three-wave corrective pattern. This type of pattern moves against the trend of one larger degree (which have been an uptrend). The three-wave (A-B-C) structure is the classic way markets move in a counter-trend. Wave (A): The initial counter-trend move.Wave (B): A bounce or retracement that moves back in the direction of the previous trend, but fails to reach the start of Wave (A).Wave (C): The final, and often most powerful, leg of the correction, which is designed to complete the retracement. This wave is always structured as a five-wave impulse.
2. The Rule of Subdivisions: Corrective Waves are Internally Motive, Wave (C) is an Impulse: The report states that Intermediate Wave (C) is expected to unfold as a five-wave impulse sequence of a Minor Degree (Red) (Minor Wave 1, 2, 3, 4, 5).
Learning Point: This highlights a fundamental Elliott Wave rule: the C-wave of an A-B-C correction is a motive wave (it has a five-wave internal structure) because its purpose is to create strong directional progress and complete the larger correction. This is commonly known as a Zigzag correction (which has a 5-3-5 internal count for A-B-C).
3. Identifying the Strongest Move (Wave 3)
The Current Phase: The market is currently in Minor Wave 3 (Red) downwards.
Learning Point: In Elliott Wave theory, Wave 3 is typically the longest and never the shortest of the three motive waves (Waves 1, 3, and 5). This means the analysis anticipates the current move to be the most directional, high-momentum, and volatile part of the entire Intermediate Wave (C) correction. This is the "sweet spot" for trend traders.
4. The Principle of Alternation (Predicting Wave 4)
Upcoming Wave: The analysis projects a shallow Minor Wave 4 (Red) rebound.
Learning Point: While the chart doesn't show Wave 4 yet, this prediction is often guided by the Principle of Alternation. If the preceding corrective wave (Minor Wave 2) was a sharp, deep correction, the next corrective wave of the same degree (Minor Wave 4) is expected to be a sideways, shallow, or complex correction (like a flat or triangle). The prediction of a "shallow" wave 4 suggests Minor Wave 2 was likely a deeper, sharper retracement.
5. The Critical Invalidation Rule
The Invalidation Level: The report sets the critical invalidation price at 74,223, which represents the low or starting point of wave ((1)).
Learning Point: Wave ((2)) can never retrace more than 100% of Wave ((1)). By identifying a specific price level, we can assume that our study says price should not broke below that particular level, it provides traders with clear risk management parameters.
I. Current Wave Count Status
The analysis indicates that the previous upward corrective structure, designated as Intermediate Degree Wave (A) and Wave (B) (Blue), is complete. The market is now engaged in a significant downward movement within the larger Intermediate Degree Wave (C) (Blue).
This Intermediate Wave (C) is expected to unfold as a five-wave impulse sequence of a Minor Degree (Red) to the downside, fulfilling the final leg of the overall corrective cycle.
II. Detailed Downward Projection
The Minor Degree five-wave structure within Intermediate Wave (C) is currently positioned as follows:
Minor Wave 1 and Minor Wave 2 (Red): These waves are identified as complete.
Current Phase: The market is now unfolding Minor Wave 3 (Red) downwards, indicating the strongest portion of the bearish move is in progress.
Anticipated Completion: Following the completion of Minor Wave 3, the analysis projects a shallow Minor Wave 4 (Red) rebound, followed by the final impulse move, Minor Wave 5 (Red), to complete the entire Intermediate Wave (C) correction.
The ultimate completion of Intermediate Wave (C) will signal the end of the larger-degree correction (labeled as a corrective wave (2)).
III. Critical Invalidation Level
The integrity of this bearish wave count is contingent upon the price action respecting a critical support level.
Invalidation Price: 74,223
Significance: This price point represents the extreme low or starting point of wave ((1)), so Wave ((2)) correction Should not breach this level as per wave principles, if it makes lower low below 74,223 on the lower side, the current Elliott Wave analysis would be invalidated, requiring a revision of the entire wave structure and market outlook.
I am not Sebi registered analyst.
My studies are for educational purpose only.
Please Consult your financial advisor before trading or investing.
I am not responsible for any kinds of your profits and your losses.
Most investors treat trading as a hobby because they have a full-time job doing something else.
However, If you treat trading like a business, it will pay you like a business.
If you treat like a hobby, hobbies don't pay, they cost you...!
Hope this post is helpful to community
Thanks
RK💕
Disclaimer and Risk Warning.
The analysis and discussion provided on in.tradingview.com is intended for educational purposes only and should not be relied upon for trading decisions. RK_Chaarts is not an investment adviser and the information provided here should not be taken as professional investment advice. Before buying or selling any investments, securities, or precious metals, it is recommended that you conduct your own due diligence. RK_Chaarts does not share in your profits and will not take responsibility for any losses you may incur. So Please Consult your financial advisor before trading or investing.

EURGBP: Cycle And Elliott Wave Makes Analysis Better Cycle analysis works well, especially on cross pairs like EURGBP, EURAUD, GBPNZD, and similar, where central banks often play a strong role and coordinate policy — sometimes even intervening when one currency moves too far.
In my view, cyclical analysis is most effective when it aligns with the Elliott Wave Principle, as both can highlight major turning points at key levels when sentiment reaches extremes.
Today we’re focusing on EURGBP, which has mostly traded sideways since 2016. We’ve been pointing out a potential cycle bottom toward the end of 2024, suggesting an important reversal point supported by a strong technical level at 0.8282. This support area also aligns with the lower side of wave B within a complex correction. Since the decline from the 2016 highs wasn’t impulsive, that added confidence — from both a cycle and Elliott Wave perspective — that a recovery was due.
So far, we’ve seen a solid reversal, with the pair already up more than 7%. The question now is how much further it can go. From both Elliott Wave and cycle standpoints, EURGBP appears to be entering the later stages of its bullish cycle, though some limited upside remains possible toward 0.9056.
That area could mark the upper boundary of an unfinished A-B-C-D-E triangle. If correct, the price is now in wave D, approaching key reversal zone.

POTENTIAL BULLISH SHARK HARMONIC ON BTC/USDThere appears to be a potential bullish harmonic pattern forming on Bitcoin. The structure has all the components that could signal a possible market bottom before a blow-off top phase. Sentiment and confluences — including the 0.618 retracement level, suggesting a potential completion of Elliott Wave 2 — are aligning.
I’ve outlined my entry levels, stop losses, and take-profit targets for transparency. Wishing everyone good luck with their trades.

BTCUSD 1D - Pause Before the Next Leg Down?On the 4H chart, Bitcoin is retesting a critical resistance area - the 111K–113K sell zone, where a descending trendline, prior support-turned-resistance, and local volume cluster converge. This confluence makes the current level a potential short-entry area.
After failing to sustain above 115K, BTC entered a corrective phase. The recent bounce looks like a retest of the broken structure, and unless bulls reclaim 113K+, the bias remains bearish with a target near 100K–101K, a key liquidity zone.
Technically, momentum is fading:
– Bearish RSI divergence at recent highs;
– Volume contraction on rallies, expansion on drops;
– Price structure forming a likely ABC correction, with wave C projection toward 100K.
Fundamentally , near-term pressure persists as traders take profits and global risk sentiment cools ahead of potential Fed guidance. However, the macro bull case remains intact - hashrate at all-time highs, growing institutional adoption, and supply tightening continue to underpin long-term support.
Tactical plan: short entries near 111K–113K, targets 100K–101K. Invalidation above 113.5K.
Even in a bull market, gravity never takes a holiday.

Amazon: Break Through ResistanceAmazon shares recently surged decisively above the resistance level at $242.52. This strong rally has pushed the beige wave V significantly higher. For now, we see further upside potential for this move, until the broader wave (V) in blue is complete.

GOLD XAU/USD: Wave ((1)) Near Completion - Wave 2 Zigzag vs Flat GOLD: WAVE ((1)) COMPLETE - WHAT'S NEXT?
Wave ((1)) nearly finished at ~$3,989. Next: Wave ((2)) correction
to the $4,250 area. But which pattern?
━━━━━━━━━━━━━━━━━━━━━━━━━━━━━━━━━━━━
ZIGZAG (60% Probability) Pattern: A-B-C (sharp, V-shaped)
• Wave (A): Sharp 1-2-3-4-5 impulse
• Wave (B): Brief recovery (~30-40% of wave A)
• Wave (C): Sharp impulse (~equal to A or 1.618x A)
━━━━━━━━━━━━━━━━━━━━━━━━━━━━━━━━━━━━
FLAT (40% Probability) Pattern: A-B-C (sideways consolidation)
• Wave (A): Moderate move
• Wave (B): Recovery that reclaims wave A (~80-120% of A)
• Wave (C): Normally sharp 1-2-3-4-5 impulse (~50-120% of A)
If price retraces 100% of wave 1 (above $3,956) Structure INVALID
MY BIAS: ZIGZAG
Wave 1 was powerful → Sharp corrections follow
Support: $3,956 (invalidation level)
Resistance: $4,150 - $4,200 - $4,250
IMPORTANT ELLIOTT WAVE RULES FOR WAVE 2:
━━━━━━━━━━━━━━━━━━━━━━━━━━━━━━━━━━━━━━━━
✓ Wave 2 CANNOT retrace more than 100% of wave 1 (invalidation rule)
✓ Wave 2 CANNOT be a triangle (only B and (iv) can be triangles)
✓ Wave 2 CANNOT be a combination beginning with a zigzag
(combinations only if starting with a flat)
These rules help us eliminate possibilities and confirm structure.

Shib(based on NEo wave)this fox make everybody angry or disappointed.
but the story of this cute fox is in long term it can make up to 1000% profit.
for 1000% profit you need to buy it in the deepest price but I prefer to buy it step by step with demand zones and with post pattern confrimation.

Hellena | Oil (4H): SHORT to support area of 59.00.Colleagues, the situation is complicated, but I still expect the price to renew the local low of 56.40.
It looks like the price is forming a complex compound correction (WXY) and I think that for now it is worth looking at the 59.00 area as the nearest most likely level.
Ideally, I would like to see the completion of wave “C” in the area of 64.80.
Fundamental context
According to the latest IEA report, the global oil market remains under pressure as supply continues to outpace demand. For 2025, production is expected to rise by around 3 million barrels per day, while demand growth is forecast at only 0.7 million barrels. This imbalance increases the risk of oversupply and inventory buildup across key regions.
Manage your capital correctly and competently! Only enter trades based on reliable patterns!

XRPUSD correction completedinitially thought that more upwards correction was false. i thought this was and impulse (Grey box) but it turns out its and abc, hence the impulse moving down

BTCUSD more bearish impulsesabc completed, more bearish downtrend as impulse.
the abc correction to wave 2 is completed since the price have broken down initial of the correction

Microsoft: Wave X Top Confirmed! As primarily anticipated, Microsoft shares recently reached the high of turquoise wave X just below resistance at $562.17 before quickly reversing lower. This decline, part of the same-colored wave Y, is likely to bottom within our magenta long Target Zone between $477.87 and $451.84, where we also expect the low of magenta wave (4). In our view, this range presents attractive opportunities for long positions, as we anticipate a renewed upward move during magenta wave (5) to follow. This rally should push price above the $562.17 resistance and complete the larger blue wave (I). Alternatively, we see a scenario in which the high at $562.17 marked only the end of beige wave alt.III (probability: 36%). In this case, a drop below the $392.97 support would be expected to form the low of wave alt.IV.

triangle wave correctionin H1, already making double abc , the ao divergence indicates it might go further up, possibly making triangle wave ABCDE correction with 3 waves structure as per chart.
