BITCOIN'S FALL HAS BEGUN ! DON'T GET CAUGHT UP IN THE BLOODBATH JPowel's rate cut hints that something bad is about to happen. All Fed Rate cuts have been marked by devastating market crash and this time will be no different. Don't lose your hard-earned money to the upcoming carsh !! You have been warned.
Disclaimer: Not financial advice.
Elliotwaveanalysis

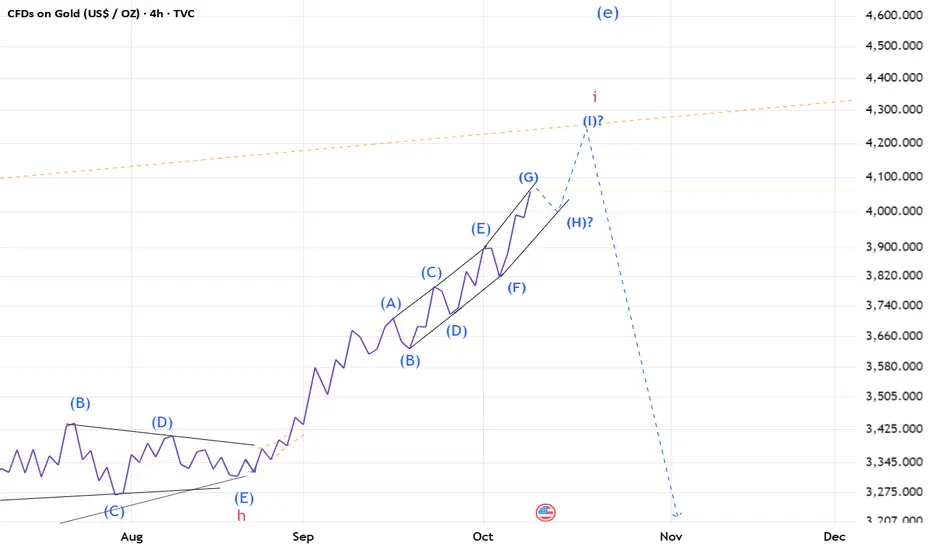
Gold(based on NEo wave)gold is at the end of bull run and its time to sell it on high prices.
after this waves finished I think 2700$ will touch in 2 years later.
S&P 500 - Should I be getting in right now?Price continues higher, holding above both the 60-day and 250-day EMAs, but momentum is fading:
RSI + MACD divergence
Open interest down by 500k (CFTC report) - w/c 23rd September.
Shorts likely getting squeezed = price up, participation down.
Elliott Wave count suggests we're in the 5th wave of the 3rd impulse — still bullish, but a Wave 4 correction could be next.
📍 Key level to watch: 5,481 (re-entry into Wave 1 territory = count invalidation)

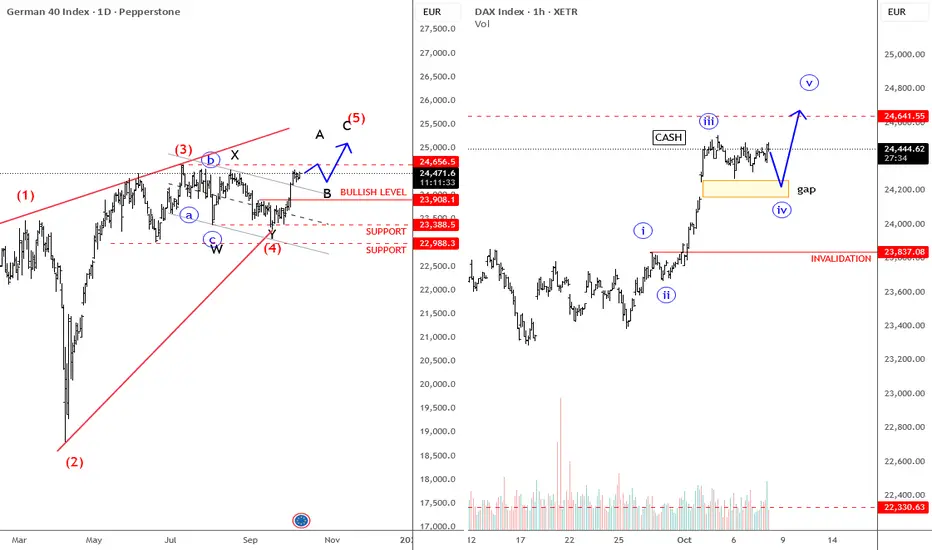
DAX Attacking New ATH German DAX is in a very nice recovery, breaking above the corrective channel resistance line, so apparently we are in risk-on mode on this index, which sooner or later could revisit all-time highs. Keep in mind this could already be a fifth wave, but there’s still room for 25,000 or even 25,500. What I really like on the smaller intraday time frame is the strong recovery since October 1st, and notice there’s a gap from October 2nd — these gaps can often act as reversal points, especially once they get filled on the cash market. L
ooking at the cash chart, it seems that gap could still get filled during the current fourth-wave correction, which could be a very nice spot for the market to resume higher toward the previous July 2025 highs. The gap fill could be an important support, while the short-term invalidation level is at 23,834 — as long as this one holds, the intraday trend remains up.
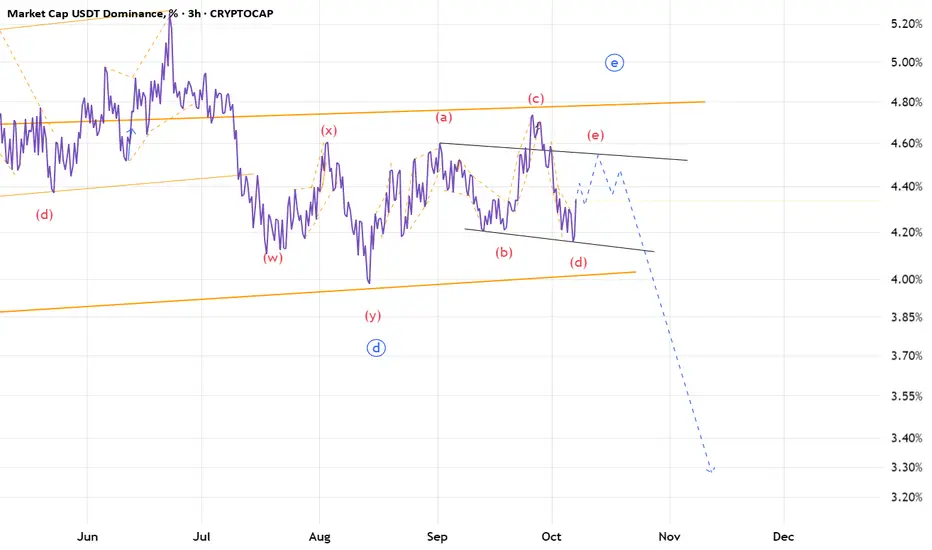
USDT.D(based on NEo wave)the bigger degree is a huge triangle and also wave E is a triangle with abcd waves which all are diametrics.
I hope wave e break the curse and change the pattern.
ETH(based on NEo wave)soon eth will start a temporary correction and goes for higher bullish waves.
it is the last chance to buy it.
Stop loss is 3800.
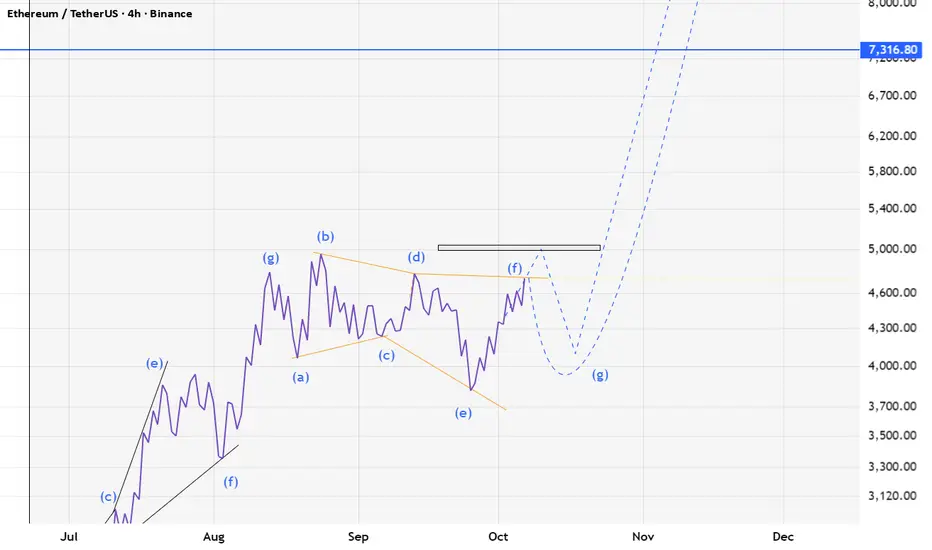
ETHUSD Breaks The Channel, Pointing Above 5kEthereum has been rising sharply over the last two weeks after only a three-wave retracement from all-time highs, so it looks like a textbook fourth-wave pullback within an incomplete bullish structure that is now ready to resume. We’re seeing a break and push beyond the upper line of the corrective channel, suggesting price is stepping into wave five, so more upside can show up in the weeks ahead.
Ideally, price could rise beyond 5000, possibly even toward 5336, where wave five could match the distance of wave two.
When it comes to potential trading setups, it may be interesting to watch for intraday retracements, especially if we see one while the market still trades below wave three highs. Then, opportunities could show up around the 4350–4500 support area.
GH

Tesla correction and buying opportunityAs Tesla looks as it has completed a five wave impulse, I expect it to correct tell the end of the year when it will be a buying opportunity once it reaches the red box

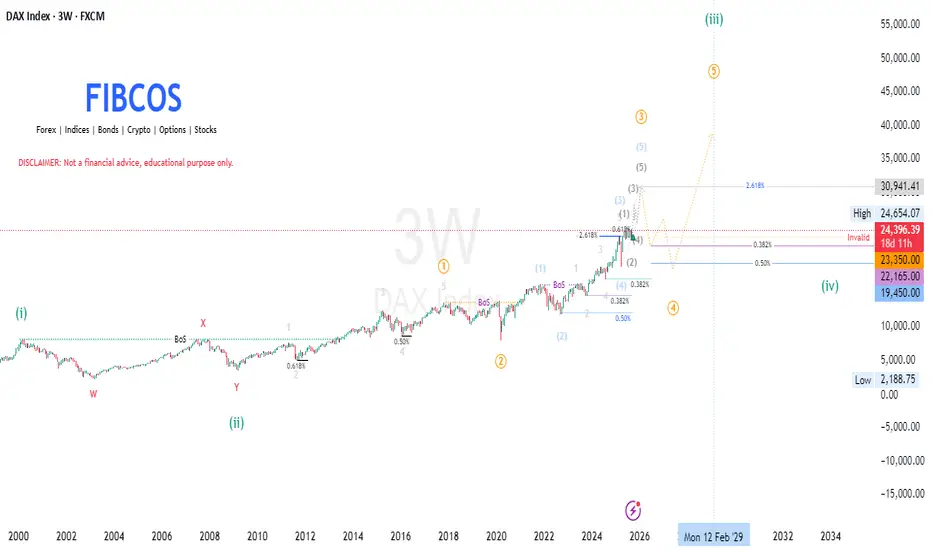
DAX INDEX | Elliott Wave + SMC + Fib + Market CycleDAX INDEX | Super Cycle Wave (3) In Progress | Micro Wave (iv) Correction Expected | Elliott Wave + SMC + Fib + Market Cycle
This macro outlook on the DAX Index (GER40) combines Elliott Wave Theory , Smart Money Concepts (SMC) , and Fibonacci Analysis , tracking the long-term price structure from the 1990s into the expected 2029 Super Cycle top .
We are currently nearing the completion of Micro Wave (iii) inside Super Cycle Wave (3) , with a correction expected as Micro Wave (iv) before a final leg Wave (v) to complete the 20-year Super Cycle advance.
🌀 SUPER CYCLE STRUCTURE (Wave Count Recap)
🔵 Supercycle Wave (1)
📈 Topped in 2000
📐 Five-wave impulse from early 90s
💡 Marked the first major peak of the new macro bull cycle
🔴 Super Cycle Wave (2)
🕰 2000–2009
📉 Multi-year W-X-Y complex correction
🔻 Pulled back to 0.618 retracement of Wave (1)
📍 Bottomed Jan–Feb 2009 — Smart Money accumulation zone
🚀 Supercycle Wave (3) — Now in Progress (2009–2029 Target)
This is a multi-decade impulse wave , subdividing into Micro Waves (i) through (v) .
🟠 Micro Wave (i)
🕰 2009–2018
✅ Clean 5-wave impulsive structure
🔓 Broke above Super Cycle Wave (1) high
📊 Confirmed initiation of Wave (3)
🟠 Micro Wave (ii)
🕰 2018–2020 (COVID crash)
🔻 Pulled back to 0.50 retracement of Wave (i)
📦 Retested key order blocks
💧 Liquidity swept beneath 2016–2018 lows
📈 Smart Money reaccumulation before major expansion
🟠 Micro Wave (iii) — Currently Unfolding
🕰 2020 – Expected top by end of 2025 or early 2026
🚀 Strongest wave in the structure
🔼 Targeting 2.618 Fibonacci extension of Wave (i)
🎯 Target zone: 30,941 (~32K)
📊 Multiple internal impulses have formed
🧠 Price delivery:
Consistent BoS
Minimal retracement
No parabolic blow-off yet → confirming institutional flow
🟠 Micro Wave (iv) — Correction Expected Next
🕰 Expected: 2026 to early 2027
🔻 Projected retracement:
0.382 – 0.5 of Wave (iii)
Target zone: 23,350 – 22,165
💧 Confluence with:
Sell-side liquidity pools
Prior OBs and imbalance zones
⚠️ Reaccumulation phase likely before final rally
🟠 Micro Wave (v) — Final Advance to Complete Supercycle Wave (3)
🕰 Expected top by 2029
🎯 Target range: Above 32,000, possibly toward 35,000+ depending on extensions
🔄 Will mark the peak of Supercycle Wave (3)
📉 Anticipate a major correction in Supercycle Wave (4) after that
📐 FIBONACCI LEVELS OF INTEREST
Structure Key Fib Levels
Supercycle (2) 0.618 retracement of (1)
Micro Wave (ii) 0.50 retracement of (i)
Micro Wave (iii) 2.618 extension of (i) → 30,941–32K
Micro Wave (iv) 0.382–0.5 retracement → 23,350–22K
Micro Wave (v) Possible extension to 38K+
🧠 SMART MONEY CONCEPTS (SMC)
🔓 Break of Structure (BoS) confirmed trend shifts at Wave (i), (ii), and internal impulses
📦 Order Blocks respected at retracement zones (2020 low, 2022 correction)
💧 Liquidity Grabs below previous lows fuel impulsive breakouts
🧱 Price Delivery = Institutional — no euphoric parabolas yet
🎯 Expect engineered liquidity sweep before Wave (iv) reaccumulation
📌 CONCLUSION
We are now nearing the completion of Micro Wave (iii) inside Super Cycle Wave (3) of the DAX. Price is approaching major extension targets (30,941–32,000), from where Wave (iv) correction is due.
This pullback (2026–2027) is expected to offer high-probability re-accumulation opportunities within a Smart Money demand zone before the final macro rally to new ATHs into 2029.
⚠️ After 2029 , expect a larger Supercycle Wave (4) correction phase.
📘 DISCLAIMER: This is a structural, educational market outlook. Not financial advice. Please do your own due diligence and risk management.
Hellena | GOLD (4H): LONG to support area of 3950.had to revise the vision of this upward movement a little bit. Because there was no deep correction, I think that the ascending wave “3” (blue) is now completed. Earlier I thought it was completed, but we didn't see the “4” correction.
At this point, I think that the price will reach the resistance area of 3950, completing either the continued wave “3”, or after the correction of 3791, the wave “5” will be completed.
Manage your capital correctly and competently! Only enter trades based on reliable patterns!

Hellena | EUR/USD (4H): LONG to the resistance area 1.18726.In the coming week, I'm hoping for a continued upward movement, so I decided to update the forecast.
If everything goes according to plan, the price is currently starting an upward movement in the wave “3” of the middle order. I believe that the price is quite capable of reaching the resistance area at 1.18726. Despite the fact that the top of wave “1” is likely to be updated - I would still prefer a target somewhat more reliable and closer.
Fundamental context
Lately, U.S. data keeps showing signs of slowdown — especially in the labor market. The latest ADP report came out negative, and forecasts for NFP remain weak, around +50K. That eases pressure on the Fed and slightly weakens the dollar.
In Europe, inflation picked up to 2.2%, which is above the ECB’s target. It means the central bank has no reason to rush with rate cuts — giving the euro some fundamental support.
So overall, the background fits well with my technical outlook: the dollar is losing momentum, and EUR/USD might continue higher in wave “3”, targeting the resistance zone near 1.1872.

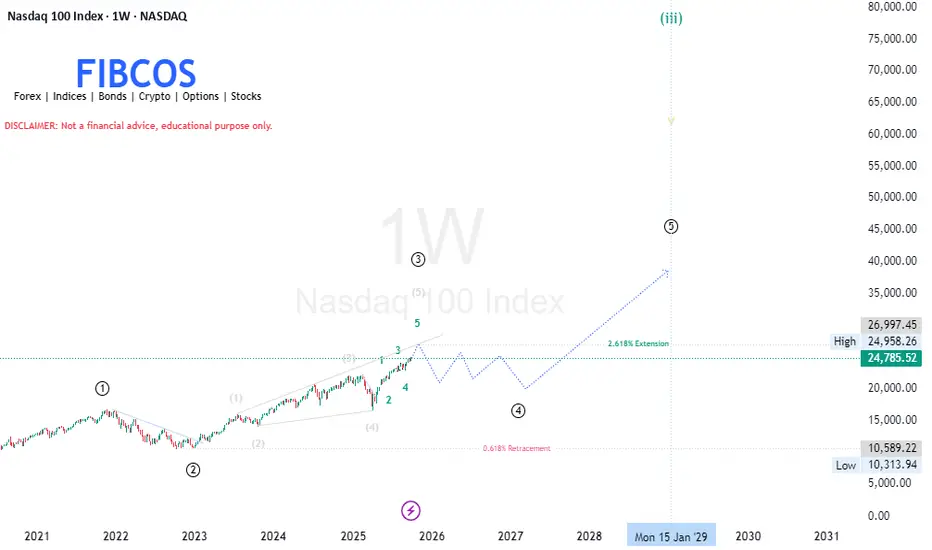
NASDAQ 100 (1W) – Elliott Wave + Smart Money Analysis by FIBCOSThe index (NASDAQ) continues its macro impulsive structure, now expanding through Wave (3) — targeting the 2.618 Fibonacci extension near 26,997( 27K ).
Smart Money is driving this leg with clear bullish order flow, creating multiple Fair Value Gaps and Breaks of Structure along the way.
After this expansion, we expect a Wave (4) correction between 22,000–17,500, where institutional demand zones await for re-accumulation before the next macro bullish leg (Wave 5) toward 35,000–38,000.
📊 Confluence Highlights:
Wave (3) → 2.618 extension (target zone: 26.9K–27K)
Wave (4) → 0.382–0.618 retracement (zone: 22K–18K)
Wave (5) → 1.618 projection (target zone: 35K–38K)
🧠 Elliott Wave Theory Interpretation
① Wave (1) — The Initial Expansion (2020–2021)
Early bullish impulse following pandemic recovery.
Represents Smart Money accumulation followed by a breakout.
Retail participation remains limited; institutional footprints dominate.
② Wave (2) — Corrective Pullback (2022–2023)
Sharp decline toward the 0.618 Fibonacci retracement zone.
This phase was a liquidity grab — Smart Money re-entering after shaking out weak hands.
Price formed a higher low , maintaining long-term bullish structure.
③ Wave (3) — The Power Leg (2023–2026)
The strongest and most extended wave — aligned perfectly with the 2.618 Fibonacci extension (~26,997 zone).
Confirms institutional markup phase , where:
Retail short sellers are trapped.
Fair Value Gaps (FVGs) are created during impulsive moves.
Continuous Break of Structure (BOS) validates bullish order flow.
Smaller degree sub-waves (1–5) visible inside, confirming internal impulse rhythm.
④ Wave (4) — The Upcoming Correction (2026–2027)
Expected macro re-accumulation zone , likely between 22,000 – 17,500 .
Market may enter a sideways complex correction (W–X–Y)/(W-X-Y-X-Z) pattern.
This is the Smart Money re-accumulation phase — liquidity collection before the next macro expansion.
Demand zones: previous unmitigated order blocks around 20,000–18,000 area.
⑤ Wave (5) — The Final Expansion (2028–2029)
After consolidation, the index may aim for new all-time highs toward 35,000–38,000 range.
This represents a distribution phase , where Smart Money offloads positions near cycle tops.
Expect divergence in momentum indicators , hinting at the end of the 5-wave structure.
---
💡 Smart Money Concept (SMC) Confluence
Concept | Observation | Implication
Liquidity Sweep - Below 2022–2023 lows (Smart Money accumulation confirmation)
Order Blocks - 22,000–18,000 zone {Institutional demand zone for Wave (4)}
Fair Value Gaps (FVGs) During Wave (3) impulsive rise {Will likely get mitigated during Wave (4)}
Break of Structure (BOS ) Continuous bullish BOS confirms institutional intent
Premium/Discount Zones Current price at premium (above equilibrium) Ideal region for institutional profit-taking
🧭 Smart Money Flow:
Accumulation → Expansion → Re-accumulation → Final Distribution
---
📐 Fibonacci Confluence Levels
Wave (3) → 2.618× extension of Wave (1–2) → ~26,997 (expected macro resistance).
Wave (4) → retracement likely between 0.382–0.618 → 22,000–17,500 zone.
Wave (5) → projected 1.618× of Wave (1–3) → 35,000–38,000 .
---
🧭 Market Outlook Summary
Timeframe | Bias | Expectation
Short-Term (2025–2026) 📈 Bullish Continuation toward 26,900–27,000
Medium-Term (2026–2027) ⚠ Corrective Re-accumulation phase, smart money reloads
Long-Term (2028–2029) 🚀 Bullish Wave (5) macro expansion toward 35K–38K
---
🔖 FIBCOS Summary
> NASDAQ 100 Weekly Chart (Elliott + SMC)
Currently expanding through a powerful Wave (3) toward the 2.618 Fibonacci extension (~27K).
After completion, a macro correction (Wave 4) is expected, providing the next Smart Money accumulation zone between 22K–18K before the final Wave 5 expansion toward new highs beyond 35K.
📘 Disclaimer: Not financial advice. Educational purpose only.
#FIBCOS #NASDAQ100 #ElliottWave #SmartMoneyConcept #MarketAnalysis #MarketCycle #Fibonacci
#XAUUSD AnalysisHello friends
#NEW forecast on GOLD
The price continues to support level and retesting the upward trend line .
Price action is moving towards the resistance area around 3950.
By regards, Honeytrading

Hellena | Oil (4H): SHORT to support area of 60 (Wave 3).The price is still not reaching the target of 60. I decided to make a new forecast, slightly changing the labeling of waves, or rather their importance.
At this stage, as before, I think that the price will reach the area of the level 60 in the middle wave “3”.
This movement is the development of the big corrective wave “C”. In general, the plan remains the same.
Manage your capital correctly and competently! Only enter trades based on reliable patterns!

Amazon Can Stabilze Near $210Amazon has been pulling back lately, and I’ve been tracking this as a potential wave four flat correction, with wave A and wave B already completed and wave C now eyeing the support around 210. That zone also lines up with the 0.382 Fibonacci retracement and previous breakout levels, so it could attract buyers and provide stabilization. The retracement is quite deep at around 12 percent, but since the stock has not yet retested February highs, it looks more like a consolidation, a pause rather than a new bearish trend. I assume there is a chance for a nice bounce into wave five, still this year.
GH

AUDJPY - Impulse wave underway?• Following a 3-wave corrective decline from July 2024 to April 2025, I’ve identified what appears to be a 5-wave impulsive move to the upside. There are multiple ways to count this structure, but treating wave (iv) as a running flat gives the most balanced outcome from both a Fibonacci retracement and extension perspective.
• From a higher-degree view, I believe Wave 1 and Wave 2 of a larger impulsive sequence are now complete, and we may currently be in Wave 1 of Wave 3 which is a high-probability rally zone.
• I entered the trade at 97.40 on Monday, 8th September, following a breakout above recent swing highs. Since then, price may have completed a Wave 2 retracement, and my stop loss remains at 96.30; the start of the current Wave 1 leg so the trade thesis is still valid.
• Key risk to this setup is upcoming inflation data, which could influence the Fed’s interest rate decision and impact global risk sentiment (AUDJPY being a risk-sensitive pair).
• View Daily Count for Broader Context -

LiamTrading – Gold continues its “madness”LiamTrading – Gold continues its “madness”: Strong trend, but awaiting reaction at 3900
Gold has just recorded its 39th all-time high in 2025, now approaching the 3,900 USD/oz mark. This is not only a significant psychological threshold but also coincides with extended Fibonacci levels, making this area a sensitive market point.
Trend & Trendline
On the H4 chart, gold remains firmly within the upward channel formed since early September. Prices consistently bounce off the lower trendline and expand towards the upper boundary.
The lower trendline around 3760–3780 acts as dynamic support. If prices break below this area, a deeper correction scenario towards 3720–3730 will be triggered.
The upper trendline is currently “pressing” prices right at the 3897–3900 area, converging with Fibonacci 2.618. This is a strong resistance, potentially causing profit-taking reactions and creating a technical pullback.
Volume Profile & Liquidity
The 3800 and 3720 areas are dense volume clusters, indicating that large capital flows are positioned here. These are also potential Buy zones when prices correct.
The 3640–3650 area is a larger liquidity cluster, but will only be activated if there is a strong breakdown from the current trendline.
Reference Trading Scenario
Sell zone: 3897 – 3900, SL 3905, TP 3885 – 3862 – 3850 – 3833
Short-term Buy zone: 3797 – 3800, SL 3793, TP 3822 – 3840 – 3855 – 3872 – 3890
Medium-term Buy: 3720 – 3730, SL 3710, TP 3760 – 3800 – 3850
Conclusion
The upward trend remains very strong, but the 3897–3900 area will be a crucial challenge. If prices are rejected here, we may witness a correction back to the lower trendline before gold continues towards the larger target of 4000 USD.
This is my personal view on XAUUSD. Please manage risk carefully and stay updated with the latest scenarios.

XAUUSD – Will ATH Diminish Gold's Value?Hello Traders,
Gold once accounted for up to 21% of total global assets, but now this figure is only about 5%. Two perspectives are clear:
Gold is gradually losing its relative importance in the financial system.
The total value of global assets has surged (expanding the denominator), reducing gold's proportion, while its absolute value still plays a crucial role.
Technical Analysis
In today's Asian session, gold continues to set higher price marks, indicating that the upward momentum remains very strong.
The ascending channel on H1 has reached the upper boundary, showing slight hesitation, but the main trend is still upward.
The H1 and H4 frames maintain strong buying power, with market sentiment leaning heavily towards buyers, ready to push prices to higher levels.
According to Elliott Wave, the price is currently in wave 5 (the market psychology wave). The current task is to observe the reaction when this wave completes, to prepare for the ABC correction cycle.
Regarding Fibonacci, the next important resistance area is at 3880, where a bearish reaction may occur.
Trading Scenario
Sell (at Fibo resistance 3880):
Entry: 3880
SL: 3886
TP: 3866 – 3850 – 3835
Buy (trend-following priority):
Entry: 3813 – 3816
SL: 3809
TP: 3828 – 3843 – 3860 – 3878
👉 Note: Smaller frames H1 – M15 will provide additional confirmation signals to optimize entry points.
Conclusion
The upward trend of gold is still prioritized, wave 5 has not ended, and the scenario towards 4000 – 4050 is entirely plausible.
Short-term selling at strong resistance areas can be considered, but risk management must be tight.
Traders need to closely monitor support – resistance areas in smaller frames to maximize profits.
Follow me for the fastest updates when the price structure changes and to further discuss scenarios in the community.

GOLD's Situation, A Comprehensive Analysis ! (XAUUSD)In my opinion, the price will rise to around $4000 and then enter a corrective wave. Currently, the price is forming the third upward wave, which I have estimated using technical analysis. These upward waves will continue up to around $4000, and after this rise, the price could decline toward the PRZ (Potential Reversal Zone). However, this price correction depends on the breakout of the wedge pattern.

S&P500: More Upside Likely Before PullbackThe North American Mass Index kicked off the new week with some momentum, extending its climb within the ongoing magenta wave (3). For now, we anticipate this upward trend could continue before reaching a new high. Afterward, we expect a pullback as part of the subsequent wave (4), likely bringing the index into the magenta long Target Zone between 6,283 and 5,781 points. In our view, this price range offers attractive opportunities for long positions, as wave (5) is expected to follow—potentially pushing the index significantly higher and completing the larger blue wave (III). To protect newly established long positions, a stop can be set 1% below the lower boundary of the Target Zone.

Hellena | GOLD (4H): LONG to support area of 3800.Dear colleagues, the last forecast is canceled, but I recommended that trades should be set trades to breakeven because there is a high probability of wave “3” extension.
It looks like the upward impulse is still not over and I expect the final formation of wave “5” to the 3800 area. Yes - this target is quite close, but now it makes no sense to make a long forecast with a correction in wave “2” of higher order (red).
As soon as I get confirmation that the correction in wave “2” has started - I will make a forecast with more points.
Manage your capital correctly and competently! Only enter trades based on reliable patterns!

Critical Retest: Can the Uptrend HoldMarket Overview
The broader price structure clearly remains in an uptrend. However, a short-term bearish formation recently developed but was quickly invalidated as the market reversed into bullish momentum again on Friday.
Before the market closed, price retraced to retest the breakout level. If it can hold above this area and establish a higher structure, the uptrend is likely to continue until the trend shows signs of exhaustion. Conversely, if the retest fails and price breaks back below the ascending trendline, the market may enter a sideways consolidation phase, potentially forming a corrective pattern before the next decisive move.

Bitcoin Weekly Elliott Wave & Fibonacci ZonesThis chart presents a comprehensive weekly analysis of Bitcoin (BTCUSD) at a critical juncture following a completed 1-2-3-4-5 Elliott Wave impulsive sequence. The structure now transitions into an ABC corrective phase, with particular focus on the positioning of Wave C in relation to Fibonacci retracement zones.
Elliott Wave Structure: The main bullish cycle is clearly mapped out, beginning from the Wave 2 support low and culminating at the Wave 5 peak. The ABC corrective move is forecast to target classical retracement levels, consistent with historical BTC cycle behavior.
Fibonacci Retracement: Key support zones are defined at the 38.2%, 50%, and 61.8% levels ($95,604; $86,747; $77,890), selected using the Wave 2 low as the anchor for maximal relevance. These levels represent statistically dominant retracement targets for the final stage of corrective pullbacks before blow-off tops historically observed in Bitcoin macro cycles.
Volume Profile and Indicators: The chart incorporates volume spikes and momentum measures (MACD, RSI), validating cycle peaks and inflection points. RSI currently hovers near neutral, supporting the thesis of a corrective move without signaling complete oversold conditions. Accumulation/Distribution remains positive, but fading momentum confirms the need for a reset.
Scenario Outlook:
This analysis anticipates a standardized corrective process in line with Bitcoin’s history, where the C wave of ABC retracement is highly likely to resolve within one of the highlighted Fibonacci zones, most commonly between 38.2% and 61.8% retracement. Technical confluence across price structure and indicators suggests these areas as optimal watchpoints for buyers and macro cycle accumulation. Upon completion of this corrective leg, BTC is statistically favored to embark on a renewed impulsive rally, reinforcing strategic accumulation for the next leg toward new ATH.
The chart is designed as an actionable reference for traders and investors aiming to navigate potential volatility and anticipate high-probability reversal zones consistent with previous bull market cycles.
