AUD/NZD Waiting for Reversal SignalAUDNZD has formed 5 Elliott waves and waiting for reversal sign.
Good luck
MarketsTitan
Elliotwaveanalysis

EUR/USD 4H | Retest of Breakout Zone – Next Leg Higher?Market Structure:
EUR/USD has finally broken above its multi-week descending trendline and is now retesting the breakout zone. Price action has compressed into the 1.1680–1.1700 range, aligning with key technical factors.
Technical Confluence:
✔️ Fibonacci Retracement: Price sits at the 0.5–0.618 retracement (“golden pocket”) of the latest swing.
✔️ Moving Averages: 50 EMA and 200 EMA cluster at current support.
✔️ Trendline Retest: Old resistance flipped into potential new support.
✔️ Structure: Higher-low formation holding above 1.1640.
⚡ Key Levels to Watch:
Support / Buy Zone: 1.1680–1.1700
Invalidation (Stop-Loss Idea): Below 1.16080
Resistance / Targets:
TP1 → 1.1780 (previous high)
TP2 → 1.1825 (-0.27 Fib extension)
TP3 → 1.1885 (-0.618 Fib extension)
📌 Trade Idea:
(Swing Long Bias)
Entry Zone: 1.1680–1.1700
Stop: Below 1.16080
Targets: 1.1780 → 1.1825 → 1.1885
Risk/Reward: ~1:1.5 to 1:2.25
🧠 Bias:
Holding above 1.1690 = bullish continuation favored.
Losing 1.1680 could expose 1.1608, and deeper to 1.1485 monthly support.
🔮 Outlook:
The EUR/USD breakout + retest setup aligns fibs, EMAs, and structure into a strong confluence zone. If bulls hold this level, expect continuation toward 1.1825 → 1.1885 in the coming sessions.
What do you think traders does EUR/USD hold this breakout, or will sellers drag it back below 1.17?
#EURUSD #Forex #SwingTrading #PriceAction #Fibonacci #Breakout
@WrightWayInvestments
@WrightWayInvestments
@WrightWayInvestments

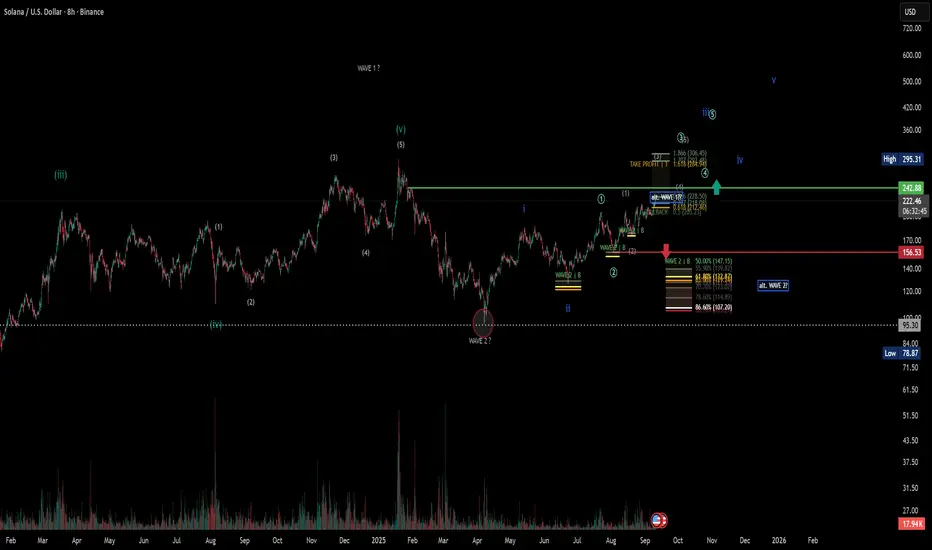
Solana (SOL) – Chart AnalysisToday, I would like to share my current view of the Solana chart with you. I am currently tracking three possible scenarios:
Scenario 1 – Preferred: ABC correction to wave 2
In this scenario, I assume that Solana has not yet found its final bottom at around $95 on April 7, 2025.
In my opinion, wave A was only completed at that point.
We are currently moving correctively in wave B before a larger sell-off begins in wave 2.
For wave B, I expect targets in the range of $276–300.
If this range is clearly exceeded, a wave B extension to around $419 is also possible (regular chart).
Variant 2 – Long wave 4 (less preferred)
In this case, wave 4 would be completed on April 7, 2025, after an extended correction (ABC with overshooting wave B).
We would now already be in the final wave 5.
This would have potential up to the 0.618 level at around USD 516 or higher.
Important: I am looking at this variant in the logarithmic chart, as otherwise the levels do not fit neatly.
Nevertheless, this scenario is not my preferred assumption at present.
Variant 3 – very bullish scenario
Another possibility would be that wave 2 was already completed on April 7, 2025.
In this case, we would already be in a new uptrend with several 1/2 structures, which would make the chart look very bullish.
Confirmation would come if the $300 mark were to be sustainably exceeded – then this scenario could quickly become the primary one.
However, as the structure is not yet convincing, I remain cautious and continue to favor the ABC correction (scenario 1).
📌 Summary
My main scenario remains an ABC correction to wave 2 with a possible bottom between $50 and $30 (this is also where my long-term risk management lies).
Nevertheless, the various variants present exciting opportunities for traders, both in the short and medium term.
Solana therefore remains a coin that I continue to monitor very closely – especially in conjunction with the Bitcoin chart. This could also still be in a wave 4 correction before the final upward move takes place.
XAUUSD – Outlook Ahead of PPI ReleaseXAUUSD – Outlook Ahead of PPI Release
Good day Traders,
Gold recently advanced towards the Fibonacci 2.618 extension before meeting resistance and reacting lower. Price has also broken through the most recent minor low within the upward structure, which, in my view, represents a violation of the prevailing bullish trend. A further leg would still be required to establish a durable reversal structure, yet the case for a bearish bias is already forming.
Fundamental Context
Later today, the US PPI data will be released. Expectations are for 0.3%, down from 0.9% previously. Should the forecast materialise, gold could extend higher in the short term. However, I believe the figure may not prove as weak as projected, and therefore it is prudent to monitor the market’s response to the data before committing to fresh positions.
Technical Levels of Interest
3660: A potential retest of this zone could provide another reaction and may represent the most attractive level to initiate short exposure.
3318: If gold confirms a lower structure in line with Dow theory and decisively breaks beneath prior support, the market could extend towards this deeper downside target.
Trading Approach
The preferred strategy for today is to seek selling opportunities:
Ideal entry: around 3660, should price retest and reject the level.
Strong confirmation: a decisive candle close beneath old support would validate further downside and provide a clear short entry.
Short-term traders may also consider scalping within the corrective range created during yesterday’s US session, as the market redistributes price action.
This is my perspective on gold for the day. Traders should use it as a guide and align it with their own analysis and risk management.

Bitcoin – Current Trend UpdateBitcoin – Current Trend Update
Good day Traders,
Bitcoin continues to respect the structure of an inverse head-and-shoulders formation, which remains intact at this stage. Following a test of the 113.5k region, price once again reacted lower – this marks the third rejection from this level, highlighting its importance as a pivotal zone. For the bullish momentum to extend and complete the final wave of the formation, this resistance must eventually be overcome.
Scenarios to Monitor
Bullish Scenario: The upward bias remains valid while price holds above 109k. In this context, long positions remain the preferred approach.
Bearish Scenario: Should price sustain a break beneath 109k, the bullish case would be invalidated and a bearish outlook activated. Confirmation will be required before considering such positions.
Short-Term Dynamics
On the intraday timeframes, BTC is trading within a sideways channel. For short-term participants, range-based strategies such as buying near support and selling into resistance may remain effective until a decisive breakout occurs.
Market Context
At present, broader market attention is focused more heavily on gold rather than Bitcoin. As a result, BTC may continue to consolidate within a narrower range, requiring traders to temper expectations for immediate volatility.
This represents my current outlook for Bitcoin. Traders are encouraged to use this as a reference and compare it with their own perspectives.

ASX STOCKS SCAN: ANZ - 10 SEP, 2025 Conclusion: ANZ is moving higher.
Key Points: Wave iii)purple is unfolding and subdividing into wave i,ii,iii,iv-blue, and wave iv-blue may have ended at 32.61. From there, wave v-blue is unfolding higher, possibly targeting the high of 36.24.
Invalidation Point: 32.61

Tesla: New Alternative Scenario Emerges Tesla continues to face significant upward pressure, repeatedly testing resistance at $373.04. As a result, we have dropped our previous alternative scenario of an early sell-off in favor of a new upside alternative. We now see a 37% chance that the stock will break above the $373.04 resistance, forming an early top for beige wave alt.x above the next key level at $405.54. However, our primary expectation is that TSLA will first pull back into our green Target Zone between $273.11 and $231.66, where we anticipate the low of green wave . Thus, this range could present new short- to medium-term long entry opportunities to capitalize on the subsequently expected rally, which is likely to culminate in the regular wave x high above $405.54. Following this top, we expect the final sell-off phase within the broader corrective structure: wave y should drive price down into the beige Target Zone between $157.88 and $46.70, where we project the low of blue wave (II). This range could present attractive opportunities for longer-term long positions. For potential long trades—whether in the green or the beige zone—a stop set 1% below the lower boundary of the respective zone can help manage risk.

USDJPY Trapped In Bearish PatternUSDJPY is already coming down despite the gap higher at the start of the week after Japan’s prime minister announced he will step down. That move proved to be only a short-lived recovery, as the main story remains Fed rate cut expectations, which keep the dollar under pressure. Any gains are short-lived, and looking at the updated wave structure, I still see an ongoing triangle that may retest the lower trendline a few times before eventually breaking lower, possibly later this week or after Thursday’s US inflation data. A break beneath 146.50 would open the way toward 145–144.
Grega

XRP: Lacks Momentum Despite Modest GainsRipple’s XRP is trading slightly higher today compared to last Monday, but it still hasn’t found real momentum. For now, it’s expected to continue moving upward toward resistance at $4.09 as part of turquoise wave B, before the correction of wave (2) is finally completed. The following magenta wave (3) should then drive gains above the $4.09 resistance level. If the altcoin manages to break directly above this level, this will suggest that wave alt.(2) has already wrapped up.

Elliott Wave Analysis: Balkrishna Industries LimitedHello friends,
Welcome to RK_Chaarts,
We're analyzing the chart of Balkrishna Industries Limited from the perspective of Elliott Waves.
Here's what we've observed: we've completed Primary Degree Wave ((3)) in Black at the peak of August 2024. Following that, we've witnessed a complete bearish and sideways movement, culminating in the low of April 7, 2025, which marks the end of Primary Degree Wave ((4)) in Black.
We've now initiated Wave ((5)) in Black, which should unfold as five Intermediate Degree subdivisions (1) to (5) in Blue. Furthermore, within Wave (1), we should see 1,2,3,4,& 5 Minor Degree subdivisions in Red. As we can see, we've marked Red Wave 1 as complete, and Red Wave 2 is almost complete.
According to Elliott Wave Theory, Wave 2 has retraced less than 100% of Wave 1, which is a valid point. Our invalidation level will be the low of Wave ((4)) in Black at 2150.
Since April 7, the price has made an impulsive move upwards, forming a high on May 9, 2025. We've labeled this as Minor Degree Wave 1 (in red). Within Wave 1, we've identified a lower degree, Minute Degree (in black), with subdivisions ((i))-((ii))-((iii))-((iv)) & ((v)).
Following Wave 1, a corrective move has unfolded in a 3-3-5 structure, specifically a flat correction. We've labeled this as Wave 2. If the price doesn't break below the low of Wave ((4)) (2150), and instead forms a higher high, it will increase the likelihood that our wave count is correct. However, if the price makes a lower low, it will introduce a doubtful scenario.
We've observed that Primary Degree Wave ((3)) in Black, which we identified at the top, has led to a corrective fall in Wave ((4)) in Black. Within Wave ((4)), we've labeled an Intermediate Degree (W)(X)(Y) correction (in blue) with subdivisions. This can be classified as a Double Three pattern.
Furthermore, within the (W) correction, we've identified another Minor Degree WXY pattern, and within the (X) wave, another WXY pattern. The (Y) wave has an ABC minor pattern. Additionally, we've noticed a slanting resistance trend line, which has been broken with the arrival of Wave 1.
Given the significant decline in price, market sentiments have likely contributed to the unfolding corrective structure. If the price forms a higher high, it will increase the likelihood that our potential Elliott Wave count is correct.
Elliott Wave analysis is always like solving a puzzle, requiring us to unfold the structure and make educated guesses about the emerging pattern. If the price breaks below the Wave ((4)) low 2150, our wave count will likely change. Until the price remains above this invalidation level, we'll continue to follow this wave count. If the price crosses the Wave 1 high, we'll have full confidence in this wave count.
In this study, we've applied Elliott wave theoretical structures to identify a potential scenario. However, markets can be unpredictable and may surprise us at any time, leading to new scenarios emerging.
The information, chart, and study shared in this post are solely for educational purposes. Our goal is to demonstrate how we plot market movements and make informed forecasting about future trends using Elliott Wave theory. If our predictions prove accurate, we can refine our wave counts accordingly. Conversely, if our predictions are incorrect, we will need to adjust our wave counts.
Please note that this analysis is not investment advice, and you should always consult with a financial expert before making any investment decisions.
I am not Sebi registered analyst. My studies are for educational purpose only.
Please Consult your financial advisor before trading or investing.
I am not responsible for any kinds of your profits and your losses.
Most investors treat trading as a hobby because they have a full-time job doing something else.
However, If you treat trading like a business, it will pay you like a business.
If you treat like a hobby, hobbies don't pay, they cost you...!
Hope this post is helpful to community
Thanks
RK💕
Disclaimer and Risk Warning.
The analysis and discussion provided on in.tradingview.com is intended for educational purposes only and should not be relied upon for trading decisions. RK_Chaarts is not an investment adviser and the information provided here should not be taken as professional investment advice. Before buying or selling any investments, securities, or precious metals, it is recommended that you conduct your own due diligence. RK_Chaarts does not share in your profits and will not take responsibility for any losses you may incur. So Please Consult your financial advisor before trading or investing.

Hellena | EUR/USD (4H): LONG to the resistance area 1.17800.Colleagues, I thought I'd update the forecast a bit.
The target remains almost the same, but the wave layout has changed slightly.
I believe that at the moment the development of wave “5” of the higher order and wave “3” of the lower wave is underway.
Therefore, I still consider the area of 1.15765 as a support area and the area of 1.17800 as a target area.
Manage your capital correctly and competently! Only enter trades based on reliable patterns!

OILUSD – Demand Zone Reaction (4H Analysis)Price has been moving in a bearish trend, forming lower highs and lower lows. Recently, it tapped into a strong demand zone (blue box) and is now showing signs of a bullish reaction.
🔎 Key Points:
Price reacted strongly from the demand zone.
A trendline break is visible, suggesting bearish momentum is weakening.
Stop loss is placed below the demand zone (61.36).
Take profit is set at the next supply zone / resistance around 66.05.
💡 If buyers hold this level, we may see a strong push toward 66.05. But if demand fails, price could revisit lower levels.

Ethereum (ETH/USDT) – Neowave UpdateEthereum continues to move inside a short-term descending channel. Based on the Neowave count, the current structure can be interpreted as wave G of a Diametric pattern.
🔑 Main Scenario:
• If ETH manages to hold above 4315, buyers could regain control.
• In that case, a move toward the channel’s upper boundary around 4410 is likely, completing wave G of the Diametric.
⚠️ Alternative Scenario:
• Failure to sustain above 4315 will keep the bearish tone intact.
• In this case, ETH may retest the lower boundary of the channel, with possible extensions toward 4200–4150.
📌 Conclusion:
Ethereum is at a decision point. A confirmed breakout above 4315 opens room for a rally to 4410, while rejection from this level could extend the corrective phase lower.

XAUUSD – Week 08/09 to 12/09, CPI & PPI in FocusXAUUSD – Week 08/09 to 12/09, CPI & PPI in Focus
Good day Traders,
Gold posted a notable advance last week, recording new highs on a near-daily basis. While this type of price action is not unprecedented, it has introduced an element of caution to the market. Investor sentiment remains firmly skewed towards the long side, reaffirming gold’s position as a key safe-haven asset.
Fundamental Outlook
Attention this week will centre on the release of US CPI and PPI data. These figures will be critical in assessing the financial health of the US economy and could directly shape the Federal Reserve’s decision on a potential rate cut in September.
Technical Outlook
Price has already surpassed the Fibonacci 1.618 extension, with the next upside projection aligning near the 2.618 level at 3687.
Prior to reaching this objective, a modest retracement into nearby FVG (Fair Value Gap) zones is possible.
On a longer-term horizon, the 3467 – 3475 region is highlighted as a constructive area for accumulation, supported by the confluence of FVG, Dibo and Volume Profile.
Trading Scenarios
Upside Bias: Long positions remain the preferred approach. The 3467–3475 area offers a technically favourable entry zone for those with a longer-term outlook.
Downside Case: Short exposure should only be considered upon evidence of a reversal structure, with confirmation via a break below 3510, or rejection from the 2.618 Fibonacci extension.
Final Thoughts
For the week ahead, gold continues to be best approached from the long side. Nevertheless, traders should closely monitor price reactions at the identified technical levels and adjust accordingly. With key macroeconomic releases imminent, maintaining disciplined risk management remains essential.

Bitcoin – H4 Mid-Term OutlookBitcoin – H4 Mid-Term Outlook
Good day Traders,
Bitcoin remains in a broad sideways range. Although the recent NFP release generated strong trading volume, the market has yet to confirm a dominant direction. For now, price continues to rotate within the 107k – 113k area.
Elliott Wave View
There are signs that Wave 5 has likely completed, while an A–B corrective phase is developing. Within this structure, the market could still deliver one more upward move before clarity emerges.
Trendline & Critical Levels
A descending trendline is capping upside momentum, offering potential early short entries. Still, a decisive break below 107k would be needed to confirm a mid-term bearish structure.
Alternatively, if price retests the trendline and rebounds, a wave C rally could unfold.
It is also worth noting that BTC remains above its rising channel, signalling that sellers have yet to take full control.
Possible Scenarios
Bullish Scenario:
Holding above 107k and breaking through 113k would open the way towards 115k – 118k. Long setups should ideally be backed by stronger volume or a confirming MACD signal.
Bearish Scenario:
A failure to defend 107k could accelerate selling pressure, dragging price back towards 104k – 101k, where key support lies.
Professional Insight
The market currently lacks clear direction in the mid-term. Monitoring price action at 107k and along the descending trendline will be critical for defining the next move. Until then, flexibility and strict risk management remain vital for traders navigating this environment.

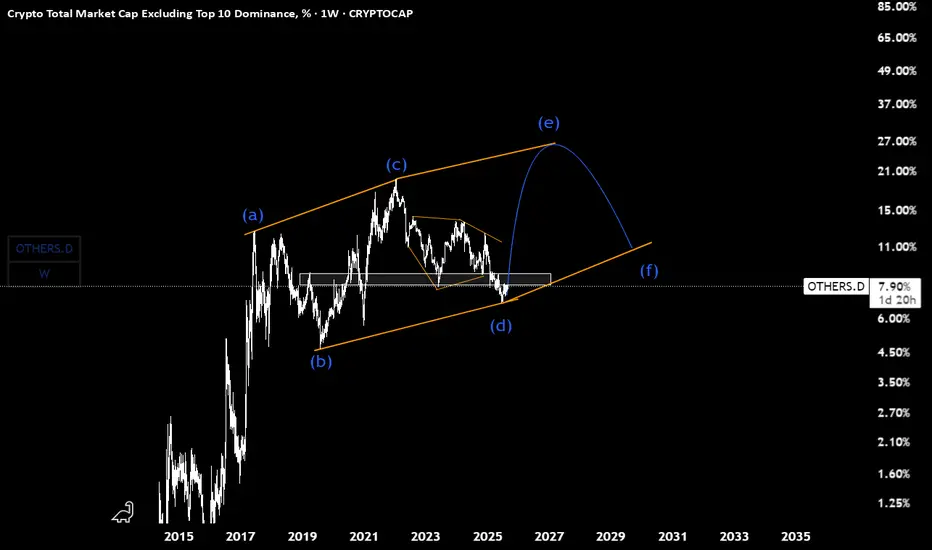
Others.D(based on NEo wave)there is 2 ways for wave E
its E of diametric or E of triangle.
we should wait for it but triangle makes a sharper wave E.
confirmation is breaking the white box on W timeframe.
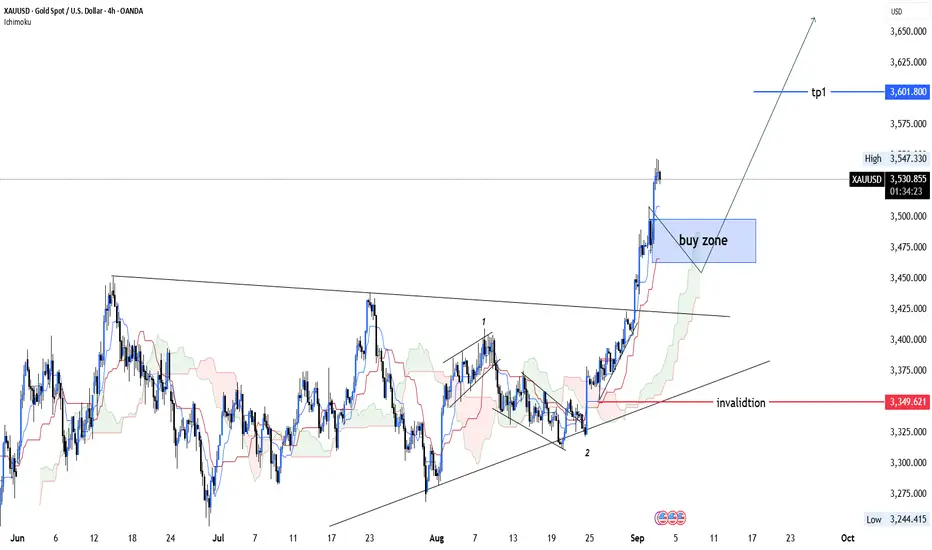
XAU/USD 5th WaveAfter the Daily chart breakout after forming triangle, now price is climbing on the 5th final wave from the low of 28th Sept 2022. Expecting price to make retracement/pullback after completing wave 3 of (5). And one final push towards $36xx - $37xx region

EURUSD BEARISHOn the 4H timeframe, EURUSD is currently reacting around a key supply zone.
🔴 Supply Zone (1.1730 – 1.1760):
Price rejected this area previously with strong selling pressure.
Price is now retesting this zone, where sellers are likely to defend again.
🔵 Demand Zone (1.1584):
This is the next major support where buyers previously stepped in.
It remains the logical take profit target for shorts.

Microstrategy: Further DeclineAfter a brief consolidation, MSTR continued its decline since our last update, further developing turquoise wave 2, where we still see price positioned. We continue to anticipate the low of this wave above the support at $153.49. In the meantime, we have revised the magenta substructure of wave 2 to a - - formation, with the final (wave- ) leg currently unfolding. Once turquoise wave 2 completes, we expect a strong rally above resistance at $674.18, which should significantly advance the broader upward impulse. However, under our new alternative scenario, a different wave count could prevail: price may currently be forming magenta wave alt. to the upside, developing a blue three-part substructure in the process. In this 25% likely scenario, the next move would be for blue wave alt. (b) to finish within the nearby blue alternative Target Zone between $306.60 and $252.67, before wave alt. (c) pushes up toward the top of magenta wave alt. near $674.18. Within this alternative, the blue zone could offer long entry opportunities, though heightened caution is warranted: since this remains only an alternative scenario, risk is elevated, and we consider strict risk management—such as setting a stop 1% below the lower edge of the zone—absolutely essential.

Hellena | GOLD (4H): LONG to resistance area of 3540.Colleagues, the forecast for an upward impulse has been confirmed and now I think that wave “3” is complete and I expect a correction in wave ‘4’ in the area of 3445 and then a continuation of the upward movement in the final wave “5”, which may meet resistance at the important level of 3540.
The most interesting thing is that if this is what happens - it would mean that there is a pretty strong correction ahead, after the execution of the scenario, and then a continuation of the upward movement, but we will talk about these plans later.
Manage your capital correctly and competently! Only enter trades based on reliable patterns!

XAUUSD – Pullback, has the downtrend really begun?XAUUSD – Pullback, has the downtrend really begun?
Hello traders,
As you can see, gold is currently in a corrective move, already dropping around 40 dollars, showing clear selling pressure. Traders are accepting shorts at these levels. However, to truly confirm a downtrend, we need to see how price reacts around 3530 – this will be the key level to determine whether the pullback is genuine.
On the higher timeframe, gold has rallied nearly 250 dollars (2500 pips) in just two weeks, which highlights the strong prior buying momentum. That said, today’s and tomorrow’s NFP data could force gold to give back liquidity and redistribute the market. Last month’s NFP was weak, and if this repeats, gold could still push higher – but that’s just a forecast and needs to be observed further.
Trading strategy:
Mid to long-term bias: look for selling opportunities around the 354x zone.
Short-term buys may be considered at the FVG fill zones around 3510 – 3460 – 3430, where major liquidity gaps remain from the earlier surge in buying.
For now, my outlook is to hold a medium-term short bias. Feel free to share your views in the comments so we can discuss further.

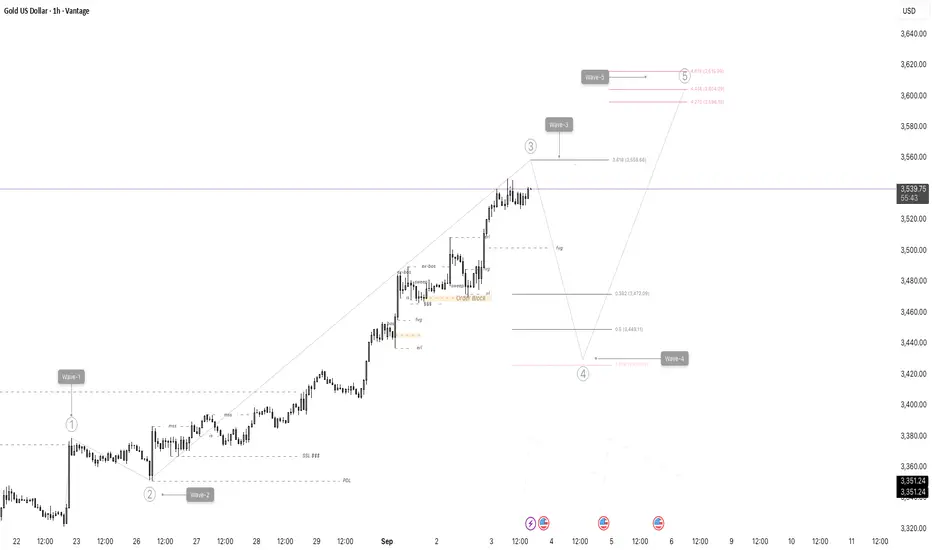
Trading Plan for Gold USD Using Elliott Wave and Fibonacci This trading plan combines Elliott Wave analysis with Fibonacci retracement and extension levels, focusing on key psychological points to guide entry, exit, and risk management decisions for the Gold/USD 1-hour chart.
Fibonacci Levels & Psychological Zones:
Wave 3 is approaching a Fibonacci extension zone near 3,558 - 3,616 (from 3.618 to 4.618 levels). This acts as a key resistance and potential Wave 3 target.
The retracement for Wave 4 correction is expected to land within the important Fibonacci retracement zones:
- 38.2% (~3,472)
- 50% (~3,449)
- 61.8% (~3,426)
These Fibonacci levels serve as psychological support zones where Wave 4 could end and Wave 5 might begin.
xauusd “Bullish momentum confirmed by Ichimoku and Elliott Wave. Key resistance levels to watch for targets.”