ETH: Pullback Sets Up New Buying OpportunitiesEthereum has also experienced another downward move in recent hours. For now, there remains a 40% probability that the recent rally could continue above resistance at $3,656 before a sell-off into the green Target Zone between $2,228 and $1,789 occurs. However, under our primary scenario, the price is expected to stay below $3,656, break through support at $2,620, and move directly into the Target Zone. From that point, we anticipate in both scenarios a substantial (though corrective) rally into the red Target Zone (coordinates: $5,805–$7,326).
Elliotwaveanalysis

GMR Power — Extended Wave-3, Contracting Wave-4… Resolution📉 GMR Power & Urban Infra — Weekly Context and Daily Wave-4 / Wave-5 Structure (Elliott Study)
This publication presents an educational Elliott Wave structure study 📚 using the Weekly timeframe for the overall market context and the Daily timeframe to analyse the ongoing Wave-4 correction , its probable termination area, and the conditional Wave-5 projection .
On the Weekly chart , GMR Power shows a clear impulsive advance from the 2023 base into the ₹169.25 region , labelled as Wave-(3) . Fibonacci extension analysis shows that this move exceeded the 3.618 extension and approached the 4.0 level , confirming that Wave-3 is the extended wave . After this peak, price behaviour shifted from strong trending action to overlapping and corrective movement , signalling the development of Wave-(4) .
On the Daily chart , Wave-(4) is unfolding as a contracting triangle (A–B–C–D–E) 🔺. Each leg is corrective and overlapping, volatility has contracted, and momentum has faded. This behaviour is typical of a Wave-4 triangle following an extended Wave-3 , where the market corrects more through time than price ⏳.
From a structural and Fibonacci perspective 📐, the Wave-E termination zone is identified between approximately ₹85–95 . This region aligns with the 0.618–0.786 retracement band of the prior advance. In Elliott Wave studies, Wave-E of a triangle often resolves quietly and may not show a dramatic breakdown, which matches the current behaviour.
Because Wave-3 is extended , Elliott alternation principles suggest that Wave-5 is more likely to be contracted rather than extended . Therefore, Wave-5 expectations are best framed using triangle thrust measurement and reduced Fibonacci relationships to Wave-1 , rather than equality or extension relative to Wave-3.
Using these methods, the primary Wave-5 reference zone lies in the ₹120–140 region . A move toward the ₹160–170 area would be considered a lower-probability stretch scenario and would require clear impulsive behaviour and momentum expansion. A truncated Wave-5 remains possible but is not the base expectation.
This study focuses on structure, probability, and wave behaviour 🧠 rather than prediction. Discussion of Wave-5 becomes relevant only after the triangle completes and price clearly transitions from corrective overlap to impulsive movement .
This publication is shared strictly for educational and analytical discussion 📚⚠️ and does not constitute investment advice.

Star Cement — The Quiet Phase Before the Next Big Move?📉 Star Cement — Primary Wave-4 & Wave-5 Context (Elliott Wave Study)
This post is an educational Elliott Wave structure study 📚 based on the current weekly and daily chart of Star Cement.
Star Cement completed a strong multi-year advance 🚀 from the 2022 lows, peaking near the ₹308–310 region . This advance shows classic characteristics of a Primary Wave-3 , including strong momentum, broad participation, and a terminal phase near the highs.
After the peak, price behaviour shifted from trending to overlapping and corrective , suggesting the market has transitioned into a Primary Wave-4 phase . Among the common corrective patterns, a Flat (A-B-C) structure currently best explains the price action.
Within this interpretation, Wave A declined from ~₹308 to ~₹245 and showed overlapping characteristics rather than a clean impulse. Wave B retraced weakly toward ~₹270 and lacked impulsive strength, which is typical behaviour within flat corrections. Wave C is currently unfolding with overlapping internal swings and reduced momentum, supporting the view that this is a corrective decline rather than the start of a new impulsive downtrend.
From a structural and Fibonacci perspective 📐, the chart highlights a broader confluence area between ₹195 and ₹205 , corresponding to the 0.618 retracement of the entire Primary Wave-3 and the 1.272 extension of Wave A. An extended confluence area is also visible around ₹185–190 , near the 0.786 retracement of Primary Wave-3. These zones are presented purely as areas of analytical interest where flat corrections often mature, not as signals.
In educational terms 🎓, a Flat-C phase typically ends quietly rather than dramatically . Behaviour consistent with a maturing correction would include price stabilising within the ₹185–205 zone , smaller and overlapping candles, failed breakdown attempts with quick recoveries, and the emergence of a clean directional move away from the zone. In contrast, continuation of the correction would be suggested by impulsive downside expansion below ~₹185 , increasing range and volume on declines, and weak rebounds that remain capped below prior resistance zones.
The projected Primary Wave-5 🔵 (shown in blue on the chart) is included strictly for higher-degree context. Wave-5 scenarios are only studied after Wave-4 has fully resolved and the structure transitions from corrective to impulsive. Historically, Primary Wave-5 advances tend to be more selective, often shorter than Wave-3, and occur only after prolonged consolidation or correction. The Fibonacci extension zones associated with Wave-5 are theoretical reference levels that illustrate how analysts frame potential future paths, not expectations.
At this stage, Star Cement remains in a Primary Wave-4 corrective environment . The focus is on observing structure, momentum, and confirmation rather than anticipating outcomes 🧠. Higher-degree trend continuation can only be discussed after the correction completes and the market clearly proves a change in behaviour.
📉 Star Cement — Blue Wave-4 on Daily Timeframe (Elliott Study)
After the advance into the ₹308–310 zone 🚀, price behaviour shifted from trending to overlapping and corrective , marking the development of blue Wave-4 on the daily chart. This phase is characterised by segmented declines , frequent counter-trend bounces, and fading momentum , rather than impulsive selling.
Blue Wave-4 is interacting with a key ₹195–205 confluence zone 📐, with a deeper reference near ₹185–190 , areas where corrective waves often stabilise. Wave-4 corrections typically resolve quietly through time and overlap ⏳, not sharp reversals.
This study is shared strictly for educational and analytical discussion and does not constitute investment advice ⚠️.

FUTU: strong potential for 2024FUTU reached the upper zone of mid-term 52-45 support range and is trying to find a footing.
I like the gap-up with substantial volume today. Re-claiming the 50d moving average would be a constructive next step in shifting the odds of important bottom in place.
Otherwise, if 50.28 level will not hold, next support levels are: 49-45.
Suggested price structure is in-tact until price holds above 40.90 level.
Fundamentally solid with strong sales and earnings growth 4qrts in a row, high EPS growth estimates for 2023 and decent 2024, could be a perspective growth candidate to outperform the markets in 2024 (in favourable environment).

USD/JPY Still Awaits the Next CatalystTechnically, the pair is testing key correction levels after retreating from its 18-month high.
⚡Fibonacci Level (61.8%): USD/JPY found strong support near this retracement level. Holding above this area is crucial to maintaining the long-term upward structure.
⚡Fibonacci Resistance (50%): The 157.80 area is now a key point. If the price can remain stable above this level, the opportunity to retest the 159.00 level will be wide open.
🧭 Key Levels to Watch 🧭
⚡Key Resistance ($158.55): A breakout of the 100-hour SMA is needed to confirm that the correction phase is over and the price is ready to reach a new record.
⚡Critical Support ($157.20 - $157.33): This level (including the 20-day EMA) must be held. A break below this level would open the door to a deeper decline towards 156.00.
⚡This Week's Focus: The market will be closely watching the US PCE data (Thursday), the Fed's favorite inflation indicator, to determine the direction of the dollar's interest rate.

Solana's Price Action reflects some Short-Term AmbiguityPrice now appears to be operating within the b-wave portion of the corrective pattern. While I acknowledge we could see marginally lower prices from here, my base case remains that price recovers and continues to subdivide as depicted in my chart in the black pathway. What remains less clear is whether we are still subdividing to new local lows under the purple alternate, or if the retracement instead continues in a more standard fashion into my target box.
The uncertainty stems from the fact that SOL’s price never decisively traded above the $147–$148 region we have been monitoring for some time. That failure keeps the purple count viable.
However, what lends slightly more confidence to my black primary count over the purple alternate, specifically with respect to Solana, is Bitcoin. BTC has managed to trade above a level that can reasonably be interpreted as the wave iv of a lesser degree. If that interpretation proves correct, it becomes increasingly difficult to envision Bitcoin continuing its corrective advance without exerting upward influence on Solana as well.
As always, time and structure will resolve this short-term ambiguity.

GBPJPY Weekly Outlook GBPJPY Weekly Outlook — Scenario-Based Analysis
Important Disclaimer
Overview
FOREXCOM:GBPJPY enters the week in a transitional phase, where prior bullish momentum is being tested rather than extended. Multiple analytical frameworks — geopolitical context, global macro positioning, technical structure, and Elliott Wave analysis — suggest increased downside risk, but no outcome is guaranteed.
The goal of this report is not to call a top, but to identify where asymmetry currently exists and where risk may be better defined than reward.
1. Global & Geopolitical Context (Why Volatility Risk Is Elevated)
Japan: Event Risk Concentration
This week includes a Bank of Japan rate decision, outlook report, and press conference. These events should be treated as one extended volatility window, rather than isolated releases.
Key considerations:
Market positioning remains skewed toward JPY weakness
Even minor changes in language or forward guidance can lead to temporary or sharp repricing
Outcomes range from:
short-lived spikes
to deeper corrective moves
to full invalidation of current technical setups
None of these can be ruled out in advance.
United Kingdom: Sensitivity to Disappointment
UK data releases this week (labour, CPI, PMIs) add headline risk to GBP pairs.
Importantly:
Positive data does not necessarily translate into sustained appreciation
Negative surprises may amplify downside if technical structure allows
This creates an environment where GBPJPY becomes reactive, not trend-driven.
2. Higher-Timeframe Technical Context (8H / 4H)
From a structural perspective:
The broader trend has been bullish
However, recent price action shows loss of momentum and reduced trend quality
This does not automatically imply reversal — but it does suggest that:
Continuation requires new acceptance
Failure to regain momentum may lead to corrective behaviour
At this stage, the market is deciding, not confirming.
3. Elliott Wave Perspective (Context, Not Certainty)
Impulse Completion — A Possible Interpretation
On higher timeframes, price action can reasonably be interpreted as a completed 5-wave advance, ending near: 214.289
This interpretation is valid but not exclusive. Elliott Wave is inherently subjective and must always be treated as one model among many.
If this count is correct:
The market may be transitioning into a corrective phase
Corrections can be shallow, deep, brief, or complex
If the count is wrong:
Price acceptance above prior highs would invalidate it entirely
Current Working Scenario: ABC-Type Correction
Using lower timeframes, price action can be mapped as a potential ABC correction:
Wave A: 214.289 → 210.769
Wave B: retracement toward 212.838 (~61.8%)
This structure is consistent with corrective behaviour, but remains conditional.
4. Conditional Price Projections (Not Targets)
Based on proportional relationships often observed in Elliott structures:
Scenario -> Reference Level
Wave C ≈ Wave A -> ~209.318
Extended correction -> ~208.358
Deeper correction -> ~207.148
These levels should be viewed as areas of interest, not objectives the market “must” reach.
5. Trade Framework (If — Then Logic)
Primary Working Bias (Conditional)
If price remains below 214.30
And if pullbacks show weak momentum and rejection
Then downside continuation remains a plausible scenario
Example Execution Framework
Entry consideration: 212.30 – 212.85, only on rejection
Invalidation: sustained acceptance above 214.30
Risk management: partial exits, reduced size, event-aware execution
What This Framework Does Not Do
It does not assume inevitability
It does not predict timing
It does not override price confirmation
6. Key Risks to This View
This entire framework becomes weaker if:
Price regains acceptance above the prior high
Momentum expands on the upside
Event-driven volatility produces sustained bullish follow-through
In such cases, standing aside is a valid and often optimal decision.
Final Remarks
GBPJPY currently presents a defined-risk environment, not a high-certainty trade.
The convergence of macro sensitivity, technical fatigue, and a possible Elliott transition increases downside asymmetry, but does not eliminate alternative outcomes.
The objective is not to be right —
it is to be positioned where risk is knowable and invalidation is clear
This report is not a prediction and does not constitute financial advice.
All market analysis is probabilistic, not certain. Price levels, scenarios, and structures discussed below represent conditional frameworks, not guarantees.
Markets can and do invalidate even the most robust technical or macro structures.
Risk management and independent decision-making remain essential.

CrowdStrike undecidedCRWD seems rather undecided whether to follow through with ist corrective path or whether to make new highs. However, we still assign only a 36% probability that the high for wave alt. in green may already be in place; this alternative scenario would be confirmed by a drop below the support level at $402.66.
For now, though, our primary outlook allows for further upside, with the potential for green wave to complete above the resistance at $517.98—and possibly above the current all-time high of $566.90.
Regardless of which scenario unfolds, a move down to the green target zone (ranging from $114.02 to $33.73) appears likely—either sooner (in the alternative scenario) or later (in the primary scenario)—to complete the larger wave II correction.
Once this significant low is established, we expect the stock to move toward new record highs as part of a beige wave III to follow.

Hellena | SPX500 (4H): LONG to resistance area of 7050.Colleagues, the upward movement is not yet complete and remains a priority, but there is one caveat. The completion of the medium-term wave “1” (blue) is quite difficult to predict, as the junior wave ‘3’ may turn out to be wave “5”, since the structure resembles an initial diagonal. However, this does not negate the plan to continue the upward movement, even if there is a deep correction.
At the moment, I expect the resistance area of 7050 to be reached, as I would prefer to give a forecast for the nearest levels now.
Manage your capital correctly and competently! Only enter trades based on reliable patterns!

Gold breaking out of triangle pattern.#gold has formed triangle in wave 4, possible breaking out in bullish direction in wave 5


NVO – Long-Term Cycle View (5–7 Years)Thesis
NYSE:NVO is transitioning from a completed Cycle Wave 2 into a new multi-year expansion phase. The long-term bull structure remains intact, with fundamentals now acting as a catalyst for the next cycle leg.
Context
- Weekly timeframe
- Primary bull trend originates from the 2009 GFC low (< $1)
- Cycle Wave 1 completed in July 2024
- Deep corrective Cycle Wave 2 now appears complete
What I see
-Structural reversal underway from long-term trend support
- Price stabilizing in a major accumulation / buy zone
- New Wegovy pill acts as a fundamental trigger aligning with the technical reversal
- Momentum and structure support the start of Cycle Wave 3
What matters now
- Holding the current base keeps the Cycle Wave 3 thesis intact
- This phase is about accumulation, not timing short-term moves
Buy / Accumulation zone
- Current zone remains suitable for long-term positioning
- This is where multi-year risk/reward is defined
Targets
- Cycle Wave 3 (1.618 Fib): ~$273. Expected around early 2029. Approx. +450% from the buy area
- Cycle Wave 5: ~$415. Expected around 2033. Approx. +730% from the buy area
Income
- Dividend yield ~2.1% adds meaningful carry while holding
Conclusion
Strong technical cycle alignment + improving fundamentals make NYSE:NVO a compelling long-term hold. This is a position built to be held through volatility, not traded.

ETHUSD – Weekly Update | Key Level Being TestedThesis
CRYPTOCAP:ETH remains in a long-term bullish structure. Price is rotating higher without a full reset to the 200WMA, suggesting underlying strength and a continuation bias.
Context
- Weekly timeframe
- Long-term ascending wedge intact
- Prior cycle highs still acting as structural reference
What I see
- ETH did not retest the 200WMA around $2450
- Price reclaimed the 50-day MA around $3000
- ETH is now testing the 0.5 Fibonacci level near $3160
- Structure shows higher lows and improving momentum
What matters now
- $3160 needs to flip to support to confirm continuation
- A successful hold here opens a move toward the upper wedge boundary
- Momentum remains constructive while price stays above the 50-day MA
Buy / Accumulation zone
- Current area around $3160 becomes actionable if confirmed as support
- Deeper pullbacks toward moving averages remain secondary opportunities
Targets
- Near-term: $3800 area (200-day MA + upper wedge confluence)
- Long-term cycle target: ~$9000 (Wave 5 extension)
Risk / Invalidation
- Loss of $3000 and failure to hold the 50-day MA would delay the bullish scenario

Elliot Waves Strategy ExplainedElliott Wave theory is not a forecasting tool. The moment it’s used that way, it becomes useless. It does not tell you where price will go. It describes how participation unfolds once direction is already present.
At its simplest, markets alternate between expansion and digestion. Impulse waves show commitment and follow-through. Corrective waves show hesitation, overlap, and redistribution. Everything else traders add on top is interpretation, not edge.
Most traders fail with Elliott Waves because they try to label the market instead of read it. Wave counts are adjusted after every pullback to protect bias. When a count needs defending, it has already lost its value for execution.
Wave completion does not mean reversal. Strong trends extend, truncate, or move into complex corrections without ever giving clean countertrend entries. Acting on a “finished” wave without a structural break is just early positioning dressed up as analysis.
The subjectivity of Elliott Waves is the warning label. If two valid counts exist, neither can justify risk on its own. Structure, location, and participation come first. The wave count only adds context to what price is already showing.
Used correctly, Elliott Waves help with expectations and trade management. They stop traders from chasing late impulses and from exiting too early during normal corrections. Used incorrectly, they create the illusion of control over an uncertain market.
Elliott Waves don’t give certainty. They give restraint. And restraint is far more valuable.

Dollar At Resistance As you know, yesterday we got the US inflation data, which did not change and remained at 2.7% on a yearly basis, exactly as expected. The real moves came later, after Trump said that Powell is again too late with cutting rates and that markets should move higher on good news rather than falling. He clearly wants to give the impression that it is the Fed’s fault when markets react negatively to positive data.
Another important topic is Greenland, which remains under the spotlight. Trump has repeated several times that the US must own Greenland and even suggested that the US does not rule out using force to take control. This is one of the reasons why we are seeing a pretty strong recovery in energy prices, and there could be even more upside ahead. But despite this uncertainty around potential military actions, stocks are still holding up relatively well for now.
But my eyes are all on the USD. ...it seems to be this correction still appears to be in play since the end of December, but at resistance. It could be a seven swing move rather than a simple ABC rally, but it is still a counter trend movement. Notice that the dollar is now back at the very important 99.30 level, which can be potentially interesting reversal area going into 2nd half of this week. A drop out of the corrective channel and a break below 98.67 could be the first trigger for bears to push the dollar lower.
GH

Silver Is Consolidating, Likely Looking For More UpsideHey guys, today I am looking at silver,
as you know it made a blow-off top back in December, during the Christmas and holiday period, near 85, from where we then saw a sharp pullback of around 14–15% in just a few days. After that decline, the market stabilized around 70, and this kind of stabilization and choppy price action is very normal after a fast move higher followed by a sharp reversal lower. The next phase is usually consolidation, so for now we can see a relatively limited range, roughly between 70 and 84.
From an Elliott wave perspective, it looks like silver is pausing for wave four. Wave four can take different forms, it can be a flat, a triangle, or a more complex combination. Based on the most recent substructure, especially on the 4-hour time frame, a triangle looks quite likely, which means we could still be missing a few legs before the market eventually resumes higher.
The first key support area for a triangle is around 72.70, which also matches this week’s opening area and a small gap left behind, making it an interesting near-term support. Below that, a deeper and more important support zone comes in around 69–67. This lower area would matter if we see more liquidation and extended sideways action, and it could later provide a very attractive rebound zone.
Overall, this still looks like a healthy pause within an uptrend, with potential for one more push higher in the first one to two months of 2026. The key invalidation level for this view is 54.43, since the market should not trade back into that area. Even a move closer to the 61.8% retracement near 62.35 would already raise concerns that this is not a wave four of the degree we are tracking. For now, price is still well above those levels, so patience is needed, allowing the market to settle and consolidate before the next directional move, all within the broader bullish trend visible on the daily and weekly charts.
Thank you for your support
Grega

Hellena | SPX500 (4H): LONG to resistance area of 7010.Colleagues, I expect the upward movement in the medium-term wave “1” to continue.
The minor wave “3” should still be developing, and I expect a repeat update of the high of the higher-order wave “3” (6929.4).
I consider the 7010 area to be the nearest target. If we calculate using Fibonacci expansion, the target is higher, but I always play it safe and take the nearest targets.
Manage your capital correctly and competently! Only enter trades based on reliable patterns!

Palantir: Air is getting thin NASDAQ:PLTR recently reached our designated red short Target Zone, triggering an active short trade. We have been managing risk proactively, reducing the position by 50% after hitting the initial take-profit level. As a result, our stop-loss is now set at the entry price. As the weekly chart indicates, the stock is primarily in a major corrective phase, identified as wave II in beige. This correction is expected to continue, first pausing in the upper green Target Zone ($117.54–$95.10) before potentially extending down to the lower green Target Zone between $72.58 and $40.66. Alternatively, there is at least a 33% chance that the stock could first post a new high for wave alt.I in beige, above resistance at $207.23.

$BABA Breaking Out Of A Bull FlagAlibaba has been trading within a downward channel for last few months, but the structure still looks corrective due to the clear overlaps. Because of that, traders can still watch for a potential turn higher, especially now after a rebound from 147.68 support area, which was also the high back in March 2025. If price can close and finish the day out of a downward channel, as well as above the bullish level at 163.94, then another fifth wave higher could unfold.
At the same time, it is important to keep an eye on 134.35, as a break below that level would question the impulsive trend. Also note the weekly chart, which suggests the market may be in the later stages of wave C, with potential strong resistance later this year near the 78.6% retracement, slightly above the 200 level.
Highlights
– Overlapping structure suggests the move lower is corrective
– Key support to watch is around 147.68
– Daily close above 163.94 would open the door for wave five higher
– Invalidation sits at 134.35
–

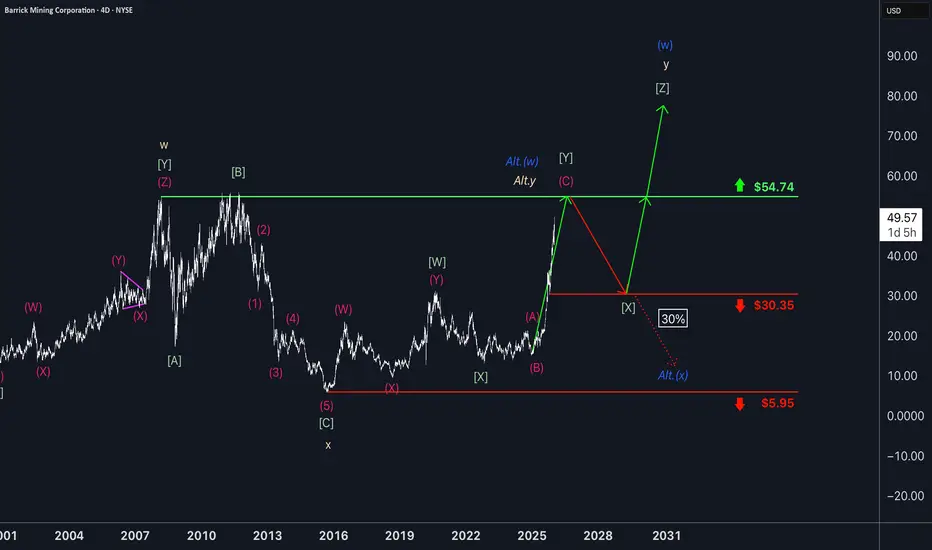
Barrick Gold slowly advancingWithin the ongoing three-wave pattern, the magenta wave (C) is expected to give the miner another boost, ultimately completing the green wave just below the resistance at $54.74. The following wave should then pull the stock back toward support at $30.35, from which wave is likely to start again. This move should once again lift Barrick higher, with the blue wave (w) projected to finish well above the $54.74 level. There is, however, a 30% chance that wave Alt.(w) could wrap up imminently. In that scenario, wave Alt.(x) would push price directly below $30.35, but would still bottom out before reaching the support at $5.95.
OPEN: base building for upsideOpendoor Technologies remains a highly volatile stock, but current price action suggests a potential medium-term reversal. The company continues adjusting its business model to a high-rate environment, focusing on cost control and cash flow stabilization. The US housing market is showing early signs of normalization, while expectations of future monetary easing increase investor interest in deeply oversold growth stocks. OPEN trades far below its historical highs, making it highly reactive to improving macro conditions or positive earnings developments.
Technically, the price has broken out of a long-term descending channel with a strong impulsive move. After the breakout, the stock entered a consolidation phase, forming a price accumulation zone above the broken trendline. Price holds above key EMAs, supporting a bullish structure. The primary scenario favors trend continuation after accumulation, with gradual movement toward higher target zones. The scenario is invalidated if price falls back below the breakout area and holds there.

ETH/USD: Triangle or Double Three in Wave B of a Zigzag?1. We are still in a sideways range.
2. This is a continuation of the previous idea, but the wave B of zigzag is not yet completed.
3. As I said earlier, another pattern may develop in wave B.
4. I am inclined towards a triangle or a double three.
5. However, Ethereum has not yet shown its strength globally, so there is every chance that it will fall even lower, which is why I presented this idea as the main one.

Hellena | GOLD (4H): LONG to max wave "1" 4564.Wave “2” appears to be complete, as waves “abc” are clearly visible, and at the moment I expect a correction in wave ‘2’ of the middle order 4397 to continue the upward momentum of the large wave “3”. The plan is to update the maximum of wave “1” and reach at least 4564.
Next, we will look for an opportunity to continue the upward movement.
Manage your capital correctly and competently! Only enter trades based on reliable patterns!
