SP500 Resumes The Uptrend After Bears Stops At Key LevelUS stock market moved lower recently, and we’ve seen one of the biggest declines in the last few months, with lower highs and lower swing lows for the last couple of weeks, but there is still a chance that this is basically a diagonal formation on SP500, either in wave C or alternatively already in wave A or wave 1. But so far looks more like a completed C wave of a flat due to the current strong rebound, which can be the beginning of a new wave 5 headed towards new highs; What’s important in the near future, in our opinion, is that as long as the market trades above 6512 support, there is a real chance that there will be more upside in the near-term. At least three wave rally is what I would be looking for.
GH
Elliotwaveanalysis
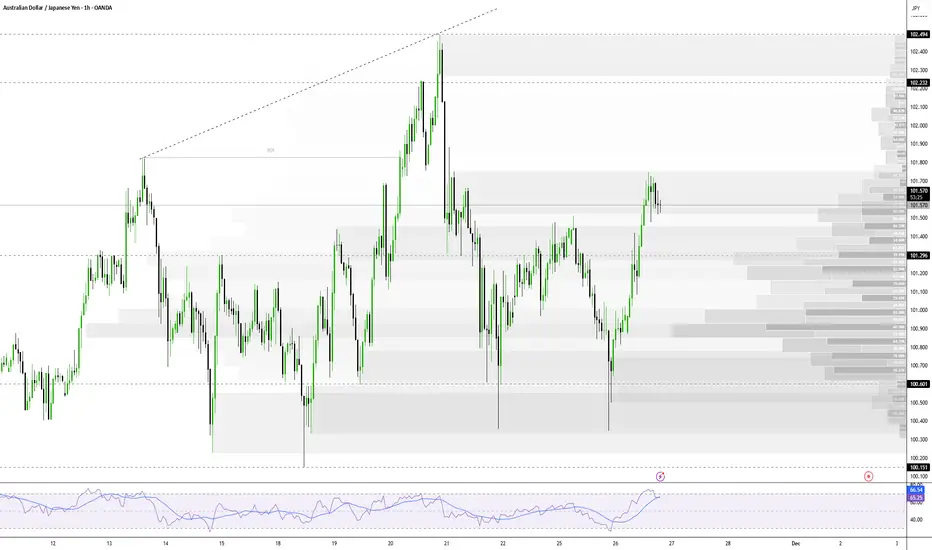
AUD/JPY | Bullish Momentum After Australian CPI Data ReleaseThe AUD/JPY pair gained a strong bullish boost after higher-than-expected Australian consumer inflation data, which dampened speculation of an interest rate cut by the Reserve Bank of Australia (RBA). Currently, the price is at a new weekly high and awaits confirmation of a breakout.
1. Market Fundamental Factors (Drivers of the Upside)
Higher Australian Inflation: The hotter (higher) Australian consumer inflation figures dampened market bets for further interest rate cuts by the RBA.
Impact: This significantly boosted the Australian Dollar (AUD), lifting the AUD/JPY pair to the 101.70 area (a new weekly high).
2. Technical Analysis and Indicators
Long-Term Bias: The 100-day Simple Moving Average (SMA) is rising steadily, and the price is holding above it, reinforcing the bullish bias.
Trend Conditions: Trend conditions will remain favorable as long as the price is above the rising SMA, which is currently below 98.00.
3. Bullish Scenario ⬆️
Strong Upside Trigger: Bulls await a breakout through the nearly three-week-old trading range (currently around 101.70). A decisive MACD push into positive territory would strengthen this case.
Next Target: A move will head towards the 102.45-102.50 region, or the highest level since July 2024, touched last week.
4. Bearish Scenario ⬇️
Initial Key Support: Weakness below the 101.40 area is likely to find decent support near the 101.00 round number.
Trading Range Support: A break below 101.00 could retest the trading range support around the 100.40-100.35 region.
Bias Reversal: A convincing break below 100.35 could trigger technical selling and drag the price below the psychological 100.00 mark, towards the next relevant support near the 99.65 - 99.60 region.
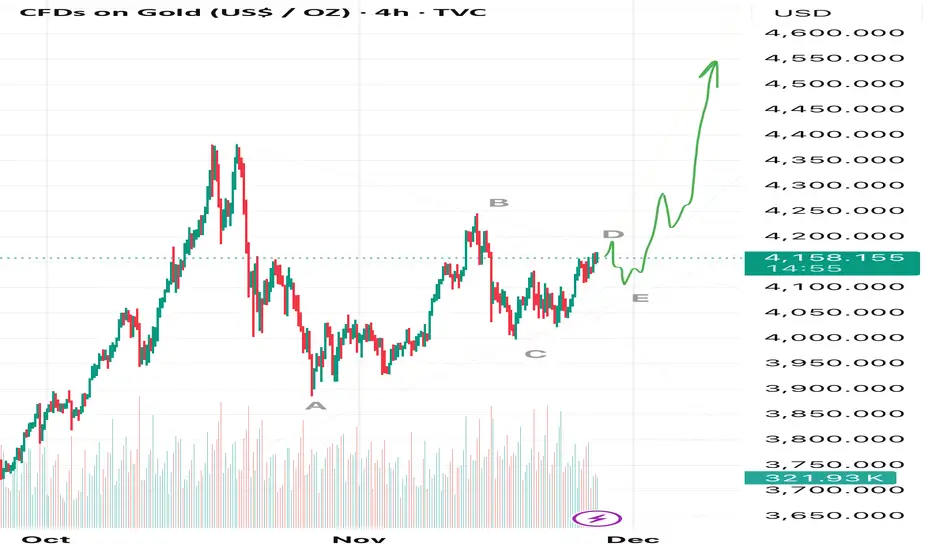
GOLD Triangle Almost Over — Green Arrow to $8000+ Begins After WHere’s the fresh update on Gold that many of you have been waiting for.
In my previous idea I said we had two active scenarios:
🟠 Either we were still building wave C (orange arrow → deeper correction),
🟣Or wave C was already complete and the chart was finishing wave D inside a huge triangle (purple arrow), after which the final green arrow up would start.
My current view:
Wave D (purple arrow) is almost complete!
This means we are literally one step away from a new all-time high. Wave E of this giant triangle is going to form right now — and once it’s finished, Gold will explode upward with the powerful green arrow.
Reminder: my global target remains above $8000+ in the coming years 📈
That’s why we need to watch the completion of wave E very closely — this will be the last major buying zone before the real moonshot!
Stay tuned, I’ll post the exact entry zone as soon as wave E shows its final structure. Don’t miss it — follow and turn on notifications! 🔔
Who’s ready for new ATHs very soon? Let me know in the comments! 👇
Zscaler: Downward Shortly after our last update, Zscaler faced significant downward pressure—completely in line with our primary scenario. This move allowed the stock to turn lower in time, staying below the resistance at $340.25 and avoiding our alternative scenario of an early breakout above that level. However, a quicker peak for the turquoise wave alt.Y remains a possibility, as we still assign a 37% probability to such an accelerated sequence. Primarily, though, we expect further sell-offs as part of the magenta wave , which should eventually give way to renewed gains above the support at $164.78. With wave , the regular wave Y should then complete above $340.25.

Crude Ready For New Strong Leg UpCrude oil is recovering for the last few weeks, after new sanctions against Russia, with price rebounding from 56 sharply and impulsively. This suggests an important new swing low is in place, and we should now be aware of more upside ahead, with a minimum three-wave recovery that could take us toward 66.60 or even higher, after that wave b/ii setback which is now coming to an end at 58-59 support area.
Even HS bullish pattern is calling for more upside.
GH

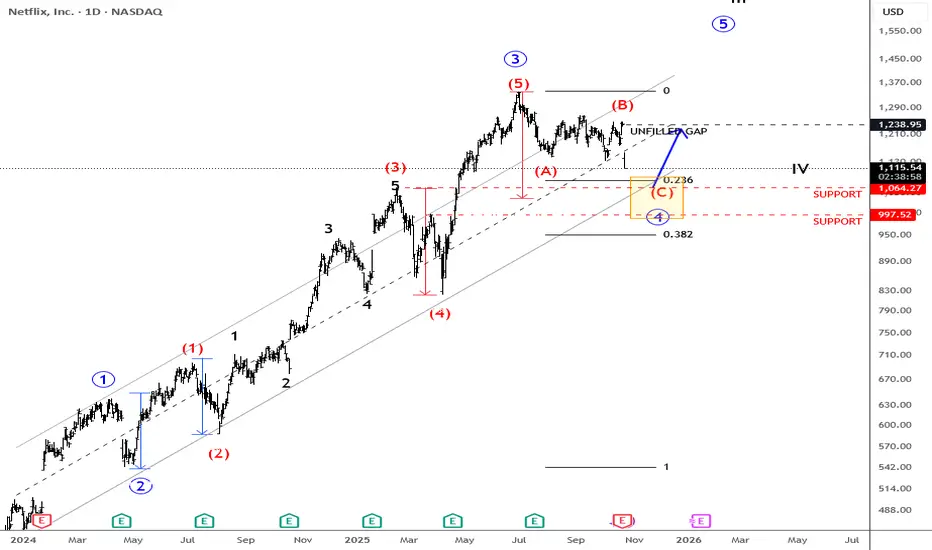
Netflix Down After Earning, But Its Hunting SupportNetflix is coming down after earnings and is currently trading more than 10% lower. Whenever we see such a sharp reversal, it’s important to zoom out and look at the broader trend. From the 2023 lows, there is still a very strong and impulsive recovery, so this could be just a temporary deeper corrective pause before the uptrend resumes.
In Elliott Wave terms, it looks like a potential fourth wave retracement that could start to stabilize somewhere around the previous wave three high near the 1060 area, or possibly a bit lower, closer to the 1K level. This whole zone could be quite attractive for a rebound, especially since some of the gaps above the current price may still be filled — something that often happens when a stock remains in an uptrend.
In my view, there’s still a good chance for a nice recovery and continuation higher in the weeks to come.
Grega
Highlights:
Trend: Bullish (consolidation in wave four approaching support)
Support: 1060, 1000
Resistance: 1260
Note: Stock can stabilize after wave 4 and try to fill the earnings gap at some point in the future.
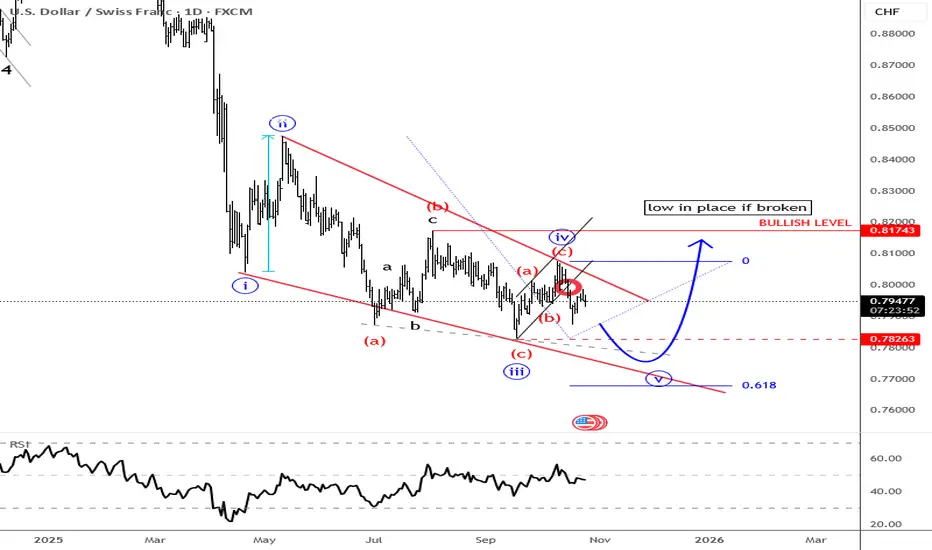
USDCHF Forming An Elliott Wave Ending DiagonalUSDCHF has made a nice and interesting recovery since September, but so far only in three waves, with a recent reversal down from around the 0.8070 area, so recovery might have been just another corrective rally within an incomplete downtrend. As we know, if we don’t see five waves up from the lows, then the bottom is likely not in place yet. In fact, if current prices break the channel support and move through 0.7940, we should be aware of a possible retest of the 2025 lows, which could be the final leg within a higher-degree ending diagonal. Also keep in mind that USDCHF could still move lower even in a risk-off mode, as the Swiss franc tends to act as a safe haven in times of uncertainty. However, if we see a sudden and very strong franc in the weeks ahead, the Swiss National Bank could step in and take action to prevent it from rising too far, as they already expressed some concern about that in recent statements.
KIWI: Preapering To Complete Bearish Sequence? NZDUSD is in a very deep retracement, showing lower lows and lower swing highs from July, but if we look closely, there’s a lot of overlapping price action. In fact, over the last few weeks, it seems bears are losing some momentum, supported by RSI divergence, and we could even be forming an ending diagonal here in wave C of a potential three-wave drop from the July–summer highs. So despite this deep retracement, which is already more than 7%, there could still be an interesting rebound in the weeks ahead — ideally from around the 78.6% retracement of the April–July recovery. If we’re correct, we might already see some kind of rebound from a new intraday low this week.
Grega

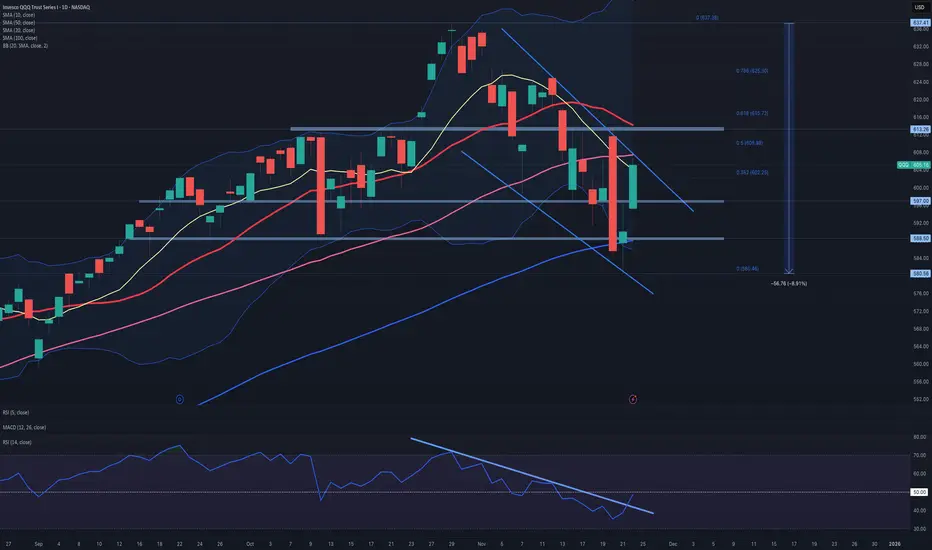
$QQQ: IS THE PULLBACK OVER ?Has the pullback from the all-time high concluded?
Analysis of the chart indicates that the decline from the all-time high appears corrective. This suggests it is unlikely to undermine the prevailing upward trend that began at the lows observed in April, despite registering a 9% decrease.
It is noteworthy that the 0.382 retracement level lies at 548, and the 200-day simple moving average (SMA) is positioned at 544. Consequently, the correction remains well within the boundaries of the existing uptrend, as it has yet to approach the typical 0.382 retracement threshold.
There is also potential evidence of a bullish flag pattern emerging.
The presence of a bearish marubozu candle followed by a doji during the downtrend could imply a potential reversal, with today's bullish gap-up-and-go serving as a possible confirmation signal.
Furthermore, the 14-period RSI has surpassed its resistance trendline; however, this should be validated by a sustained move above the 50 level.
While there are encouraging technical signals, a definitive bottom has not yet been confirmed yet.
Key indicators to monitor include:
• The establishment of higher highs and higher lows, maintaining support at 588.
• A break above the upper trendline of the flag pattern, including moves above the 50-day moving average and significant resistance at 613.
Although QQQ continues in a favorable direction, it is premature to confirm a conclusive trend reversal at present.
S&P500: Poised for Further Pullback The S&P 500 futures are currently trading just above support at 6,540 points, but are expected to see a temporary pullback within magenta wave (4). In our primary scenario, we anticipate the sell-off will extend into the green Long Target Zone between 6,163 and 5,912 points. From this area, we expect the start of wave (5), which would complete the magenta five-wave sequence and push the index higher—ideally above resistance at 6,952 points. This move would also mark the final high of the broader blue wave (III). However, if selling pressure intensifies and the Long Target Zone is breached, our alternative scenario will come into play (probability: 31%). In this case, blue wave alt.(III) would already be complete, and the index would enter a significantly deeper correction phase.

$SPX: dead cat bounce SP:SPX : Following the unexpected downturn on Thursday, SP:SPX stabilized last Friday after an intraday decline below the horizontal support at 6,550, which aligns with the 100-day simple moving average (SMA). The candlestick wicks on the daily chart suggest a potential short-term pause in the prevailing selling pressure. Monday will probably see a continuation of the rebound from Friday’s lows; however, it remains unclear whether Friday’s low marks the end of the current pullback. The RSI14 is approaching, but not yet within, oversold territory, and does not exhibit positive divergence. For the upside scenario, retracement levels from Friday’s high have been identified. Bulls must first reclaim the 6,530 resistance to maintain momentum; nevertheless, unless the key resistance at 6,770—168 points above Friday’s close—is breached, the probability of another downward move remains elevated, targeting the 6,360–6,340 region.
NVIDIA (NVDA): Where Are We in the Cycle?Ticker: NVDA
Category: Market Structure / Elliott Wave Analysis
Author’s note: Educational analysis — not financial advice.
🧠 Market Context
NVIDIA has been one of the strongest growth stories in the last market cycle. However, after such a powerful move, many traders are now asking: Where are we in the broader structure — and what could come next?
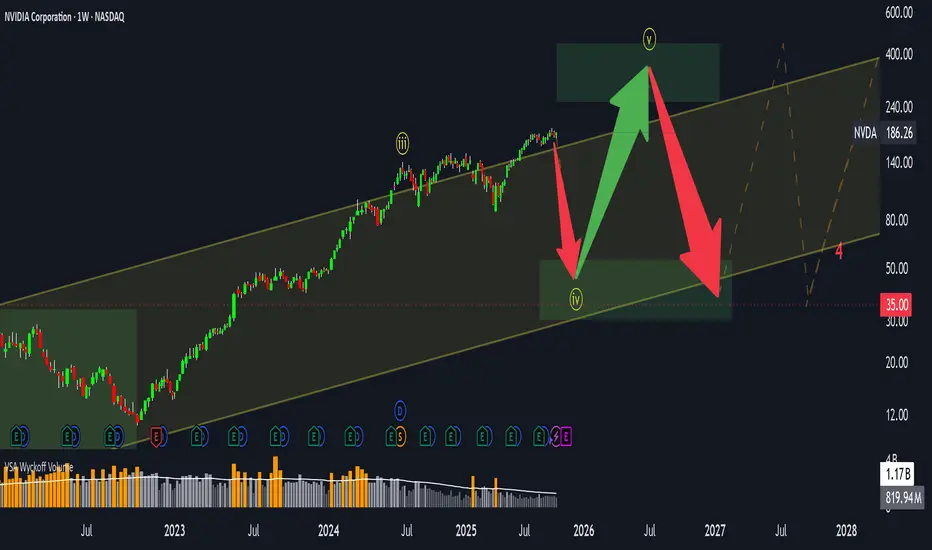
From a structural perspective, NVDA appears to have completed its third Elliott Wave, with the fourth wave currently in progress. This phase often reflects a period of consolidation, where the market digests previous gains before potentially starting the fifth wave.
📊 Elliott Wave Structure
Through the lens of Elliott Wave theory:
Wave 3 — likely completed after the parabolic advance that marked NVIDIA’s latest all-time highs.
Wave 4 — a corrective phase, potentially forming a sideways or slightly downward structure.
Wave 5 (ahead?) — may still occur, possibly extending above the upper boundary of the current price channel.
However, once the fifth wave completes, markets typically enter a longer consolidation or corrective phase — often retracing 50–60% of the total move from the highs.
⚙️ Volatility and Price Range
Currently, NVDA is trading within a broad channel, roughly between $100 and $400+.
Volatility remains elevated — which suggests that the sideways phase could persist for several months, or even longer.
Such behavior is common in late-cycle stages when large market participants distribute part of their holdings while retail interest remains high.
📈 Key Takeaways
The main impulsive move seems to have already played out.
The market may enter a range-bound or sideways phase, with local rallies still possible.
Correction risks are gradually increasing, especially if the fifth wave develops and fails to sustain new highs.
In short, this might not be the best time to chase — but rather to observe how price behaves within the current channel.
💬 Final Thoughts
This analysis is purely educational and reflects one possible scenario based on market structure.
No one can predict the exact timing or depth of the next move — the market always decides.
👉 What do you think?
Are we already in the correction phase, or is there still one more leg up left for NVDA?
Share your view in the comments below 👇
TSLA: Fundamentals Are Collapsing While Valuation Stays in OrbitTesla is trading near multi-month highs… but the fundamentals tell a very different story.
EPS has dropped by 50%, revenue growth has almost stalled, and yet the stock still carries a Forward P/E of 164.
This combination — slowing growth and extreme valuation — looks like the definition of an institutional bubble setup.
🧮 Fundamental Context
Over the past few years, Tesla’s growth has slowed dramatically:
Revenue rose from 31B → 53B → 81B → 96B → 97B — barely any increase.
EPS climbed from 0.2 → 1.6 → 3.6 → 4.3 — and then fell by half.
Quarter-over-quarter metrics remain negative, with no visible recovery trend.
Meanwhile, the Forward P/E of 164 implies double-digit expansion ahead — which clearly isn’t happening.
The fundamentals simply do not justify this kind of valuation.
Right now, Tesla’s numbers resemble the early phase of a valuation compression cycle — where prices eventually catch up with reality.
📉 Technical Structure
Technically, Tesla has been moving in a broad sideways range, forming what looks like a long-term Wave 4 structure.
We’re currently inside the “B” leg, which could already be complete or near completion.
Once that wave ends, the next expected move is a Wave C decline.
Key levels to watch:
📍 Upper resistance zone: $400 – $550
📍 Primary cluster: around $250
📍 Support zone: $150 – $200
The chart shows clear volume concentration around $250 — once that level breaks, the next liquidity pocket sits between $150 and $200.
That’s where a potential bottoming cluster could form before the final upward leg.
⚠️ Market Outlook
While other FANG names maintain solid balance sheets and stable earnings, Tesla’s fundamentals are deteriorating sharply.
Yes, the stock may still see short-term pumps driven by sentiment or Musk’s fan base — but markets always return to fundamentals.
And those fundamentals are pointing downward.
📊 Summary
EPS and revenue both trending lower 📉
Forward P/E at 164 — completely disconnected from growth metrics
Technical range suggests potential decline toward $200–$150
Current price action likely part of a larger corrective structure
Long-term investors should exercise extreme caution ⚠️
Tesla isn’t a short-term “growth story” anymore — it’s a valuation risk story.
Until earnings stabilize and margins recover, this stock looks massively overpriced.

Bitcoin: Is the Market Reaching a Historical Turning Point?📅 Update: October 2025
💡 Format: Educational analysis — not financial advice
Historical Context
Looking back at Bitcoin’s (BTC) price history, a clear pattern emerges: roughly every four years, the market experiences a major correction following a strong bullish cycle.
Key examples include:
2011
2013–2014
2018
2022
Each time, Bitcoin saw a drawdown of –75% to –93% from its previous highs. These deep retracements have historically marked the end of a growth phase and the beginning of a new accumulation cycle.
Current Elliott Wave Structure
According to Elliott Wave analysis, Bitcoin appears to have completed its third and fourth waves, while the fifth wave is currently unfolding.
However, the recent price action suggests that this fifth wave might already be nearing its conclusion.
The price remains within an upward channel, testing the trendline for the fourth time — a technical signal that often indicates weakening bullish momentum and a potential transition to a corrective phase.
Main Scenario: Possible Trend Reversal
For a confirmed shift in trend, Bitcoin would need to break below the channel’s lower boundary.
A typical technical sequence would look like this:
A breakdown below the trendline
A retest of the broken level from below
The beginning of a stronger downward move
This process usually unfolds over months, not days — a slow structural change rather than a sudden reversal.
Potential Downside Range
Based on historical patterns, a post-peak correction could bring Bitcoin into the $40,000–$30,000 range.
This is not a forecast, but rather an educational scenario grounded in the recurring market behavior seen in previous cycles.
Conclusion and Community Discussion
📊 At this stage, Bitcoin’s overall structure remains bullish, but signs of momentum exhaustion are becoming more apparent.
The key factor to watch is how price reacts to the main trendline — whether it holds as support or gives way to a deeper retracement.
❓Which scenario do you find more likely?
Continued growth and new highs
Or a corrective phase toward lower levels?
🗨 Share your thoughts and charts in the comments — let’s discuss it together.
🔔 Follow for more educational breakdowns, and suggest which tickers you’d like to see analyzed next.

Solana: Room for moreSOL recently dipped further into the now green Target Zone between $155.80 and $113.20. Within this area, we expect the low of wave ii in orange to be established imminently. Afterward, we anticipate a strong wave iii rally, which should peak above resistance at $295.31.

"LLY's Bear Market Mode ON | Crash Incoming"“ LLY is gearing up for a sharp correction down to the $35–$17 zone — a critical reset that could flush out weak hands before the next explosive bull run. Stay sharp, this is where big opportunities form. ⚠️
🔥 Summary:
Eli Lilly (LLY) looks ready for a major market reset after completing a historic five-wave climb. This could be the start of a long-term corrective Wave 2 , potentially wiping out years of gains before the next explosive super-cycle takes off. The bull run isn’t over — but it’s taking a serious pause. ⚠️📉
🌊 Wave Theory Outlook
LLY’s multi-decade Elliott structure shows a completed Cycle Wave 1 peaking near the 2.618 extension zone around $1029. Historically, such extensions often mark exhaustion.
Next comes Wave 2 , which could retrace deep into the $35–$17 zone (the 0.618–0.786 Fibonacci region and prior structural base). Expect a complex W-X-Y pattern , shaking weak hands before a powerful Wave 3 bull expansion later this decade.
📉 Price Action & Smart Money Context
The chart shows exhaustion wicks, momentum divergence, and slowing volume — classic signs of distribution .
Smart money is likely off-loading near the highs , preparing to reload at discount levels once liquidity below 2020–2022 lows is taken.
Expect liquidity sweeps, imbalance fills, and a long-term accumulation base forming near the orange demand zone before the next breakout.
💰 Fundamental Alignment
Despite incredible fundamentals — obesity and diabetes drug leadership, global demand growth, and innovation — valuation gravity always returns .
A deep correction would align price with sustainable earnings and provide institutional re-entry opportunities at fair value.
🧠 Traders ,
"the charts are whispering — a major LLY correction is loading.
Our projections highlight the $35–$17 zone as the key accumulation region before the next super-cycle.
Stay alert, plan your levels, and don’t fight the wave. 🌊📉
Where do you think LLY bottoms out? Share your thoughts below 👇”
— Team FIBCOS
#LLY #EliLilly #BearMarket #Correction #WaveTheory #SmartMoney #ElliottWave #Fibcos #TechnicalAnalysis #PriceAction #Investing #PharmaStocks #StockMarket #MarketCycle #ChartAnalysis #Bearish #Wave2 #TradingView #StockAlert #MarketReset

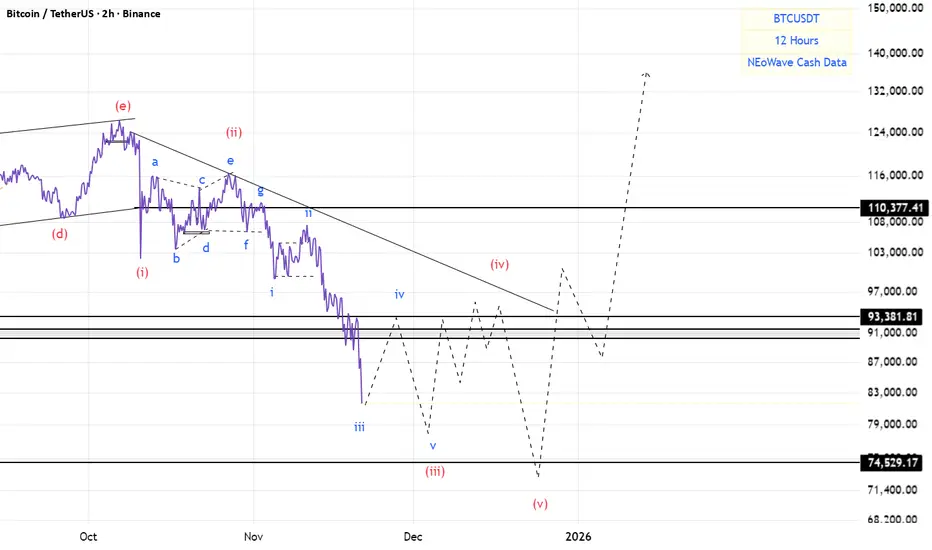
BTC(based on NEo wave)everything is ok with flat.
time of wave B is more than wave A and wave C is making a beautiful impulse wave.
bitcoin price under 74500$ is a bear trap!

BTCUSDT – Blue Box Reversal IncomingHi fellow traders,
On the 1D BTCUSDT chart, I am applying Elliott Wave principles to outline a potential long setup. Price has tapped into the blue box after completing a ZIGZAG correction, and this region may provide the foundation for the next impulsive leg within the higher-degree structure.
I am entering at the current price, with a Stop Loss at 73,900.00. My Take Profit is set at 132,366.25, based on the projected continuation of the larger impulsive count.
If price breaks below the structural low around the stop level, this trade is no longer valid.
Good luck and trade safe!

BTC(based on NEo wave)This branch has impulsive structure.
so why now there is an impulse wave here?
because this 5 waves are wave (c) of a flat.
when this 5 wave finished strong bullish wave will start.
BTC TrendI don't believe in the curve trend line for BTC; I think the Schiff Pitchfork is the best way to illustrate the BTC trend.
From the last BTC analysis, I indicated on the chart that a bear market is approaching. My targets for this downtrend are 80, 78, 75, and 69.

Pgsus is about the end WXY correctionPegasus Airlines about the finish WXY correction as c of abc correction as an ending diagonal which is strict rules that wave 5 must be shorter than wave 3 so we have a clear stop loss point which is 190,5.

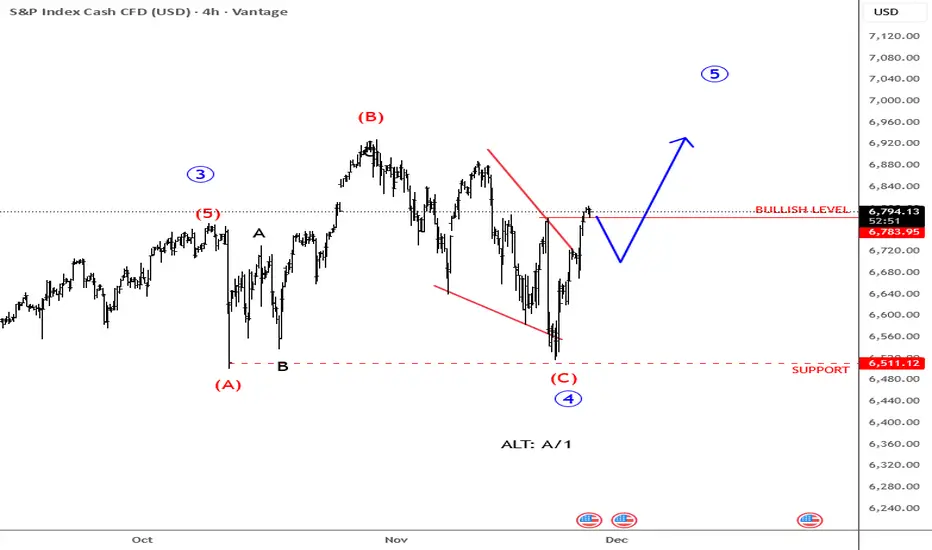
Hellena | SPX500 (4H): LONG to resistance area of 6775.Dear colleagues, according to the last forecast the price is at the support level, but as it turned out, the correction in wave “4” is a bit more complicated than I thought.
Wave “4” consists of three waves “ABC” and should be over soon. The upward movement is still in priority, but I will target the not so distant resistance area of 6775.
Once it is reached, we will think about how to reach higher levels.
Manage your capital correctly and competently! Only enter trades based on reliable patterns!

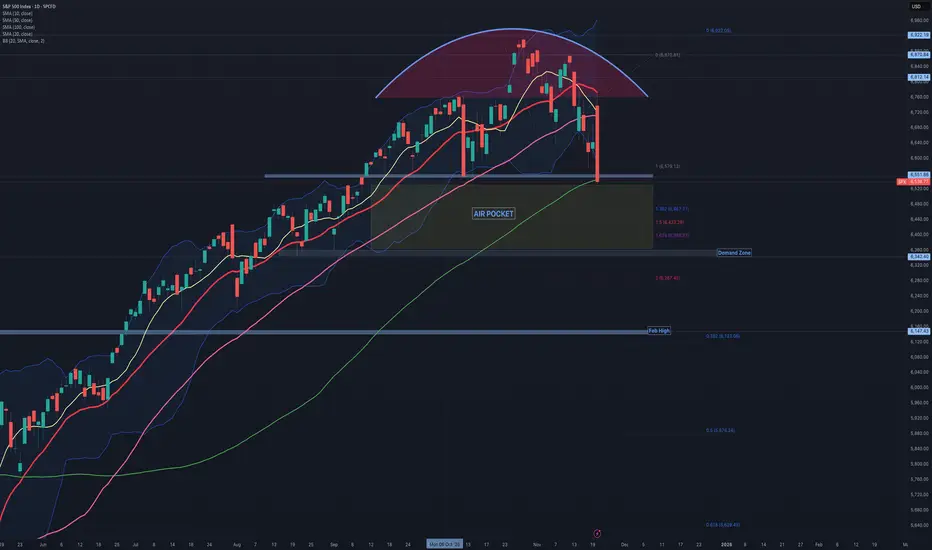
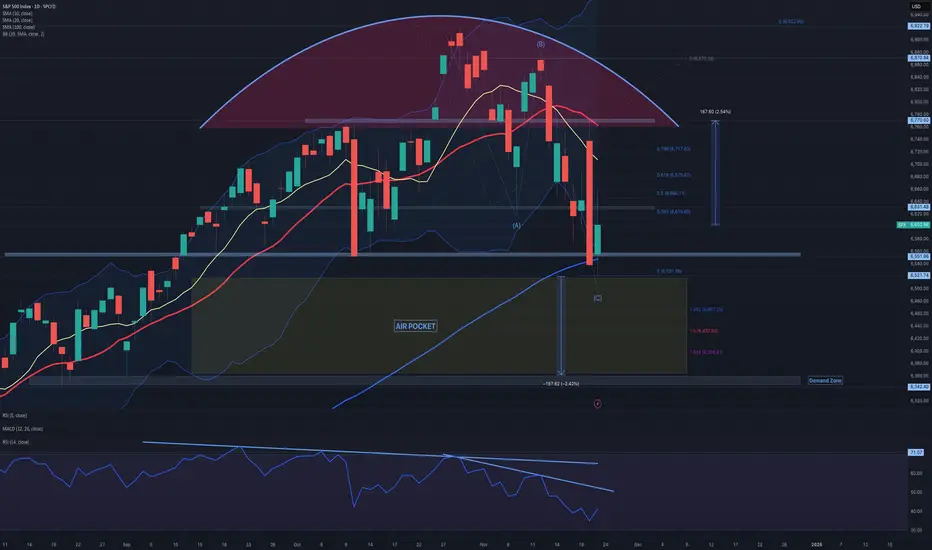
$SPX: A worrying Intraday Turnaround!While everyone, even the taxi driver, was celebrating NVDA's positive earnings report, the SP:SPX suddenly reversed. After touching the 20-day simple moving average, it dropped sharply with no buyers stepping in. With a 3.5% swing between the intraday high and low, the SP:SPX closed slightly below the horizontal support level at 6,550 and the 100-day moving average.
It's unfortunate that the right shoulder is missing, as it would otherwise form a perfect head and shoulders pattern—though it might be more accurately described as the head of a one-armed head and shoulders. Jokes aside, the technical outlook for the SP:SPX has significantly deteriorated. The market's bullish sentiment has evaporated, making it more challenging to establish a bottom.
If the S&P 500 doesn’t recover and consolidate support around 6,550 by Friday—an extremely important level that also aligns with the 1:1 extension below—we could face an “Air Pocket” of approximately 175 points. Within this Air Pocket area, we have extensions at 1.382, 1.5, and 1.618. The 14-period RSI is approaching oversold conditions, but it's not quite there yet.