AMAZON - EMA 200: Where Institutions Step InAMZN - CURRENT PRICE : 237.70
📈 AMZN — Institutional Support Holds, Momentum Breakout
AMZN continues to trade in a primary uptrend, with EMA 200 acting as a strong institutional accumulation zone. Multiple pullbacks toward the EMA 200 (highlighted in green) were met with immediate buying interest, confirming long-term demand.
Momentum is now turning bullish:
🔥Price has broken back above the Ichimoku Cloud, signaling trend resumption.
🔥RSI is crossing above the 60 level, a classic sign of bullish momentum acceleration.
This setup favors momentum traders looking to enter as the uptrend resumes.
ENTRY PRICE : 235.00 - 237.80
TARGET : 258.00 (All Time High level)
SUPPORT / INVALIDATION : EMA 200
📌 As long as price holds above EMA 200, the bullish structure remains intact.
Exponential Moving Average (EMA)

TVTX - Breaks a 10-Year High – A New Chapter BeginsTVTX - CURRENT PRICE : 38.21
TVTX has made a major technical breakout by moving above its 10-year high at $37.04, a level last seen in August 2015. This move places the stock firmly into price discovery, meaning there is no nearby historical resistance overhead. Importantly, the breakout is holding, with the previous resistance now acting as strong support, a key sign of a healthy and sustainable uptrend.
Looking back, the 24 December breakout can be viewed as an ascending triangle breakout, where price consistently made higher lows before finally pushing above resistance. This pattern often signals strong accumulation and continuation rather than a short-term spike. Trend indicators remain supportive, with price trading above the EMA 50 and above the Ichimoku Cloud, both pointing to a well-established bullish trend.
From a price action perspective, the latest candlestick structure has formed a Bullish Harami based on Japanese candlestick analysis , suggesting selling pressure is fading and buyers may be preparing for the next move higher. As long as TVTX continues to hold above the former resistance zone and the EMA 50 on a daily closing basis, pullbacks are considered buy-on-dip opportunities. The next upside targets are $42 followed by $45, while a daily close below the EMA 50 would invalidate the bullish setup and serves as a cut-loss level.
ENTRY PRICE : 38.21
FIRST TARGET : 42.00
SECOND TARGET : 45.00
SUPPORT : EMA 50 (Cutloss if price closed below EMA 50)

MU – Trend Still Intact, EMA50 Bounce SetupMU - CURRENT PRICE : 220.00 - 222.00
Technical Reasons (Bullish Bias)
1️⃣ Price retesting strong dynamic support
Price is holding above the 50-day EMA, which has acted as support throughout the uptrend. Pullback into EMA50 often forms a bullish continuation point.
2️⃣ Price still above the Ichimoku Cloud
Price is trading above the cloud, meaning long-term trend remains bullish. The cloud is thick — showing strong trend support. Latest pullback is testing the top of the cloud, usually a high-probability bounce area.
3️⃣ RSI turning up from mid-zone (not overbought)
RSI is around 50, which is a healthy reset in an uptrend. No overbought conditions → room for upside continuation.
4️⃣ Trend structure remains bullish
Higher highs & higher lows remain intact. Current candle shows buying interest at key support.
5️⃣ Market respects previous breakout area
Price pulled back to retest September–October breakout zone → classic break-and-retest setup.
ENTRY PRICE : 218.00 - 222.00
FIRST TARGET : 236.00
SECOND TARGET 260.00
SUPPORT : 201.00

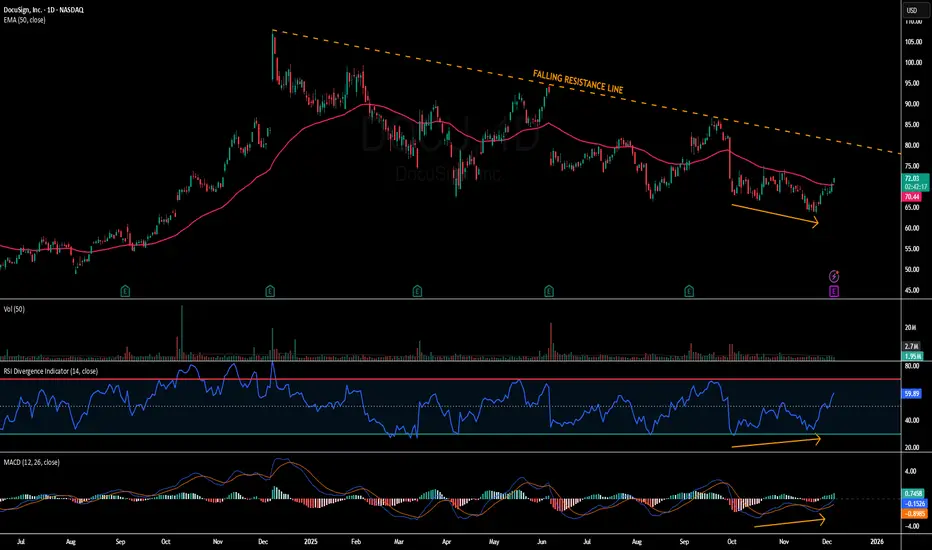
DOCU - Trendline Resistance in FocusDOCU - CURRENT PRICE : 71.87
Short-term outlook for DOCU is bullish as price moves above the EMA50, supported by RSI holding above 50 and bullish divergence in both RSI and MACD (look at orange arrows). Momentum continues to improve with a MACD bullish crossover, positioning DOCU for a move toward the long-term downtrend line. First target is $79 near trendline resistance, with a potential extension to $85, while $65 remains the key support and invalidation level.
ENTRY PRICE : 70.00 - 71.87
FIRST TARGET : 79.00
SECOND TARGET : 85.00
SUPPORT : 65.00
PATH - Price Reclaims 50-EMA and 200-EMAPATH - CURRENT PRICE : 14.50 - 14.70
PATH is gaining traction after reclaiming both the 50-EMA and 200-EMA, signalling a shift back into short-term bullish momentum 📈. Price strength is supported by rising RSI and an improving MACD cross, suggesting buyers are regaining control.
🔥 Bullish Points
Price reclaimed 50-EMA and 200-EMA
RSI trending above 50 → bullish momentum returning
MACD turning positive with increasing histogram
Volume uptick on recent green candles = buyers active
ENTRY PRICE : 14.50 - 14.70
FIRST TARGET : 16.00
SECOND TARGET : 17.30
SUPPORT : 13.00

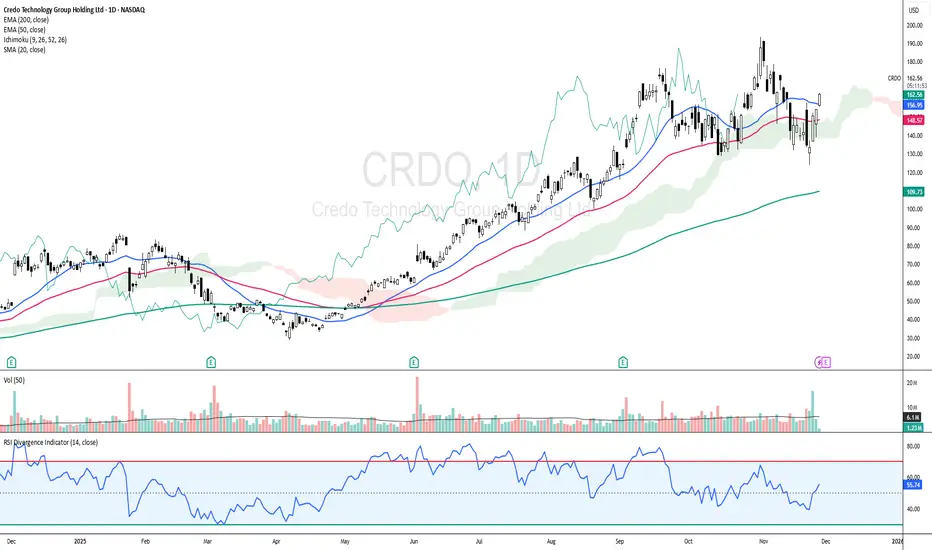
CRDO: Cloud + EMAs Aligning for Upside ContinuationCRDO - CURRENT PRICE : 162.95
CRDO is showing a bullish reversal setup as price rebounds and closes back above the EMA50 while holding firmly above the Ichimoku Cloud , signaling the major trend remains intact. Momentum is improving with RSI rising above 50 and not yet overbought, supported by increasing volume on the recent bullish white candlestick.
Today’s move above the 20-day SMA adds a positive layer to the short-term trend structure. Short term targets are 175.00 and 185.00 while support is 148.00.
ENTRY PRICE : 160.00 - 162.95
FIRST TARGET : 175.00
SECOND TARGET : 1.85
SUPPORT : 148.00
btc finds 200 ema support, whats next?As I have been posting in these "Ideas" for the past few weeks about market direction and where the price for BTC will go. It now has come to pass where the 200 EMA has been tested and support has been found, It however has not generated any relief among buyer sentiment unable to push price above the previous days close leaving the digital asset to continue to bleed out and cause positions from all the 93k Bulls to liquidate.
Its a shame people cannot make the connection that the only way price can go higher is to go lower in a market. That Is why I am going to warn people about where we may go , I believe the 200 EMA will be tested again and if support is broken it will send is into the low 70k area where there are open orders and It is possible this may happen. The Bull market support band is the 200EMA however there may be institutional money that may drive us down to cause massive liquidations and fear and panic among those holding bags while greed causes big players to push more into the fringe of where we can maintain a recovery.
Watch for a retest of the 200EMA . which is a bit of a fuzzy zone , use the high and low to denote the area for support as well as keep an eye on the RSI and CCI , we are also watching on balance volume drop off which is not a great sign that there is market confidence however this will play out over the weekly and the weekly candle will start to materialize in the next few days.

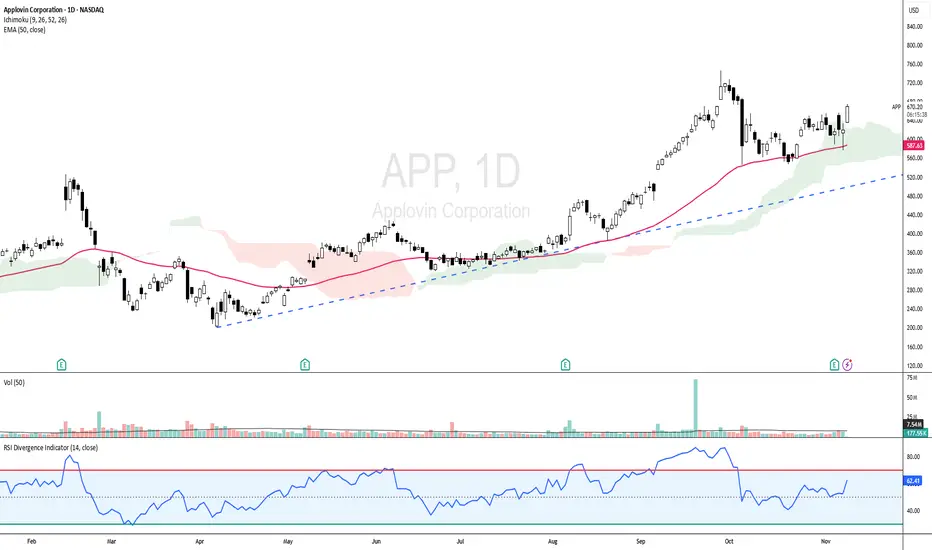
APP - UPTREND STILL INTACT!APP - CURRENT PRICE : 670.00 - 674.00
APP is showing strong bullish momentum as the price trades above the 50-day EMA and ICHIMOKU CLOUD , indicating a sustained uptrend. The RSI is in bullish territory but not yet overbought, indicating room for further upside. With the current setup, the stock has potential to retest its all-time high area if momentum continues.
ENTRY PRICE : 670.00 - 674.00
FIRST TARGET : 727.00
SECOND TARGET : 770.00
SUPPORT : 50-day EMA
ANET - Rebounds from EMA 50ANET - CURRENT PRICE : 148.00 - 149.00
Technical Rationale:
1. Rebound from Key Moving Average Support
The stock price has rebounded strongly from the 50-day EMA, which has acted as a dynamic support level throughout the uptrend. This rebound indicates renewed buying interest at a technically significant area.
2. Bullish Momentum Confirmation
ANET has crossed above the 20-day SMA, suggesting a short-term shift back to bullish momentum after a healthy pullback. This crossover reflects improving short-term trend strength.
3. Rising Support Line Intact
The long-term rising support trendline remains intact, confirming that the broader uptrend structure is well-maintained. Each corrective phase has so far been supported near this line, reinforcing the bullish bias.
4. Momentum Indicator (RSI)
The RSI is recovering from the mid-zone (~53), showing that bullish momentum is building again without being overbought. This supports the potential for further upside continuation.
ENTRY PRICE : 148.00 - 149.00
FIRST TARGET : 162.00
SECOND TARGET : 173.00
SUPPORT : 136.00

MRVL - RSI Back Above 50, Eyes Fibonacci Targets at 99 and 112MRVL - CURRENT PRICE : 86.00 - 88.00
MRVL is showing early signs of bullish continuation after finding support near the 50-day EMA and rebounding with positive momentum. The price structure remains healthy as it trades above the EMA 50, suggesting the medium-term trend is still intact.
Key Technical Highlights :
1) Price Above EMA 50
The stock price is holding above the EMA 50, showing that the uptrend remains valid and buyers are still in control.
2) RSI Above 50 and Not Overbought
RSI has crossed back above the 50 level, confirming improving momentum while staying below overbought territory, leaving more room for upside.
3) MACD Structure
Although the MACD line is still below the signal line, both are positioned above the zero level, indicating the overall market tone remains positive with potential for a new bullish crossover.
Based on Fibonacci extension, potential upside targets are at :
1st Target: USD 99.00 (0.618 level)
2nd Target: USD 112.00 (1.000 level)
ENTRY PRICE : 86.00 - 89.00
FIRST TARGET : 99.00
SECOND TARGET : 112.00
SUPPORT : 80.50

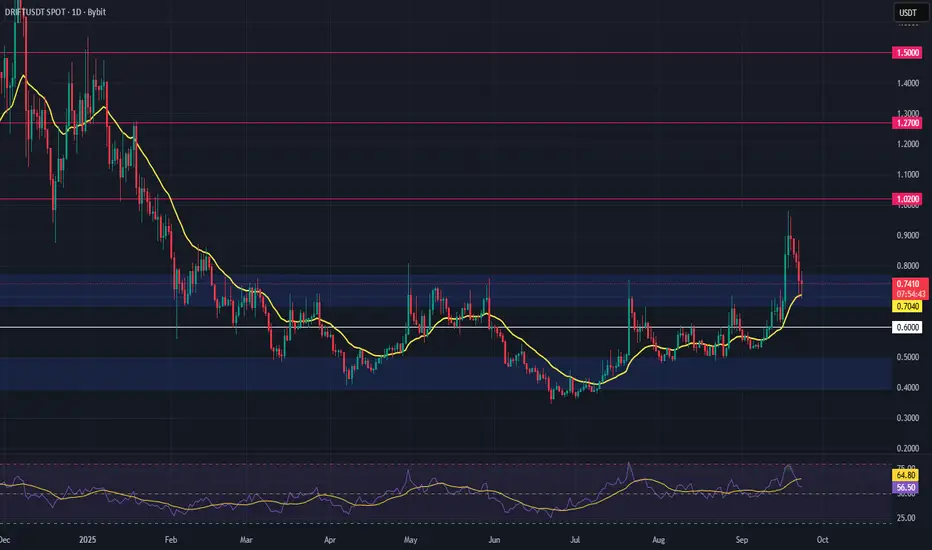
DRIFT Breakout Setup – Higher High + Retest in PlayDRIFT is showing strong bullish momentum after months of accumulation. The token has broken out, printed a higher high, and is now retesting the previous range high as support — a classic setup for continuation.
With price hovering near the 21-day EMA, this zone could act as a launchpad if sentiment holds. The structure supports a potential leg higher, making this a high-reward, low-risk opportunity for swing traders.
🔹 Trade Setup
Entry Zone: $0.68 – $0.72
Take Profit Targets:
🥇 $1.02
🥈 $1.27
🥉 $1.50
Stop Loss: Daily candle close below $0.60
📊 Keep an eye on volume confirmation and overall market sentiment. A clean bounce from this support zone could validate the setup.
📌 Like, comment, or share your thoughts below!
🔔 Follow for more crypto setups and technical insights.
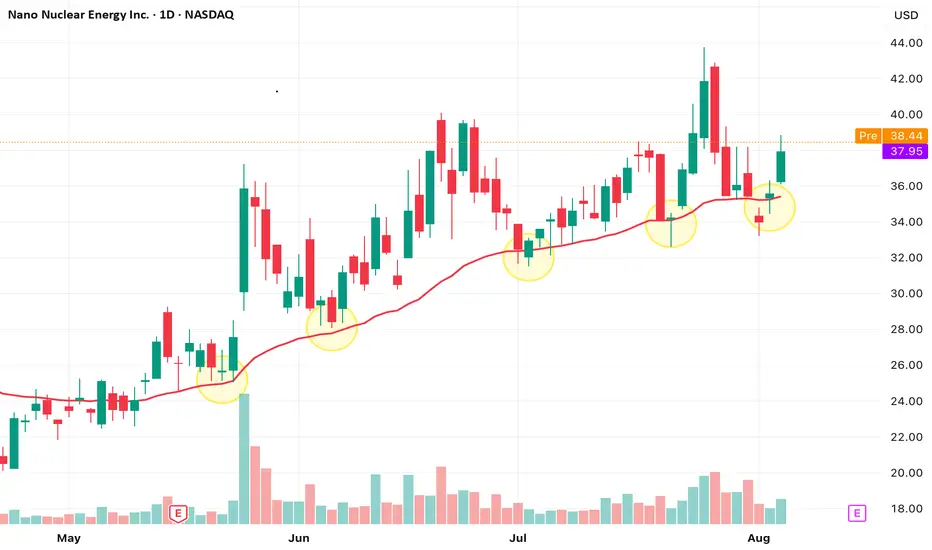
NASDAQ: NNE - Bouncing Off the Strong EMA 30?Nano Nuclear Energy - Price is retesting the EMA 30 after a sharp rally—will it hold as dynamic support and fuel the next leg up?
$AMD Swing Trade – Put Debit Spread Setup🔻 NASDAQ:AMD Swing Trade – Put Debit Spread Setup (Jul 18 Exp)
📅 Trade Opened: July 3, 2025
🛠 Strategy: Buy to Open (BTO) Put Debit Spread
📉 Strikes: $31 / $30 (Jul 18 Expiration)
💵 Cost (Premium Paid): $0.21
🎯 Trade Thesis
This setup aims to capture short-term downside in NASDAQ:AMD via a low-cost, defined-risk spread. The trade fits within my broader portfolio of OTM spreads under $0.25.
Key Drivers:
🔻 Semi sector under pressure – NASDAQ:AMD showing relative weakness.
📉 Breakdown below key support near $31 and rejection at VWAP.
🧾 Weak momentum – MACD trending down, RSI near 44.
🔄 Trade enters into earnings season volatility.
📊 Technical Setup (Daily)
EMA(4) < EMA(8) < EMA(15): Bearish structure fully intact.
VWAP: Price rejected from 30-day VWAP zone.
MACD/RSI: Momentum still fading, no signs of bullish divergence.
⏳ Strategy Notes
Max loss: $0.21
Max gain: $0.79
Risk/reward structured for a drop into or below $30
Expiration: July 18
🧠 Journal Note
Most of my trades are swing-based using OTM debit spreads with tight risk control. No same-day entries — setups must have defined technical compression and short-term catalysts.

$LYFT Swing Trade – Low-Cost Call Debit Spread Setup🚗 NASDAQ:LYFT Swing Trade – Low-Cost Call Debit Spread Setup (Jul 18 Exp)
📅 Trade Opened: July 3, 2025, 2:53 PM
🛠 Strategy: Buy to Open (BTO) Call Debit Spread
📈 Strikes: $16.5 / $17.5 (Jul 18 Expiration)
💵 Cost (Premium Paid): $0.25
🎯 Trade Thesis
This swing trade targets a short-term bullish move in NASDAQ:LYFT based on improving fundamentals and favorable technical setup. The structure uses a low-cost OTM call spread to define risk and limit exposure while capturing directional potential.
Catalysts supporting the move:
🚙 Autonomous vehicle rollout beginning this summer (Atlanta) and expanding to Dallas (2026) via Mobileye partnership.
🗳 Activist investor Engine Capital pushing for governance changes and strategic alternatives.
💵 Gross bookings at record levels, with net income and free cash flow turning positive.
📈 Analyst upgrade from TD Cowen with a $21 target (+30% upside from entry).
📊 Technical Setup (Daily Chart)
📉 EMA(4) < EMA(8) < EMA(15): Bearish alignment beginning to flatten – potential compression signal.
⚖ VWAP (30‑day): Price consolidating near long-term VWAP – watching for reclaim.
🔄 MACD: Bullish crossover emerging.
📉 RSI: ~36 – approaching oversold territory, setting up possible reversal.
⏳ Strategy Notes
Position type: OTM vertical call debit spread.
Risk defined: Max loss = $0.25 per contract.
Max gain: $0.75 if LYFT closes at or above $17.5 by expiration.
Timeframe: 2-week swing through July 18, ahead of Q2 earnings (~Aug 6).
🧠 Journal Note
This position aligns with a broader strategy focused on OTM spreads priced under $0.25, using technical compressions and fundamental tailwinds. Trade was opened not on an entry signal day - this avoids front-running momentum shifts.

I'm Buying!Price will go above 3500 just don't know how much. I want to play safe, 1st target @3500. As our 2nd target accomplishes we'll take reverse position on the possible top.

GBPUSD: Potential Reversal After Strong RallyThe British Pound has shown strong gains against the US Dollar, approaching a key resistance area. After such an extended move, a correction or reversal would be a logical expectation.
Technical Setup
There is a clear series of bearish divergences on the CCI (14) indicator. Price is forming a narrowing rising wedge, which often signals trend exhaustion.
Trade Plan
Sell limit orders: 1.3690 and 1.3850
Market entry: Only after confirmation — either a trendline break or a moving average crossover
Conclusion
GBPUSD shows signs of weakening at the top. I remain focused on short setups from resistance areas, waiting for confirmation to act.

AAVE (Aave): 100EMA Holding Price Down | Another Sell Incoming?Aave is seeing a good decline in price after each touch of the 100EMA, which we recently had again. We are going to look here for a decent movement to lower zones, which should give us at least 15% of market price movement; this, of course, only as long as we stay below the EMAs.
Swallow Academy

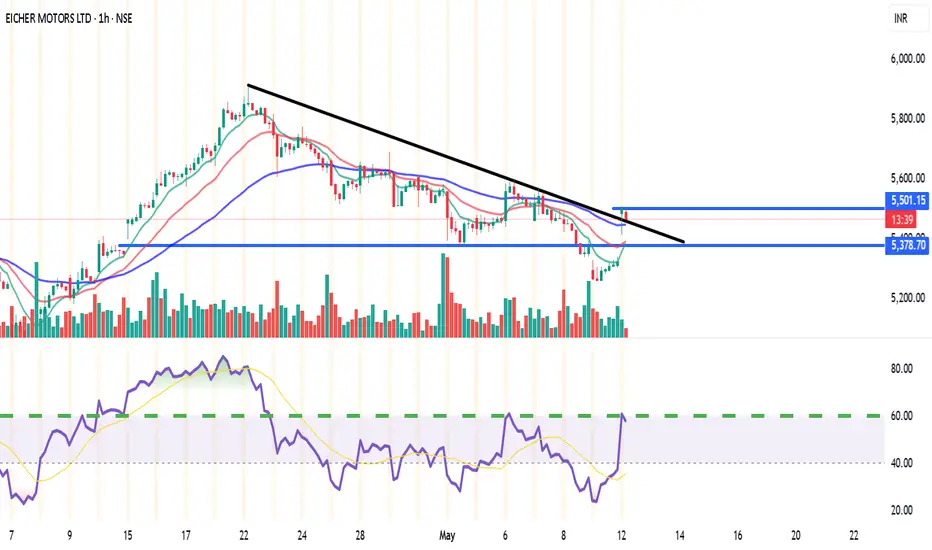
EICHERMOT (NSE) – Bullish Setup on 15min & 1H🔑 Trade Plan:
📥 Buy Above: ₹5485 (above current resistance & candle body highs)
🎯 Targets:
T1: ₹5527 (Pivot R1)
T2: ₹5555
🛡️ Stop Loss: ₹5380 (below 13 EMA & Supertrend support)
📊 Technical Signals:
RSI: 58.08 – Bullish momentum, still room to run
%B (BB): 0.77 – Close to breakout from upper band
EMA Crossover: 9 EMA > 13 EMA – Short-term bullish crossover confirmed
Supertrend: Support at ₹5322, aligning with bullish reversal
Volume: Spike during recent green candles signals strong buying interest
⚙️ Strategy Notes:
Use 15min chart for entry timing post breakout
Tighten SL to cost after T1 hits
Ideal for short-term intraday/swing traders
For Education Purposes Only
ADANI Enterprises Ltd..... Seems to hv finally broken out.ADANI Enterprises Ltd..... Seems to hv finally broken out of the 38.2 % Fib Resistance, 2 days in a row (most likely). This is the third time its trying to break out of this zone. It's crossed the 50 ema & nearing the 200.
Needs to take out 2497, the recent high on a closing basis for a smoother ride up.
Am Bullish on the stock, one more reason being its subsidiary ' KUTCH COPPER ' which is to begin production full fledged very soon. Lets See.

RSI 101: The Secret of RSI’s WMA45 Line and How to Use ItIn my trading method, I use the WMA45 line together with RSI to help spot the trend more clearly.
Today, I’ll share with you how it works and how to apply it — whether you're doing scalping or swing trading.
Why WMA45?
WMA (Weighted Moving Average) is a type of moving average where recent prices are given more importance.
WMA45 simply means it takes the average of the last 45 candles (could be 45 minutes, 45 hours, or 45 days depending on your chart).
Because it moves slower than RSI, it helps reduce the “noise” and gives you a better idea of the real trend.
This idea is not new — many traders have tested RSI strategies also use this line. I just applied and adjusted it in my own way.
👉 How to set it up on TradingView (very simple):
What WMA45 Tells You
Trending
This line shows you the overall direction of the market:
📉 If WMA45 is going down, the price is likely going down.
📈 If WMA45 is going up, the price is likely going up.
Also, the steeper the line, the stronger the trend is:
Looking at the example above, the WMA45 line starts from the same level in two different phases, but the slope is different. The steeper line shows a larger price range.
This happens because the price was more volatile, which caused the RSI to move more sharply, and that, in turn, made the WMA45 slope steeper.
In multi-timeframe analysis, when the trend on the higher timeframe is strong (shown by a steep WMA45 line), the RSI on the lower timeframe will usually move within a tighter range and react more accurately to key levels.
If you’re not sure what these key RSI levels are, check out my previous post here:
For example, in a strong downtrend on H1, RSI on M5 might not even reach 50:
✅ What does this mean for trading?
Use WMA45 on higher timeframes to define trend bias.
On lower timeframes, watch RSI responses at key zones for optimal entries.
When holding positions, WMA45 helps determine whether to stay in the trade.
Moving Sideways
Here’s something important to note: when WMA45 is flat, RSI will keep crossing back and forth over it.
Depending on where WMA45 is flat, RSI tends to move within that range and creates different sideways price patterns. Here are the main types:
Around 50 → price moves in a box: According to RSI theory, the 50 level is the balance between buyers and sellers. RSI fluctuating around this causes price to move sideways in a rectangular box range.
Above 50 → price goes up in a rising channel: Above 50 is where buyers dominate sellers. RSI operating in this zone will continually create bullish candles pushing the price upward.
Below 50 → price goes down in a falling channel: Below 50 is where sellers dominate buyers. RSI in this zone will consistently form lower highs and lower lows, pushing the price downward.
Trend Reversal of WMA45
WMA45 is calculated from the average of 45 candles, so it's almost impossible for it to reverse direction suddenly. When it's sloping (trending), it takes time for RSI to fluctuate enough to "flatten" it before it can reverse.
As shown in the example, after WMA45 slopes up, before it turns downward, RSI must cross back and forth through it to reduce the steepness => flatten it => then reverse.
Does this align with Dow Theory? It represents the phases: Trend > Sideway > Trend. Sideway is when the WMA45 line is flattened.
✅ What does this mean for trading?
After a trend forms, if you want to enter a counter-trend trade, patiently wait for WMA45 to flatten to confirm the previous trend has ended.
Dynamic Support and Resistance
In addition to being a trend indicator for RSI, WMA45 also serves as a dynamic support/resistance level for RSI.
You will often observe RSI reacting when it encounters the WMA45 line.
In an uptrend, WMA45 acts as support for RSI.
In a downtrend, WMA45 acts as resistance for RSI.
Notably, if the reactions occur at higher RSI values, the resulting price support is stronger. Conversely, if reactions happen at lower RSI values, the price is pushed down further.
In the above example, in the first reaction around RSI 60s, RSI dropped by 9.6 points and price dropped by 12 points. In the second reaction at RSI 40s, RSI dropped similarly, but the price dropped by 25 points.
✅ What does this mean for trading?
You can use WMA45 as an entry zone for your trade: Wait for reactions with WMA45 on the higher timeframe, then switch to a lower timeframe to find a trade entry.
Use WMA45 as a take-profit or stop-loss level: For a short trade near WMA45, you can stop out if RSI crosses above it.
When monitoring these reactions, pay attention to the number of reactions—more reactions require more caution in trading.
Some Trade Setups Using WMA45 and RSI
1. Intraday trading
Trend: Follow the trend on the H1 chart.
Entry zone: At WMA45 of H1.
Entry confirmation: 2 methods:
On M5: when WMA45 of RSI is already flattened, and RSI has crossed above WMA45.
On M5: when a divergence appears in RSI.
2. Scalping
With the RSI’s reaction to WMA45, even on smaller timeframes (M1, M5), you can scalp when RSI touches WMA45.
When WMA45 has a slope and RSI returns to touch it, you can enter a trade with SL behind the candle close (10–20 pips to avoid stop hunts and spread), and TP to the nearest peak.
As mentioned, the first touch gives the best reaction.
My trading system is entirely based on RSI, feel free to follow me for technical analysis and discussions using RSI.

POWERGRID – Breakout Setup with Volume Spike📍 Entry Zone: ₹310.10 – ₹311.10
🎯 Target: ₹330.00
🛑 Stoploss: ₹302.00
📈 RSI has crossed above 60, volume confirms breakout momentum (🔵 arrow), and price is supported above key EMAs.
🔍 Strong bullish structure with clear higher lows and a clean breakout candle. Momentum shift confirmed with increasing volume.
For Education Purposes Only

Nifty - moderation of +ve momentum seen on short period charts.Nifty closed with over 1% 21 VWMA was rising, Nifty respected SD+2 resistance today.
23298, 23395 resistance levels for tomorrow.
SD+1 or 23057 acted as major support today, any breach below this and sustaining lower will signal some weakness.
23730 major pivot, as long as this is help, uptrend is intact, and Nifty is in buy on dips.
24060, 23930, 23875, 23790, 23760 major support levels.

$INJ: Preparing for a Possible Impulsive Move UpCRYPTOCAP:INJ – Setting Up for a Potential Impulsive Move
After a sharp correction, CRYPTOCAP:INJ may be preparing for a strong rebound.
In a previous idea, I forecasted a bottom at $8.5 — and it dipped even lower to $7, fully retracing last year's pump.
The price broke below the bearish flag after a clear bearish divergence at the top. It also sliced through my green buy zone and is now sitting right on a critical support level at $8.40.
🚀 Signs of recovery are starting to show:
🔹 MACD is climbing and approaching the median line — a bullish crossover could ignite an impulsive rally.
🔹 Price is stabilizing above the key $8.40 support.
🔹 RSI is low and consolidating — signaling potential upside.
🔹 Volume is quiet — often a precursor to strong moves.
The target is to re-integrate the green liquidity zone, to prepare another explosive pump.
📅 Reminder: around this time last year, CRYPTOCAP:INJ pulled off a 4x rally. While past performance doesn't guarantee future results, the setup looks promising.
🧠 DYOR | This is not financial advice.
#INJ #CryptoAnalysis #Altcoins #TechnicalAnalysis #MACD #CryptoMarket #BreakoutSetup #DYOR
