Ending Diagonal

Ending DiagonalIt is completing (e) of ending digonal. This wave may complete about 1815 eventually.
Also 1807-1815 is a former support zone between mid of May to end of June. It is broken on July 1st and resisted during pulback. It is the second time that price is trying to break it up.
I will expect to break T2 down; may be between 1890 to 1886 and short it for $25 - $40 for midterm.

2X UCAD SIGNAL +150 PIPS!USDCAD has broken the ending diagonal and seems to be head to resistance marked in purple above! This signal ran for 150 Pips thanks to NFP! it ranged for a while but the ending diagonal was a key confirmation of a reversal!

BCHUSD Breaking Trendline For A Bullish CaseBCH moved even higher following the break out of a diagonal in the last few days. Notice that recovery is now in five waves on the hourly chart so it appears that more gains can follow after the retracement. There is nice technical support at 113 followed by 108/110 area, where the price can meet the trendline.

PolkaDot DOT - On a massive weekly support! 0.618 FIB + Channel
PolkaDot was a very strong altcoin in 2020-2021 as you can see on the historical chart and we can cleary spot an impulse wave here.
The coin in 2022 fell to the strongest support (0.618 FIB + Wave 1 horizontal support + POC + ABC correction).
If you like fundamentals of this coin, this is definitely a good time to buy, because we have a strong confluence.
The missing part is the descending parallel channel, because the price is still inside the channel, but we have had a nice touch on the bottom.
After an impulse wave - ABC correction is expected and in this case, the ABC correction has been sucessfullly completed with an ending diagonal pattern.
If want to make a short term trade, you can place your profit target at the top of the channel, otherwise next stop is below previous all time high.
Look at my ideas about interesting altcoins in the related section down below ↓
For more ideas please hit "Like" and "Follow"!

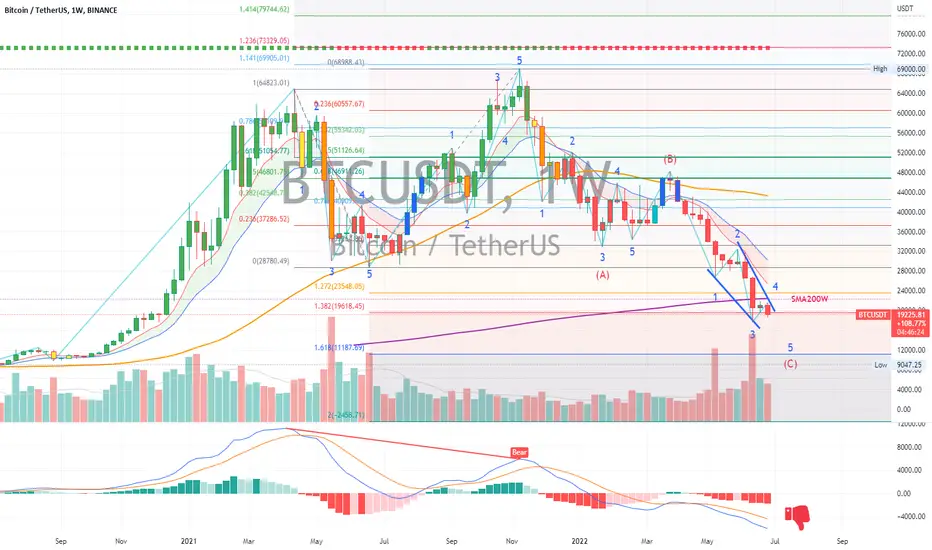
BTCUSDT | Wave Analysis | The Beginning of Ending Diagonal?Price action and chart pattern
> Possible beginning of ending diagonal wave, possible a bit further downtrend for reversal pattern below SMA200W
> Indicator MACD downtrend ribbon still wide-opened, do not expect the major trend reversal so soon.
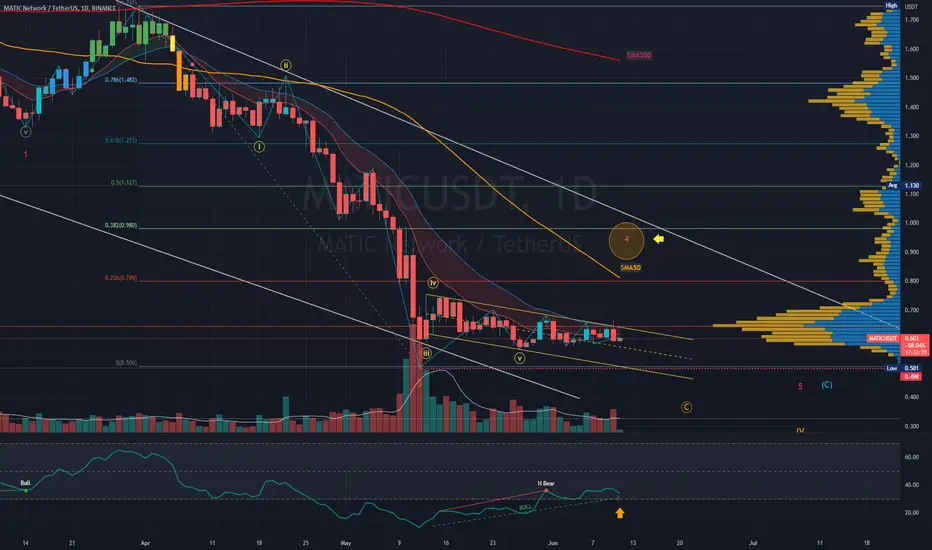
MATICUSDT | Wave Projection| Bullish Divergence for rebound?Price action and chart pattern trading setup
> Major formation: Ending diagonal with bullish flag reversal pattern, expecting a rebound for minor WAVE 4
> Targeting 0.382 retracement of previous WAVE 3
> Entry @ bullish flag breakout
> Stoploss @ flag support position
> RRR 3:1
Indicator:
RSI bullish divergence
Always trade with affordable risk and respect your stoploss
MLong
CONN wave major wave 2I believe Conn is setting up for a major move up. Wave 2 of a much larger wave is about complete with an ending diagonal wave C. Wait for the break of the red horizontal line to confirm larger wave 3 is on the way. Trade at your own risk. Good luck!
CLong

SUSHIUSD| TFW Analysis Ending Diagonal - Bullish DivergencePrice action and chart pattern weekly wave analysis
> TFW continues in an ending diagonal of a potential final ABC correction wave 5 downtrend stage.
> Medium term trading - Entry @ downtrend Elliott Channel breakout
> 1st Target @ SMA200 TFD / just above wave 4 zone @ 0.382
> Stoploss @ Wave 5 zone with 20-30% downside risk - RRR: 4:1
Indicator:
1. Smart money volume 2.6X
2. Banker chip entry signal at downtrend Wave 3 and 5.
3. BBD triple bullish divergence crossover baseline and above
4. Stochastic bullish divergence signal 1st uptrend ribbon in oversold zone
Always trade with affordable risk and respect your stoploss

XAUUSD - Elliott wave update - ending diagonal micro ((C))
XAUUSD - Elliott wave update - ending diagonal bicro ((C))
ending diagonal micro ((C)) is running in submicro wave (3) zigzag
confermation 1846
invalidation 1864

XAUUSD - Elliott wave update - corrective flat submicro abc
XAUUSD - Elliott wave update - corrective flat submicro abc
microwave (c) is running impulsive 5 waves
invalidation 1878

USDRUB EXPANDING ENDING DIAGONALUSDRUB Complete the Monthly Wave 5 with Expanding Ending Diagonal.
Now we have correction ABC or Downtrend with 5 Waves

When will S&P500 finish its first correction wave ?!?Hello traders!
I think we are all looking at the indices charts that keeps falling with the effect of the crisis and economy management from the Fed and central banks.
**According to Truflation, the inflation rate is at 11.4% in the USA**
This economic crash is not yet to stop, we will be experiencing crazy time in the incoming month and years...!
BUT ANYWAY , today we are analyzing the S&P500 with the Elliott Waves from the crash of the Covid-19, and what we can see is that:
The 5 of the Impulse Extended Ending Diagonal Wave has been confirmed the 22 Nov '21
- An EED have 5 waves that are subdivided into correction waves 3-3-3-3-3.
- In an expanding diagonal ending, wave 1 is small, wave 3 is medium and Wave 5 is long.
Since then, we are in an ABC pattern that we are about to finish in the incoming week
For me, it is the first Wave of the correction pattern that we are about to be witness in the incoming month and until next year.
Because the worldwide economy is not looking good, in my opinion I would say that we are finishing Wave W of a WXYXZ.
ZOOM IN for a better view of the objectives that have been found for the end of the downtrend (light blue C of the ABC) :
1/// 4000 is strong by being the 100% of the ABC pattern
2/// 3900 is strong by being the 113% of the ABC pattern
3/// 3850/3825 is the strongest by being the 123%/127,2% of the ABC pattern and near the 38.2% of the entire Impulse Wave Retracement
ZOOM OUT for a better view of the overall structure of the S&P500
You can also check my analysis on the NAS100 where the structure is pretty much the same.
.
.
Please feel free to ask question and recommendations in the comment section, I would be more than happy to answer your questions

Possible recovery in BTCUSD As per Fundamentals and Technicals, we can experience some bullish movement in the Market price Short-term.

DIANA Shipping - Ending Diagonal Diana Shipping has an Ending Diagonal.
The ending diagonal is wave 5.
The pattern is active, this is mean that we have change in polarity
and the target is at least 38.2% Fibonacci.

Another sell opportunity on btcHi
We are In ending diagonal, yet.
Modification of previous idea, is here.
Have good trade

Time to move big either way.It seems that the price of Bitcoin is now breaking out above the upper trend line of falling wedge pattern, which forms an ending diagonal.
Time to move big either way.

American Outdoor - Ending Diagonal -American Outdoor has an Ending Diagonal.
The pattern will active if price breakout the (4) of Ending Diagonal.

A great sell opportunity in btcHi
According to previous idea, I said that we are in ending diagonal. Now this idea is confirmed and a big sell opportunity is ready to eat.
Have good trade
Yours

Fall in btc to 33kHi
My previous Elliot analysis is expired. In this situation, we are in wave fifth with ABC structure. We have ending diagonal. The Chanel of this structure is so clear.
You can sell btc at 39000-39400 with tp around 33000-33400.
Have good trade
Yours

Bit start to be over 50kHi
In this situation, correction wave 4 of c wave (ending diagonal with ABC structure) was finished, and the wave 5 is started to first 45-46k and after correction, go to 52 k.
Have good trade

Dax in 3-4 monthsHi
Dax in ending diagonal wave that can be predicted by Elliot wave. The 3 target calculated carefully.
Have good trade
Bye

Dax elliott analysisHi
We are in ending diagonal in wave 5. Dax could be reach 17000.
Have good trade
Bye
