13, here we comeLooks bullish and can hit 13. It may have massive pullbacks before it hits 13. Play safe and diversify.
Not a financial advise.
Energy Commodities

Plug - Hear me outProposing a trade on a shit-co like plug may earn some laughs but hear me out for a second.
In the right light and with enough alcohol, she could pass for a strong six. I'd do her.
Jokes, aside, due to the frantic rush to solve AI datacenter energy problem, power companies have been getting a lot of play lately, some have real growth potential, while others may be the speculative dream of degenerates like myself.
A 25 year old company, about to hit the figurative wall (DiCapiro joke...slaps knee), has suddenly seen an influx of buying activity and what looks to be increasing volume following a look below and fail of a weekly box.
According to box rules, I can't ignore this trade. Plug has been in an area of consolidation for years. It's completed atleast two look above and look below and fails of the larger boxed range.
I'm not saying that this stock is going to the moon, but if It can reclaim the top of the mini weekly box and hold the midpoint of the larger box then $8 seems like a realistic target to me.
Now, this stock would easily revert back to the volume point of control (VPOC) around $2 or lbaf again or simply fail miserably below the boxes...then all you degens will be living in boxes.
If we do see 2.50 - $2 again, I'd love to take an entry there (a lbaf of vpoc would be nice too). Otherwise, I'll be monitor this name for the mentioned trades.
My posts are for shits and giggles. I'm just a guy with an interest and a celcius addiction.
~The Villain

Natural Gas Pummeled on Inventories Natural gas saw continued heavy selling today off the inventory report.
Inventories came in at 80B which is 4Billion higher than the estimate.
This is showing a little bit less of demand pull.
The Weekly 200 MA was the technical rejection zone for Nat Gas.
We will be live trading Nat Gas tomorrow if we see another sell day in the commodity.
I'm watching for a liquidity sweep of the daily 200 MA.
Nat Gas Bulls need to defend the 20 MA at minimum.

CLSK Breaking out!CLSK continues with momentum closing above the macro triangle upper boundary trend-line and now testing the last resistance before a breakout! This will coincide with a break above wave D and flip the macro structure bullish bringing in more capital!
Daily RSI is overbought with slight bearish divergence but can remain this way for weeks in a strong uptrend!

USOIL – Buy SetupTimeframe: H1
Current price: 62.40 USD/barrel
Trade idea:
Buy USOIL 62.30–62.40
🎯 Target: 63.90
🛑 Stop loss: 61.74
📈 R:R ≈ 1:3
Technical basis:
Price retested the breakout trendline and held above SMA89 (bullish confirmation).
Strong rebound from Fib 0.236 zone (62.28).
Momentum building toward 63.9 resistance area.
Comment:
Short-term rebound expected after correction. Maintain buy bias while price >61.8.

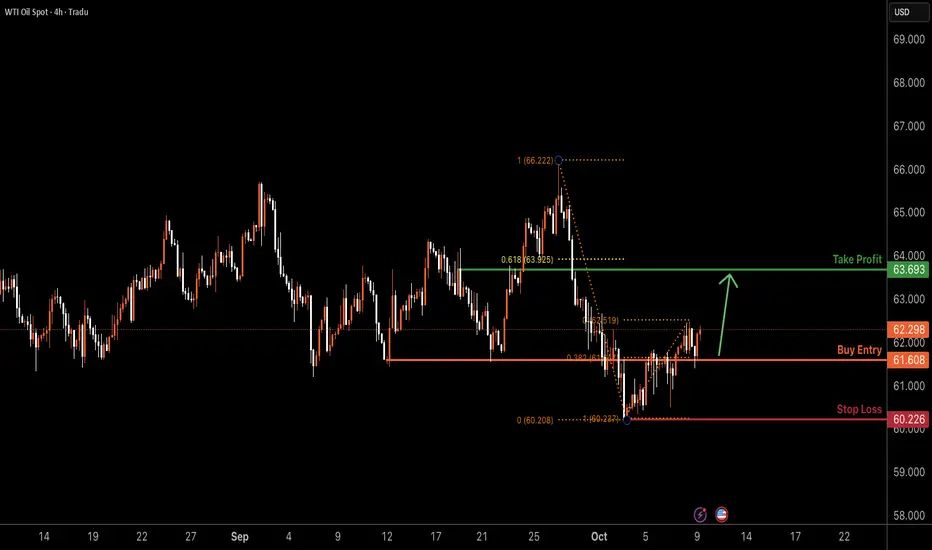
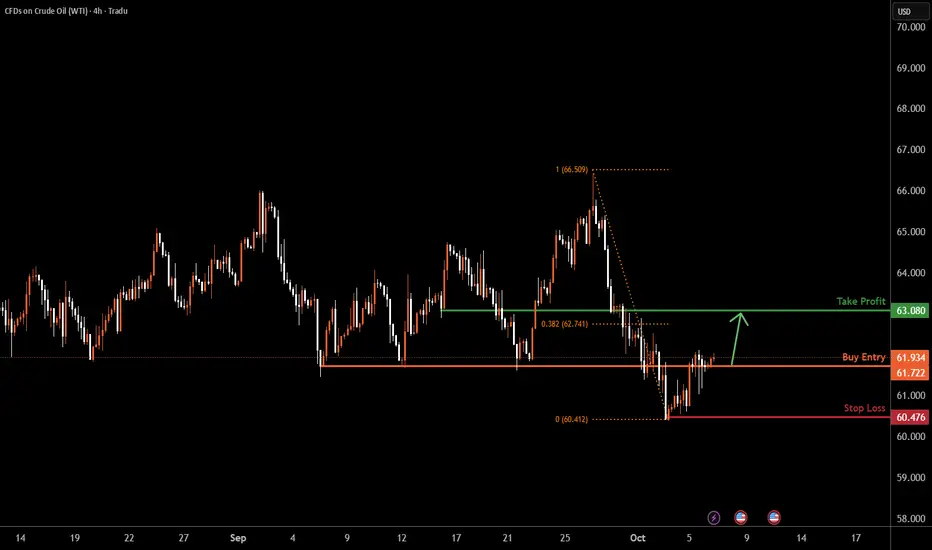
USOIL H4 | Bullish Reversal at Key SupportBased on the H4 chart analysis, we can see that the price has bounced off the buy entry, which is an overlap support that aligns with the 38.2% Fibonacci retracement and could rise from this level to the upside.
Buy entry is at 61.60, which is an overlap support that aligns with the 38.2% Fibonacci retracement.
Stop loss is at 60.22, whic is a swing low support.
Take profit is at 63.69, which is a pullback resistance that is slightly below the 61.8% Fibonacci retracement.
High Risk Investment Warning
Trading Forex/CFDs on margin carries a high level of risk and may not be suitable for all investors. Leverage can work against you.
Stratos Markets Limited (tradu.com ):
CFDs are complex instruments and come with a high risk of losing money rapidly due to leverage. 65% of retail investor accounts lose money when trading CFDs with this provider. You should consider whether you understand how CFDs work and whether you can afford to take the high risk of losing your money.
Stratos Europe Ltd (tradu.com ):
CFDs are complex instruments and come with a high risk of losing money rapidly due to leverage. 66% of retail investor accounts lose money when trading CFDs with this provider. You should consider whether you understand how CFDs work and whether you can afford to take the high risk of losing your money.
Stratos Global LLC (tradu.com ):
Losses can exceed deposits.
Please be advised that the information presented on TradingView is provided to Tradu (‘Company’, ‘we’) by a third-party provider (‘TFA Global Pte Ltd’). Please be reminded that you are solely responsible for the trading decisions on your account. There is a very high degree of risk involved in trading. Any information and/or content is intended entirely for research, educational and informational purposes only and does not constitute investment or consultation advice or investment strategy. The information is not tailored to the investment needs of any specific person and therefore does not involve a consideration of any of the investment objectives, financial situation or needs of any viewer that may receive it. Kindly also note that past performance is not a reliable indicator of future results. Actual results may differ materially from those anticipated in forward-looking or past performance statements. We assume no liability as to the accuracy or completeness of any of the information and/or content provided herein and the Company cannot be held responsible for any omission, mistake nor for any loss or damage including without limitation to any loss of profit which may arise from reliance on any information supplied by TFA Global Pte Ltd.
The speaker(s) is neither an employee, agent nor representative of Tradu and is therefore acting independently. The opinions given are their own, constitute general market commentary, and do not constitute the opinion or advice of Tradu or any form of personal or investment advice. Tradu neither endorses nor guarantees offerings of third-party speakers, nor is Tradu responsible for the content, veracity or opinions of third-party speakers, presenters or participants.
Very rare diamond patternThis very rare pattern usually indicates a change of trend. Is doing it in the weekly timeframe and setting up for a massive breakout of the descending channel. Also, oil is setting up an inverse HS and many of the big oil companies show bullish patterns. SL and TP are shown on the charts.
Good luck.

70 SOON?It might have topped for now with a double top. Looks bearish and it may hit 70 in couple of months. Short term analysis only.
Not a financial advice.

MCX Crude Oil Options (16th Oct Expiry)MCX Crude Oil Options (16th Oct Expiry)
Buy 5400 Call option only if price breaks above 188.60
Target: 208.60
Trade must activate tomorrow (6th Oct 2025), else the view is canceled.
Once activated, target remains valid till 15th Oct session.
📌 Disclaimer: This is a directional view, not a recommendation. Do your own analysis before taking any position.
#crudeoil
USOIL SENDS CLEAR BEARISH SIGNALS|SHORT
USOIL SIGNAL
Trade Direction: short
Entry Level: 62.52
Target Level: 60.15
Stop Loss: 64.10
RISK PROFILE
Risk level: medium
Suggested risk: 1%
Timeframe: 7h
Disclosure: I am part of Trade Nation's Influencer program and receive a monthly fee for using their TradingView charts in my analysis.
✅LIKE AND COMMENT MY IDEAS✅

UKOIL H1 | Bullish Momentum BuildingBased on the H1 chart analysis, we could see the price reacting off the buy entry, which is a pullback support, and a bounce from this level could lead the price to rise to the upside.
Buy entry is at 65.77, which is a pullback support.
Stop loss is at 64.97, which is an overlap support.
Take profit is at 67.13, which is a pullback resistance that is slightly below the 50% Fibonacci retracement.
High Risk Investment Warning
Trading Forex/CFDs on margin carries a high level of risk and may not be suitable for all investors. Leverage can work against you.
Stratos Markets Limited (tradu.com ):
CFDs are complex instruments and come with a high risk of losing money rapidly due to leverage. 65% of retail investor accounts lose money when trading CFDs with this provider. You should consider whether you understand how CFDs work and whether you can afford to take the high risk of losing your money.
Stratos Europe Ltd (tradu.com ):
CFDs are complex instruments and come with a high risk of losing money rapidly due to leverage. 66% of retail investor accounts lose money when trading CFDs with this provider. You should consider whether you understand how CFDs work and whether you can afford to take the high risk of losing your money.
Stratos Global LLC (tradu.com ):
Losses can exceed deposits.
Please be advised that the information presented on TradingView is provided to Tradu (‘Company’, ‘we’) by a third-party provider (‘TFA Global Pte Ltd’). Please be reminded that you are solely responsible for the trading decisions on your account. There is a very high degree of risk involved in trading. Any information and/or content is intended entirely for research, educational and informational purposes only and does not constitute investment or consultation advice or investment strategy. The information is not tailored to the investment needs of any specific person and therefore does not involve a consideration of any of the investment objectives, financial situation or needs of any viewer that may receive it. Kindly also note that past performance is not a reliable indicator of future results. Actual results may differ materially from those anticipated in forward-looking or past performance statements. We assume no liability as to the accuracy or completeness of any of the information and/or content provided herein and the Company cannot be held responsible for any omission, mistake nor for any loss or damage including without limitation to any loss of profit which may arise from reliance on any information supplied by TFA Global Pte Ltd.
The speaker(s) is neither an employee, agent nor representative of Tradu and is therefore acting independently. The opinions given are their own, constitute general market commentary, and do not constitute the opinion or advice of Tradu or any form of personal or investment advice. Tradu neither endorses nor guarantees offerings of third-party speakers, nor is Tradu responsible for the content, veracity or opinions of third-party speakers, presenters or participants.

Market Analysis: WTI Crude Oil StrugglesMarket Analysis: WTI Crude Oil Struggles
Crude oil is recovering and might rise toward the $63.20 resistance zone.
Important Takeaways for WTI Crude Oil Price Analysis Today
- WTI Crude oil is recovering losses and trading above $61.20.
- There is a short-term rising channel in place with support at $61.20 on the hourly chart of XTI/USD.
WTI Crude Oil Price Technical Analysis
On the hourly chart of WTI Crude Oil, the price found support near $60.25 against the US Dollar. The price formed a base and started a recovery wave above $60.80 and the 50-hour simple moving average.
The bulls were able to push the price above the 23.6% Fib retracement level of the downward move from the $66.16 swing high to the $60.26 swing low. The hourly RSI is above the 60 level, but the price is struggling near $62.00.
The next hurdle could be $63.20 and the 50% Fib retracement. A clear move above $63.20 could send the price toward $63.90. Any more gains might open the doors for a test of $64.75.
Conversely, the price might start a fresh decline from $62.00. Immediate support sits near $61.20 and the 50-hour simple moving average. There is also a short-term rising channel in place at $61.20. The key breakdown zone on the WTI crude oil chart might be $60.25.
If there is a downside break, the price might decline toward $58.40. Any more losses might encourage the bears for a push toward $55.00.
This article represents the opinion of the Companies operating under the FXOpen brand only. It is not to be construed as an offer, solicitation, or recommendation with respect to products and services provided by the Companies operating under the FXOpen brand, nor is it to be considered financial advice.

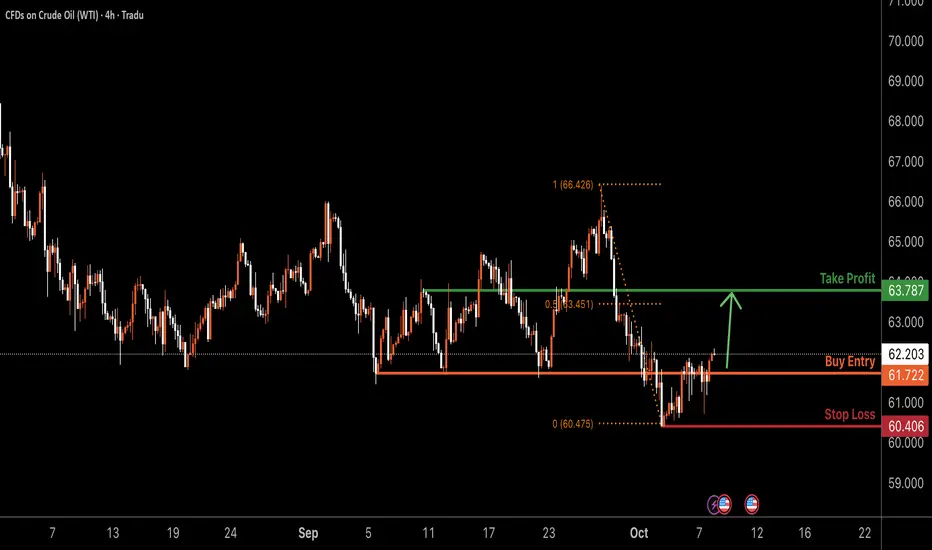
USOIL H4 | Bullish Reversal Forming at Key Support LevelUSOIL is reacting off the buy entry, which is an overlap support and could potentially rise from this level to the take profit.
Buy entry is at 61.72, which his an overlap support.
Stop loss is at 60.40, which is a pullback support.
Take profit is at 63.78, which is a pullback resistance that is slightly above the 50% Fibonacci retracement.
High Risk Investment Warning
Trading Forex/CFDs on margin carries a high level of risk and may not be suitable for all investors. Leverage can work against you.
Stratos Markets Limited (tradu.com ):
CFDs are complex instruments and come with a high risk of losing money rapidly due to leverage. 65% of retail investor accounts lose money when trading CFDs with this provider. You should consider whether you understand how CFDs work and whether you can afford to take the high risk of losing your money.
Stratos Europe Ltd (tradu.com ):
CFDs are complex instruments and come with a high risk of losing money rapidly due to leverage. 66% of retail investor accounts lose money when trading CFDs with this provider. You should consider whether you understand how CFDs work and whether you can afford to take the high risk of losing your money.
Stratos Global LLC (tradu.com ):
Losses can exceed deposits.
Please be advised that the information presented on TradingView is provided to Tradu (‘Company’, ‘we’) by a third-party provider (‘TFA Global Pte Ltd’). Please be reminded that you are solely responsible for the trading decisions on your account. There is a very high degree of risk involved in trading. Any information and/or content is intended entirely for research, educational and informational purposes only and does not constitute investment or consultation advice or investment strategy. The information is not tailored to the investment needs of any specific person and therefore does not involve a consideration of any of the investment objectives, financial situation or needs of any viewer that may receive it. Kindly also note that past performance is not a reliable indicator of future results. Actual results may differ materially from those anticipated in forward-looking or past performance statements. We assume no liability as to the accuracy or completeness of any of the information and/or content provided herein and the Company cannot be held responsible for any omission, mistake nor for any loss or damage including without limitation to any loss of profit which may arise from reliance on any information supplied by TFA Global Pte Ltd.
The speaker(s) is neither an employee, agent nor representative of Tradu and is therefore acting independently. The opinions given are their own, constitute general market commentary, and do not constitute the opinion or advice of Tradu or any form of personal or investment advice. Tradu neither endorses nor guarantees offerings of third-party speakers, nor is Tradu responsible for the content, veracity or opinions of third-party speakers, presenters or participants.
Natural Gas - Epic Trade SetupNatural Gas is potentially setting up a blow off top move into its Thursday inventory report.
This chart pattern rally is looking very similar to what we saw last Thursday when Nat gas had a 6.6% range decline from the high pivot it made off of inventories.
If we get a blow off top move on Thursday through the 200 Week MA I will look to fade that move.
This will be a live trading scalp idea...not financial advice.
Right now the swing trading trend is still bullish and looking strong.
Dip buyers are still in a favorable position for this commodity.

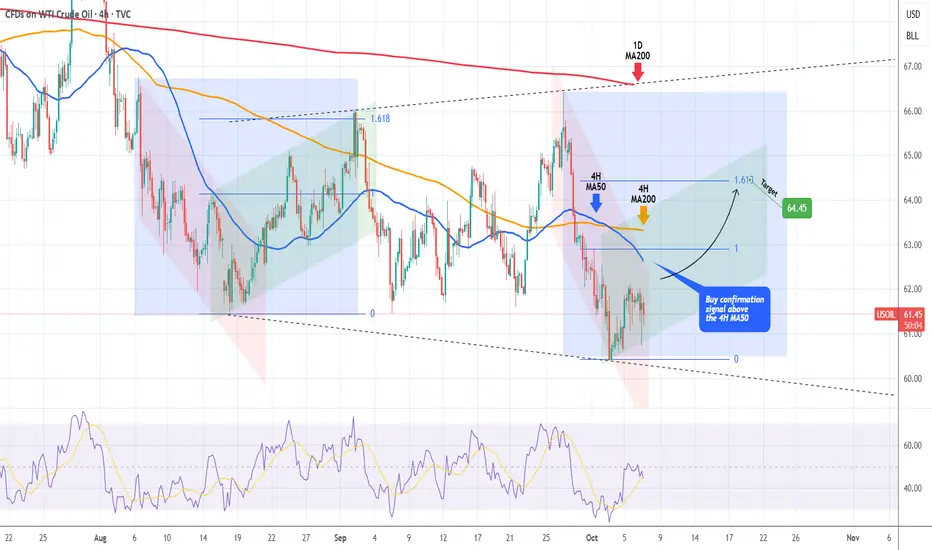
WTI OIL Megaphone bottomed but 4H MA50 gives the signal.WTI Oil (USOIL) has been trading within a Megaphone pattern since the August 18 Low and last Thursday made its latest Lower Low. The 4H RSI instantly rebounded along with the price, after turning oversold (<30.00).
This is technically the start of the pattern's new Bullish Leg. The last one confirmed its start after the price broke above the 4H MA50 (blue trend-line). If it does again, we will take it as a buy signal, targeting the 1.618 Fibonacci at $64.45.
-------------------------------------------------------------------------------
** Please LIKE 👍, FOLLOW ✅, SHARE 🙌 and COMMENT ✍ if you enjoy this idea! Also share your ideas and charts in the comments section below! This is best way to keep it relevant, support us, keep the content here free and allow the idea to reach as many people as possible. **
-------------------------------------------------------------------------------
💸💸💸💸💸💸
👇 👇 👇 👇 👇 👇
Gas prices surge on cold forecastsGas prices surge on cold forecasts
On Oct 7 european natural gas jumped to a six-week high, extending a sharp rally as colder weather forecasts and weaker renewable output boosted heating demand expectations. Temperatures in France and Germany are set to fall about 2°C below seasonal norms from mid-October.
The market also reacted to Russia’s largest missile strikes on Ukraine’s gas infrastructure since the war began, heightening concerns over potential supply disruptions. Despite the risks, EU storage remains robust at 82.8% of capacity, with Italy at 93%, France at 92%, and Germany at 76.3%.
In the UK, gas futures climbed also as the Met Office warned of a sharp temperature drop ahead, likely lifting heating demand. Analysts noted that if damage to Ukrainian facilities proves significant, Europe may need to increase pipeline and LNG imports to stabilize supply.
USOIL H4 | Bullish ReversalUSOIL is reacting off the buy entry, whichis a pullback support and could rise from this level to the take profit.
Buy entry is at 61.98, whichis a pullback support.
Stop loss is at 60.47, which swing low support.
Take profit is at 63.08, which is a pullback resistance that is slightly above the 38.2% Fibonacci retracement.
High Risk Investment Warning
Trading Forex/CFDs on margin carries a high level of risk and may not be suitable for all investors. Leverage can work against you.
Stratos Markets Limited (tradu.com ):
CFDs are complex instruments and come with a high risk of losing money rapidly due to leverage. 65% of retail investor accounts lose money when trading CFDs with this provider. You should consider whether you understand how CFDs work and whether you can afford to take the high risk of losing your money.
Stratos Europe Ltd (tradu.com ):
CFDs are complex instruments and come with a high risk of losing money rapidly due to leverage. 66% of retail investor accounts lose money when trading CFDs with this provider. You should consider whether you understand how CFDs work and whether you can afford to take the high risk of losing your money.
Stratos Global LLC (tradu.com ):
Losses can exceed deposits.
Please be advised that the information presented on TradingView is provided to Tradu (‘Company’, ‘we’) by a third-party provider (‘TFA Global Pte Ltd’). Please be reminded that you are solely responsible for the trading decisions on your account. There is a very high degree of risk involved in trading. Any information and/or content is intended entirely for research, educational and informational purposes only and does not constitute investment or consultation advice or investment strategy. The information is not tailored to the investment needs of any specific person and therefore does not involve a consideration of any of the investment objectives, financial situation or needs of any viewer that may receive it. Kindly also note that past performance is not a reliable indicator of future results. Actual results may differ materially from those anticipated in forward-looking or past performance statements. We assume no liability as to the accuracy or completeness of any of the information and/or content provided herein and the Company cannot be held responsible for any omission, mistake nor for any loss or damage including without limitation to any loss of profit which may arise from reliance on any information supplied by TFA Global Pte Ltd.
The speaker(s) is neither an employee, agent nor representative of Tradu and is therefore acting independently. The opinions given are their own, constitute general market commentary, and do not constitute the opinion or advice of Tradu or any form of personal or investment advice. Tradu neither endorses nor guarantees offerings of third-party speakers, nor is Tradu responsible for the content, veracity or opinions of third-party speakers, presenters or participants.
Macro Recap & Crude Oil Trade SetupNYMEX:CL1! NYMEX:MCL1!
Markets Overview
Markets have largely shrugged off the U.S. government shutdown, with major indices pressing to fresh all-time highs. While the headline optimism continues, it’s important to note that over one million federal employees remain furloughed, leading to delays in key economic data releases and potential short-term distortions in macro readings.
Despite the Atlanta Fed GDPNow model projecting stronger growth, underlying household dynamics suggest stress ahead. Lower-income consumers, already contending with tighter credit and depleted savings, are likely to see further deterioration in spending and sentiment, which may weigh on Q4 consumption trends.
Market Positioning & Flows
While equities appear to be in a new leg of the bull market, positioning data suggests this may not be entirely organic. According to publicly available data many hedge funds continue to under-perform the S&P 500, forcing catch-up buying after missing the April lows. This dynamic may also be contributing to the current momentum-driven equity strength, even as macro headwinds persist.
Metals Performance
Precious metals have been standout performers year-to-date, reflecting declining real yields and persistent inflation hedging flows:
• Gold: +42.46% YTD
• Silver: +56.88% YTD
• Platinum: +71.29% YTD
(Source: Finviz YTD Futures Performance)
This rally underscores a broader rotation toward real assets, consistent with expectations of lower real interest rates and a weaker U.S. dollar trajectory.
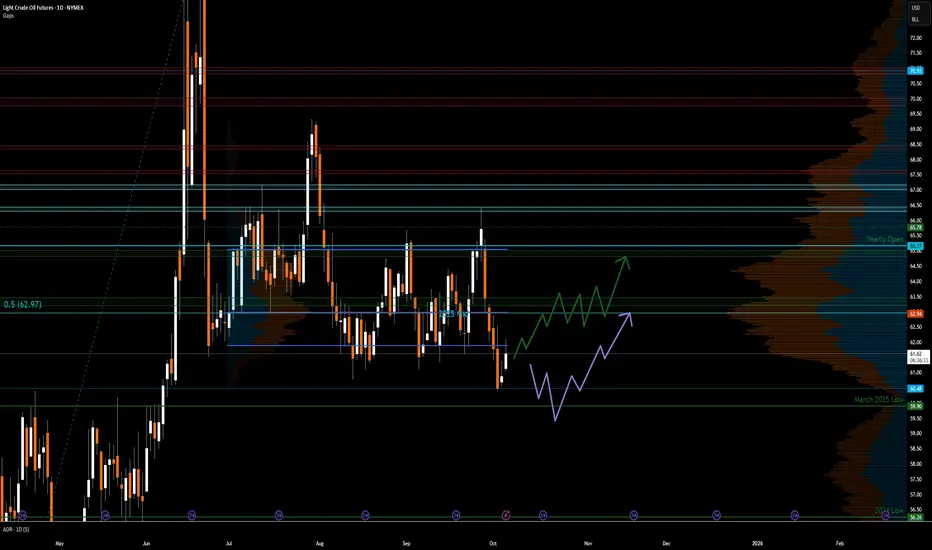
Crude Oil Technical & Trade Setup
Crude oil prices reached $66.42 in September before retracing lower. The recent OPEC+ announcement of additional voluntary cut unwinding at a pace of 137 kbpd for November adds a modest supply-side loosening.
From a technical perspective, price action has bounced at the yearly Volume Profile’s Value Area Low (VAL), a key area of structural support.
Current positioning shows:
• Price trading below Q2 VAL
• Price trading above yearly VAL (yVAL)
Scenario 1: Long on Reclaim of Q2 VAL
• Setup: Watch for crude to confirm acceptance back above the Q2 VAL as a support level.
• Trigger: Long entry on confirmation of acceptance above VAL.
• Target:
o First target: 2025 mid-range at $62.97
o Secondary target: Yearly open at $65.17
Scenario 2 : Long on Deeper Retest
• Setup: Should price reject Q2 VAL, patience is warranted.
• Entry Zone: Wait for price to move lower toward yVAL and March 2025 low confluence.
• Target: Return move toward 2025 mid-range ($62.97).
Despite near-term noise from policy uncertainty and supply adjustments, the broader technical structure favors accumulation on weakness rather than chasing momentum.
Crude remains range-bound but biased for upside stabilization into Q4, supported by resilient demand and disciplined OPEC+ management.
Natural Gas Market Outlook ‖ Bullish Breakout with Risk Control💎 XNG/USD Natural Gas – Thief Trader’s Money Loot Plan (Swing/Scalping) 💎
🎯 Trade Plan (Bullish Setup)
Strategy: Bullish triangular moving average breakout, aligned with Fibonacci 0.382 level.
Entry (Layered Style): Using multiple limit orders (Thief layering strategy). Example entries:
$2.900
$2.950
$3.000
(You may add more layers depending on your risk appetite.)
Stop Loss: $2.800 (Thief SL).
⚠️ Note: Adjust SL based on your own risk tolerance and strategy.
Target Zone: Major seller pressure expected near $3.400 — our escape target set at $3.200.
📌 Reminder: Take profit at your own discretion — you control your loot, not me.
❓ Why This Setup?
✅ Technical Basis: Bullish triangle breakout + Fibonacci 0.382 retracement signals continuation upside.
✅ Layered Entry Advantage: Reduces risk by scaling in across levels, catching volatility without FOMO.
✅ Market Structure: Current consolidation near $2.93 provides a solid base for accumulation.
✅ Sentiment Balance: Both retail & institutional lean bullish, supporting potential breakout momentum.
✅ Macro Tailwinds: Strong LNG export growth and expected winter heating demand underpin the long thesis.
This plan aligns both short-term technicals and long-term fundamentals, creating a high-probability swing/scalping opportunity.
🌟 Natural Gas (XNG/USD) Market Report - September 3, 2025 🌟
📊 Current Price Snapshot
Spot Price: $2.93 per MMBtu (Henry Hub benchmark) 📉
(Holding steady after recent dips, reflecting balanced supply/demand.)
😊 Trader Sentiment Outlook
Retail Traders: 55% Bullish 🟢 | 35% Bearish 🔴 | 10% Neutral ⚪
(Optimism from LNG demand + weather, but some concern on inventories.)
Institutional Traders: 60% Bullish 🟢 | 30% Bearish 🔴 | 10% Neutral ⚪
(Focused on exports & production stability, while cautious on oversupply.)
📌 Overall Mood: Mildly positive — upside potential if weather demand rises.
😨 Fear & Greed Index
Current Level: Neutral (Score ~50/100) ⚖️
Fear factors: Storage 5% above 5-year avg, mild summer demand.
Greed drivers: LNG exports + winter demand expectations.
Market vibe = balanced — neither panic selling nor euphoric buying.
📈 Fundamental & Macro Score
Fundamental Score: 7/10 🟢
Strong LNG shipments (31% growth expected).
Inventories manageable, production +3% YoY.
Key watch: Permian & Haynesville supply shifts.
Macro Score: 8/10 🟢
Rising global energy needs (AI, data centers).
Autumn cooling trend boosts heating demand.
Asia’s growth keeps exports flowing.
🚀 Overall Market Outlook
Bias: Bullish (Long) 🟢📈 — ~60% confidence.
Natural gas could push toward $3.60/MMBtu by late 2025 if balances tighten and exports expand.
Winter could spark extra upside rallies ❄️🔥.
🔗 Related Pairs to Watch
FXOPEN:XNGUSD
NYMEX:NG1!
ICMARKETS:XBRUSD (Brent Crude)
FOREXCOM:USOIL (WTI Crude Oil)
OANDA:XAUUSD (Gold for risk hedge)
TVC:DXY (US Dollar Index – inverse correlation play)
✨ “If you find value in my analysis, a 👍 and 🚀 boost is much appreciated — it helps me share more setups with the community!”
#XNGUSD #NaturalGas #SwingTrading #Scalping #CommodityTrading #EnergyMarkets #Fibonacci #BreakoutStrategy #LayeringStrategy #TradingViewAnalysis #ThiefTrader
IREN Wont Quit! Fib extension Analogue targets..NASDAQ:IREN Has ran all the weekly pivot in an astonishing wave III. RSI is extremely overbought.
The next Fibonacci extension targets (analogue scale) are the 3.618 at $59 and the 4.236 at $68 for a wave 3 termination.
Fibonacci log targets are as high as $400 but this seems unrealistic so switched to analogue in this case! Stranger things have happened still...
Safe trading

BTDR Closed above the weekly pivot!NASDAQ:BTDR Wave (3) is underway and price has overcome the weekly pivot for now and bulls want to see this hold! The trend is up, the supports have been tested and the all time High Volume Node is the next target $25.
Fibonacci extension targets are minimum if $38 at the 1.618 with possibility to overextended bringing up the next target of the R5 weekly pivot at $76
RSI is not overbought and has plenty of room to grow, reaching the next leg often kicks in serious momentum!
Safe trading

RIOT Macro, Higher for Longer!RIOT’s weekly RSI is overbought but can stay like this for many months as price continues upwards, just look at IREN!
Elliot wave (II) completed at the golden pocket. Price is finding minor consolidation at the wave (I) High Volume Node but is expected to break through with current price action and accelerate to $40, the High Volume Node and R5 weekly Pivot. Momentum is in control. Wave (III) has a minimum target of $50, per Fibonacci extension rules.
Safe trading
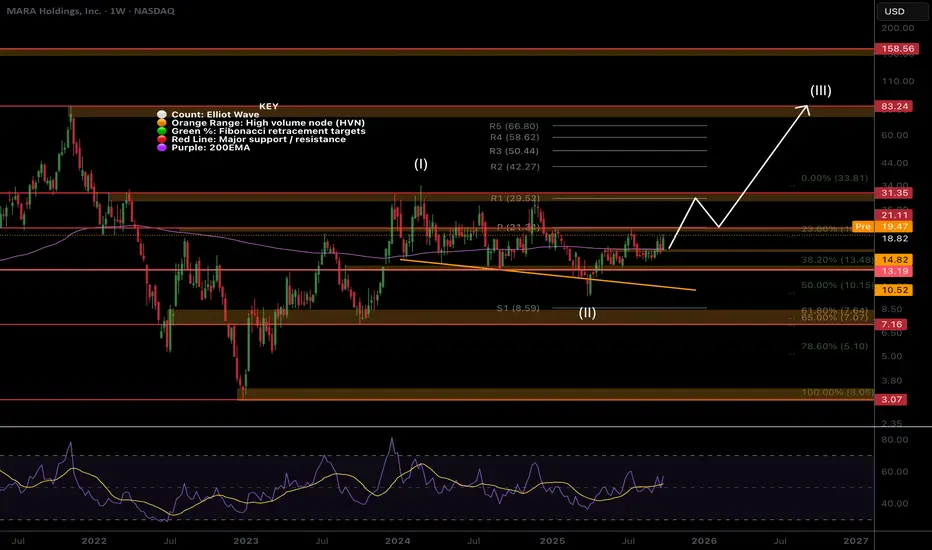
MARA Ready To Finally Move towards $30?MARA’s Elliot Wave (II) retracement front run the Fibonacci golden ratio and has now overcome the weekly 200EMA. The weekly pivot looms as strong resistance $21 just above the first target of our recent trade signal. If wave (III) is underway we should see price begin to accelerate alongside Bitcoin with an initial target of $31 followed by $80 High Volume Node.
Expect price to consolidate at the wave (I) resistance $30 for a while. Weekly RSI is crossed bullishly at the range EQ giving it room to move bullishly!
Safe trading