UKOIL H4 | Bullish Reversal in PlayBased on the H4 chart analysis, we can see that the price has bounced off the entry, which is a pullback support that could potentially rise from this level to the upside.
Buy entry is at 65.58, which his a pullback support.
Stop loss is at 64.54, which aligns with the 127.2% Fibonacci extension.
Take profit is at 68.44, which his a pullback resistance that lines up with the 61.8% Fibonacci retracement.
High Risk Investment Warning
Trading Forex/CFDs on margin carries a high level of risk and may not be suitable for all investors. Leverage can work against you.
Stratos Markets Limited (tradu.com ):
CFDs are complex instruments and come with a high risk of losing money rapidly due to leverage. 65% of retail investor accounts lose money when trading CFDs with this provider. You should consider whether you understand how CFDs work and whether you can afford to take the high risk of losing your money.
Stratos Europe Ltd (tradu.com ):
CFDs are complex instruments and come with a high risk of losing money rapidly due to leverage. 66% of retail investor accounts lose money when trading CFDs with this provider. You should consider whether you understand how CFDs work and whether you can afford to take the high risk of losing your money.
Stratos Global LLC (tradu.com ):
Losses can exceed deposits.
Please be advised that the information presented on TradingView is provided to Tradu (‘Company’, ‘we’) by a third-party provider (‘TFA Global Pte Ltd’). Please be reminded that you are solely responsible for the trading decisions on your account. There is a very high degree of risk involved in trading. Any information and/or content is intended entirely for research, educational and informational purposes only and does not constitute investment or consultation advice or investment strategy. The information is not tailored to the investment needs of any specific person and therefore does not involve a consideration of any of the investment objectives, financial situation or needs of any viewer that may receive it. Kindly also note that past performance is not a reliable indicator of future results. Actual results may differ materially from those anticipated in forward-looking or past performance statements. We assume no liability as to the accuracy or completeness of any of the information and/or content provided herein and the Company cannot be held responsible for any omission, mistake nor for any loss or damage including without limitation to any loss of profit which may arise from reliance on any information supplied by TFA Global Pte Ltd.
The speaker(s) is neither an employee, agent nor representative of Tradu and is therefore acting independently. The opinions given are their own, constitute general market commentary, and do not constitute the opinion or advice of Tradu or any form of personal or investment advice. Tradu neither endorses nor guarantees offerings of third-party speakers, nor is Tradu responsible for the content, veracity or opinions of third-party speakers, presenters or participants.
Energy Commodities

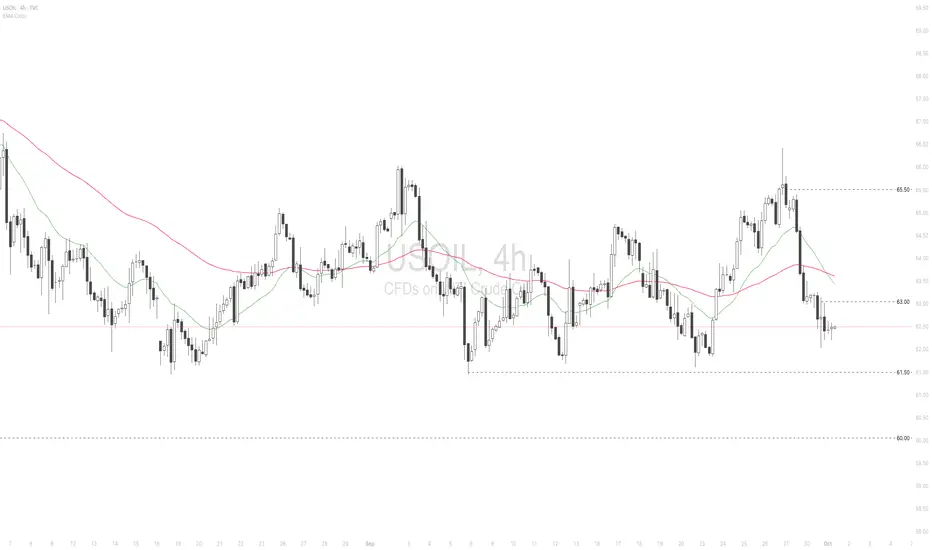
USOIL continues to decline on oversupply concerns
Oil prices tumbled on oversupply fears as major producers ramped up output. Reuters reported that ahead of the OPEC+ meeting on October 5th, November production hikes could exceed the planned 137,000 barrels per day. The resumption of Kurdish oil exports and prospects of additional supply may further pressure prices.
USOIL extended its decline before consolidating within the 61.50–63.00 range. The death cross of the EMAs points to a potential shift toward bearish momentum. If USOIL breaks below the 61.50 support, the price could retreat toward 60.00. Conversely, if USOIL breaks above the 63.00 resistance, the price may advance toward 65.50.
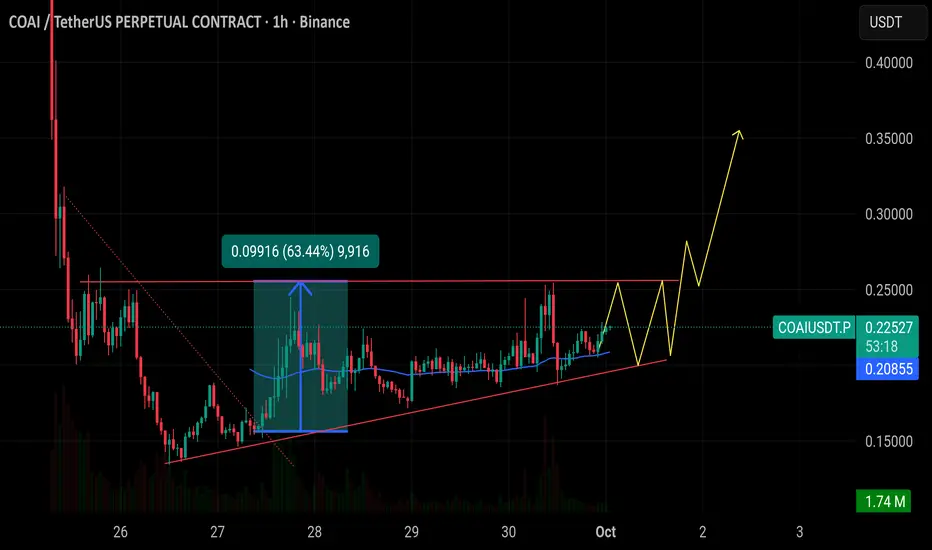
$COAI after a 63% pump is now trading in an Ascending Triangle $COAI after a 63% pump is now trading in an Ascending Triangle with resistance around 0.25 and rising support near 0.20. A breakout above 0.25 could push the price toward 0.35–0.40, while losing the rising support would risk a sharp drop back under 0.19.
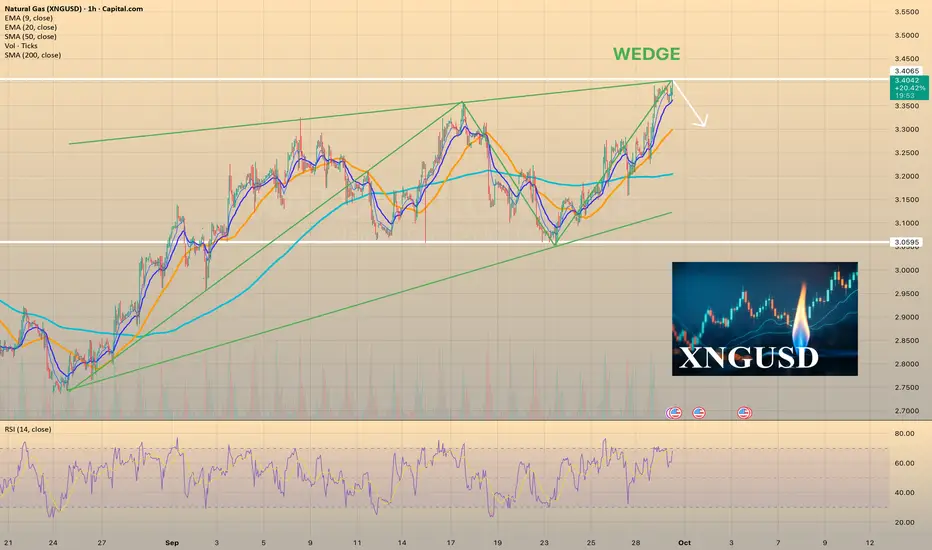
Natural Gas Triggers Bullish PatternNatural gas triggered and confirmed a daily chart breakout.
A technical inverse head and shoulders pattern can be observed.
Natural GAs is rallying on colder temperature forecast in the US.
Colder temps often yield more consumption.
Inventories are set to take place on Thursday...the daily 200MA should be watched closely.

CRUDE OIL Will Grow! Buy!
Hello,Traders!
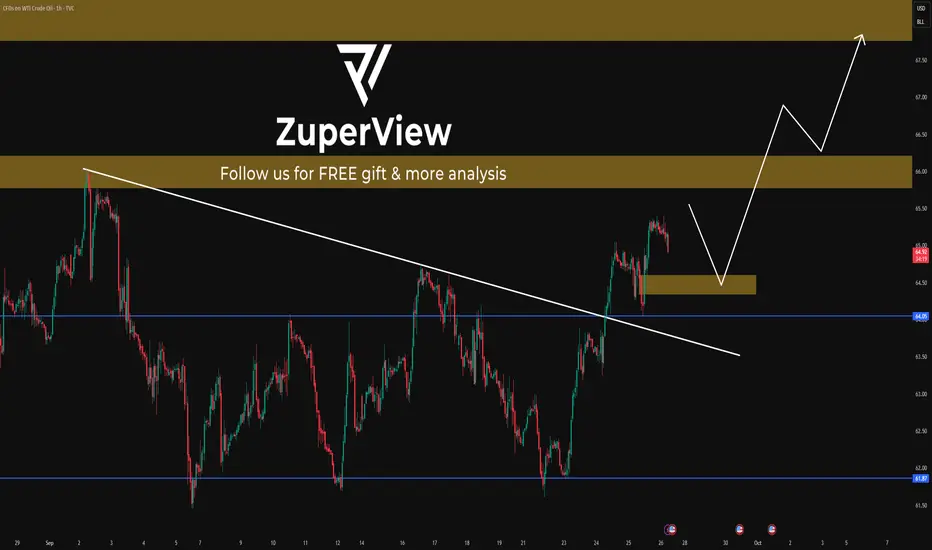
CRUDE OIL after sweeping liquidity from the horizontal demand area, price shows signs of rebalancing inefficiency. From an SMC perspective, buyers may drive the market toward the marked target zone. Time Frame 5H.
Buy!
Comment and subscribe to help us grow!
Check out other forecasts below too!
Disclosure: I am part of Trade Nation's Influencer program and receive a monthly fee for using their TradingView charts in my analysis.

WTI OIL Channel Up bottom buy signalWTI Crude Oil (USOIL) has almost touched the bottom (Higher Lows trend-line) of its September Channel Up, following a strong rejection (Bearish Led) just below the 1D MA200 (orange trend-line).
With the 4H RSI entering its medium-term Buy Zone, we have a strong short-term buy signal at our hands. Our Target is $66.50, expecting a 1D MA200 test, below the 1.1 Fibonacci extension, below which the previous Higher High was priced.
-------------------------------------------------------------------------------
** Please LIKE 👍, FOLLOW ✅, SHARE 🙌 and COMMENT ✍ if you enjoy this idea! Also share your ideas and charts in the comments section below! This is best way to keep it relevant, support us, keep the content here free and allow the idea to reach as many people as possible. **
-------------------------------------------------------------------------------
💸💸💸💸💸💸
👇 👇 👇 👇 👇 👇

U.S. Gas prices recoverU.S. Gas prices recover
On September 29, natural gas finished higher, reversing earlier losses. Prices had initially been pressured by forecasts of warmer-than-normal weather in the coming weeks, but later gained support from other factors — including data showing stronger export demand for U.S. natural gas.
According to EBW Analytics, the above-average warmth is expected to limit natural gas demand through the first half of October. Citing DTN’s temperature forecasts, EBW noted that U.S. storage is projected to grow by about 270 bcf between September 26 and October 16. This means that whenever colder weather eventually arrives, markets will be well supplied, which should help cushion any price spikes.
Now natural gas (XNGUSD) are trading at $3.39.
In Europe storage facilities across the EU have reached 82.5% capacity ahead of winter, according to Gas Infrastructure Europe (GIE). On September 28, EU countries injected 206 million cubic meters of gas into storage, while withdrawals declined to 28 million cubic meters. Total storage now stands at 90.9 billion cubic meters — the seventh-highest September level in the historical record.
Despite this progress, storage levels remain 6.9 percentage points below the five-year seasonal average and well under last year’s 94.2% mark for the same date. Under European Commission rules, member states must fill storage sites to at least 90% between October 1 and December 1 each year, though up to 10% flexibility is permitted under difficult conditions. These requirements are contributing to upward pressure on European gas prices.
USOIL BULLS ARE STRONG HERE|LONG
USOIL SIGNAL
Trade Direction: long
Entry Level: 62.93
Target Level: 64.18
Stop Loss: 62.10
RISK PROFILE
Risk level: medium
Suggested risk: 1%
Timeframe: 4h
Disclosure: I am part of Trade Nation's Influencer program and receive a monthly fee for using their TradingView charts in my analysis.
✅LIKE AND COMMENT MY IDEAS✅

USOIL BEARS WILL DOMINATE THE MARKET|SHORT
USOIL SIGNAL
Trade Direction: short
Entry Level: 65.18
Target Level: 63.42
Stop Loss: 66.35
RISK PROFILE
Risk level: medium
Suggested risk: 1%
Timeframe: 9h
Disclosure: I am part of Trade Nation's Influencer program and receive a monthly fee for using their TradingView charts in my analysis.
✅LIKE AND COMMENT MY IDEAS✅

USOIL: Sideways-to-lower in a tight bandThis is my previous analysis — feel free to take a look for reference.
1. Institutional Forecast Updates
IEA (Sep 15, 2025):
WTI targets $64.2/bbl for 2025 and $47.8/bb l for 2026
Brent targets $68/bbl for 2025 and $51/bb l for 2026
Goldman Sach (Jul 14, 2025):
WTI targets $63/bbl for H2 2025 and $52/bbl for 2026
Brent targets $64/bbl for H2 2025 and $56/bbl for 2026
J.P. Morgan (May 16, 2025):
Brent targets $64/bbl for H2 2025 and $56/bbl for 2026
www.rigzone.com
www.reuters.com www.jpmorgan.com
2. Key Drivers & Risks
📉 Supply
OPEC+ unwinding cuts of 2.2 mb/d (2024–2025), plus +137 kb/d starting October 2025.
Global supply reached 106.9 mb/d in Aug 2025; projected to rise by +2.7 mb/d to 105.8 mb/d in 2025.
U.S. output hit a record 13.2–13.4 mb/d (2024–2025)
Brazil, Guyana, and Canada are key contributors to non-OPEC+ growth.
U.S. shale breakeven costs: ~$62–68/bbl.
New offshore projects breakeven at ~$47/bbl.
OECD inventories in July 2025: 2,848 million barrels; 58.1 days of forward cover.
✳️ Demand
Global oil demand in 2024: ~103 mb/d (~193 EJ)
2025 demand growth of only +0.7 mb/d (weakest since 2009, excluding 2020).
OPEC projects demand growth of +1.3 mb/d in 2025 and +1.4 mb/d in 2026.
Consumption structure: transport accounts for ~two-thirds of oil demand; >90% of transport energy comes from oil.
Petrochemicals (naphtha, LPG) remain a key driver of incremental demand.
🛑 Politics & Geopolitics
Escalating Middle East tensions: growing risks in the Strait of Hormuz and Red Sea.
Kurdistan–Turkey pipeline (~0.23 mb/d) subject to recurring disruptions.
Venezuela: Chevron faces restrictions on U.S. exports.
OPEC+ often produces ~0.5 mb/d below quota due to capacity limits.
Long-term trend: EV adoption and emission policies structurally weaken demand growth.
✅ Overall View:
Overall, governments both want to bring oil prices down to support their economies and also tend to protect oil companies, since prices are currently low relative to many firms’ breakeven levels.
Prices are likely to edge gradually lower within a narrow range of $70–$50, and it is important to closely monitor factors that could trigger supply–demand shocks.
3. Technical Analysis
* Trend: assessed using at least three trend indicators, with market structure as the primary guide.
** Weak or Reversal Signals: Assessed based on one of our criteria for trend reversal signals.
*** Support/Resistance: Selected from multiple factors – static (Swing High, Swing Low, etc.), dynamic (EMA, MA, etc.), psychological (Fibonacci, RSI, etc.) – and determined based on the trader’s discretion.
**** Our advice takes into account all factors, including both fundamental and technical analysis. It is not intended as a profit target. We hope it can serve as a reference to help you trade more effectively. This advice is for informational purposes only and we assume no responsibility for any trading results based on it.
Please like and comment below to support our traders. Your reactions will motivate us to do more analysis in the future 🙏✨

USOIL: Waiting for resistance rejection & buying at support zonePlease refer to my previous higher-timeframe analyses to better follow my current outlook on USOIL.
* Trend: assessed using at least three trend indicators, with market structure as the primary guide.
** Weak or Reversal Signals: Assessed based on one of our criteria for trend reversal signals.
*** Support/Resistance: Selected from multiple factors – static (Swing High, Swing Low, etc.), dynamic (EMA, MA, etc.), psychological (Fibonacci, RSI, etc.) – and determined based on the trader’s discretion.
**** Our advice takes into account all factors, including both fundamental and technical analysis. It is not intended as a profit target. We hope it can serve as a reference to help you trade more effectively. This advice is for informational purposes only and we assume no responsibility for any trading results based on it.
Please like and comment below to support our traders. Your reactions will motivate us to do more analysis in the future 🙏✨
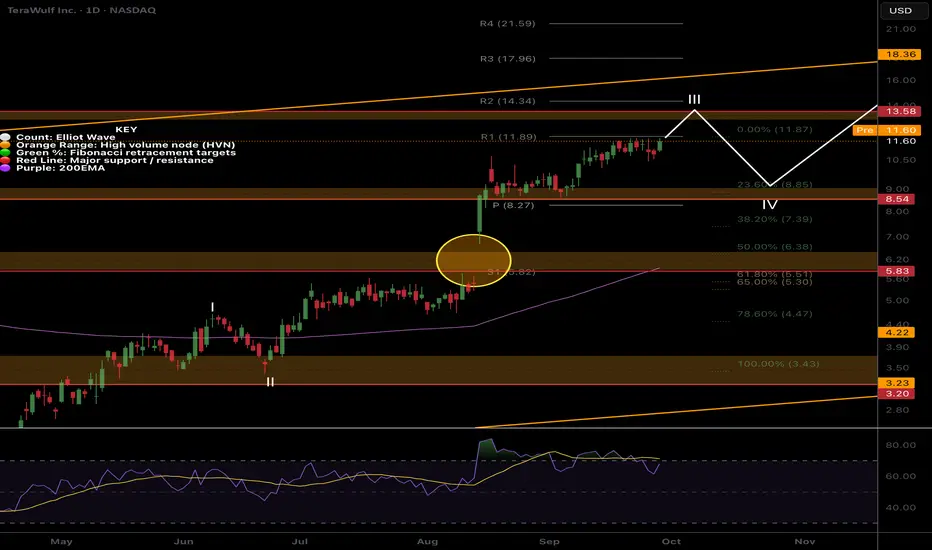
WULF Still in wave 3!NASDAQ:WULF continues to push onwards in wave 3 although gradually. The first target remains $13.48 High Volume Node followed by the macro channel upper boundary trend-line.
Support target is the daily Pivot and High Volume Node at at $8.27 and this is also the wave 4 expected Fibonacci retracement zone of 23.6-38.2.
Daily RSI does have bearish divergence from overbought so a retracement is likely.
Safe trading
IREN still in the bull-trend range!NASDAQ:IREN continues upwards in a tight bullish channel but how long can this extend? R5 pivot targets suggest $65.
Bearish divergence in overbought RSI keeps being negated for now.
Wave (4) downside target is currently the 38.2 Fibonacci retracement at $30.44 and this iwll extend higher as long as price does.
Safe trading

HUT downside still to come?NASDAQ:HUT has had a great rally finally being subdued by the macro channel upper boundary resistance sending price back to the High Volume Node support on overbought RSI.
RSI has reset to the EQ but has room to fall (or grow again). The next target is the High Volume Node resistance and R4 pivot at $44 with a terminal target of $65
If price loses the support node the next support target is the pivot and wave 1 high $24 and I would look out for a long here if we get it.
Safe trading

BTDR Bounces from previous swing high support!NASDAQ:BTDR found support at the at the wave 1 high and R1 pivot and looks poised to continue to the first take profit target and all time High Volume Node tat $25! Wave (3) of 3 appears to be underway so should continue to be powerful!
Analysis is invalidated if we drop below $13 and lose the High Volume Node support which sits at the Fibonacci golden from the wave (2) bottom.
RSI did not reach overbought so has room to grow.
Safe trading

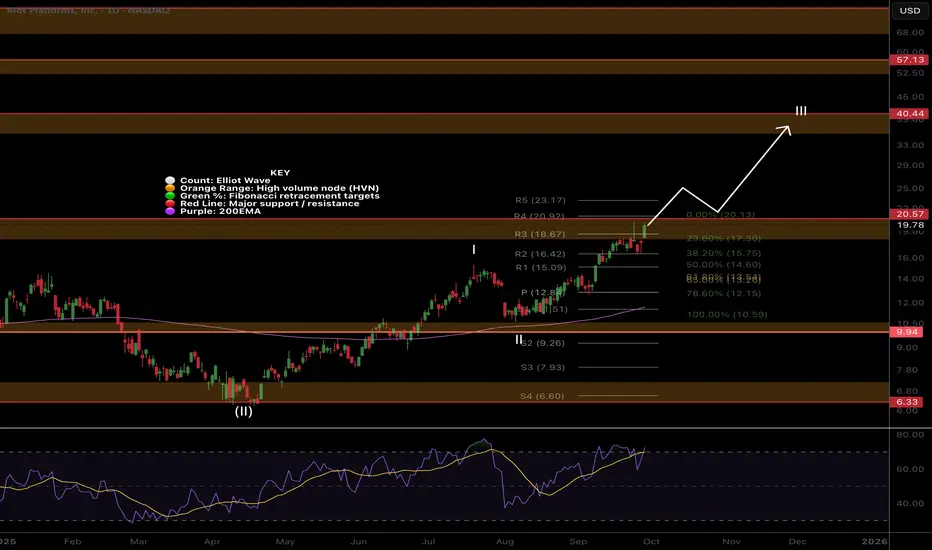
RIOT doesn't want to retrace this time!After hitting the High Volume Node and first take profit area NASDAQ:RIOT was rejected as expected but instead of a deep retracement continued to push powerfully back into the node looking poised for a breakout above!
Once the resistance is clear and tested as support RIOT should move quickly to the next High Volume Node and take profit area at $40.
Analysis is invalidated below the R2 pivot, $16, and the retracement will instead be underway!
Safe trading
MARA Huge bullish engulfing!NASDAQ:MARA had a huge bullish engulfing candle yesterdays almost eclipsing 9 days of price action in 1 session, a characteristic candle for wave 3!
Partial take profit target for me is the High Volume Node between the R4 and R5 pivot, $20, where I expect price to struggle before more upside. Next target is $28 at the descending macro resistance trend-line.
RSI didn't hit overbought and was rejected back to EQ resetting for higher.
Safe trading

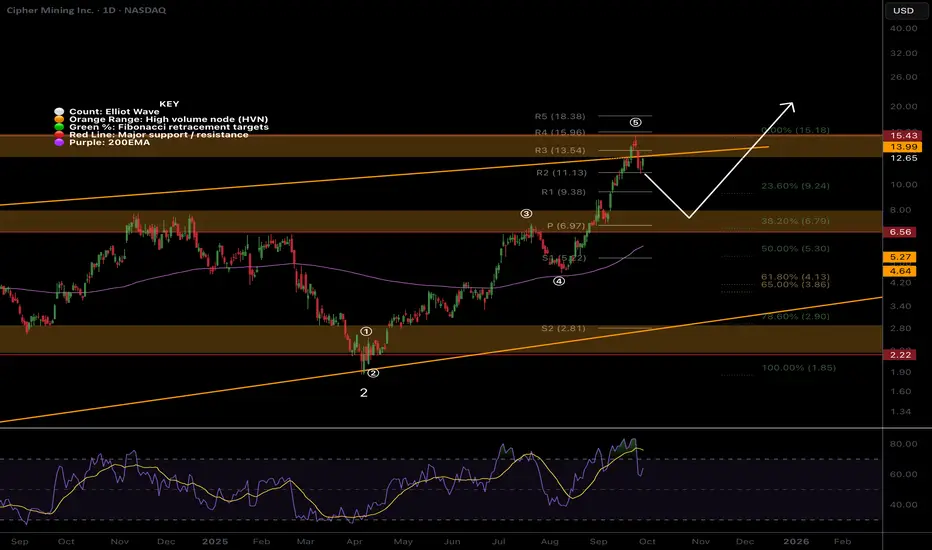
CIFR deep pullback before more upside?CIFR appears to have completed 5 waves for wave (1) of 3 completing at the previous all time High Volume Node where we expect Elliot wave 1s to complete. The orange channel boundary also had a throwover and drop back, an ending pattern!
Wave (2) has an expected shallow pullback of the 38.2 Fibonacci retracement at the daily pivot and High Volume Node support $7 where I will look out for long signals. The ascending 200EMA will also meet this point making it a quadruple support and an excellent opportunity area if price gets there!
If we continue into price discovery the analysis will be invalidated and I'll take a breakout long.
Daily RSI hit overbought but has since fell with no divergence.
Safe trading
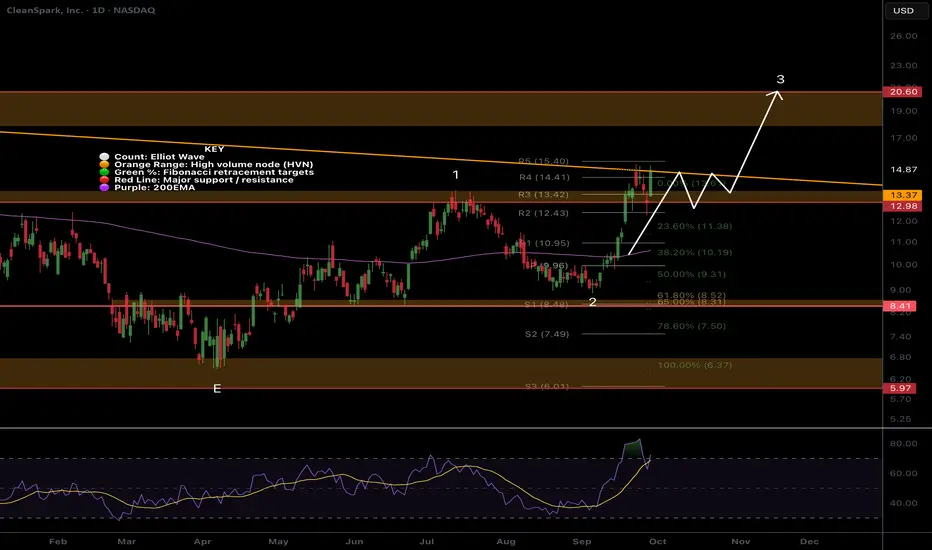
CLSK Attempting a significant resistance breakout!NASDAQ:CLSK has awoken at long last and has smashed through the wave 1 resistance High Volume Node straight into the Macro Triangle upper boundary i have been sharing in the weekly time frame posts. Breaking out above this and wave D at $20 will be a bullish signal with significant upside to come!
The High Volume Node resistance held as support in the big drop last week, quickly recovering back to highs showing strong demand.
The next local target is the wave D resistance $20 with continued upside in wave 3
Daily RSI is overbought but divergence yet and daily 200EMA has flicked positive.
Analysis is good unless we go back below wave 2 into the golden pocket.
Safe trading
WTI Crude Oil🔹 I’ve marked the key resistance zones.
🔹 If I see a reversal signal at any of these levels, I’ll go short.
🔹 The breakout scenario is always valid too—if a level breaks, I’ll take the trade in the direction of the market.
🚫 No bias towards numbers, levels, or analysis.
✨ The key is to flow with the market, not fight it. If you try to stand against it, the market won’t just take your money—it will crush your confidence too.
🎯 We’re only a small part of a bigger picture. Stay flexible, stay unbiased.

30-minute USOIL Key Buy Zones AnalysisHello Guys,
I’ve prepared a USOIL analysis for you.
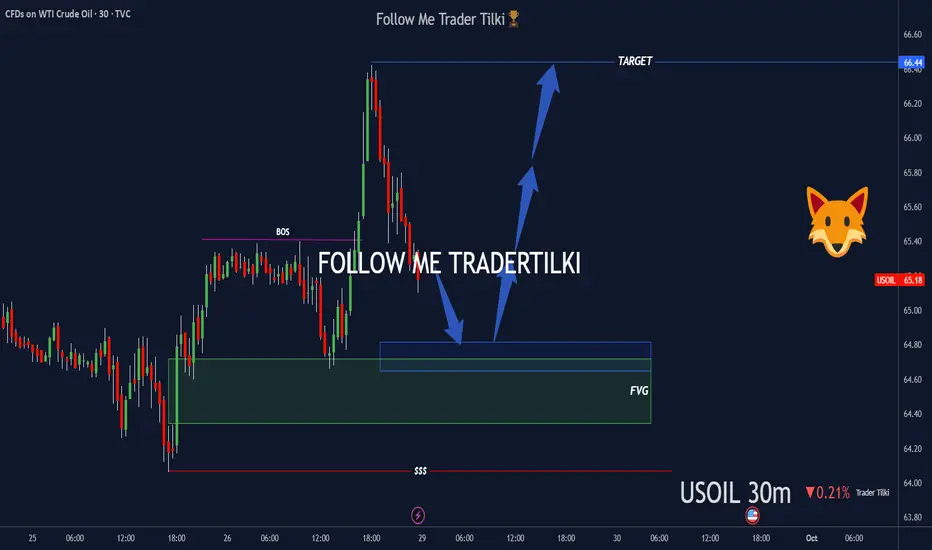
I’m watching two buy zones on USOIL:
🔹 First buy zone: 64.70
🔹 Second buy zone: 64.35 or 64,00
From these levels, I’ll definitely open buy positions and take my shot.
🎯 Target level: 66.40
Every like is my biggest motivation to keep sharing these analyses.
Thanks to everyone supporting me!
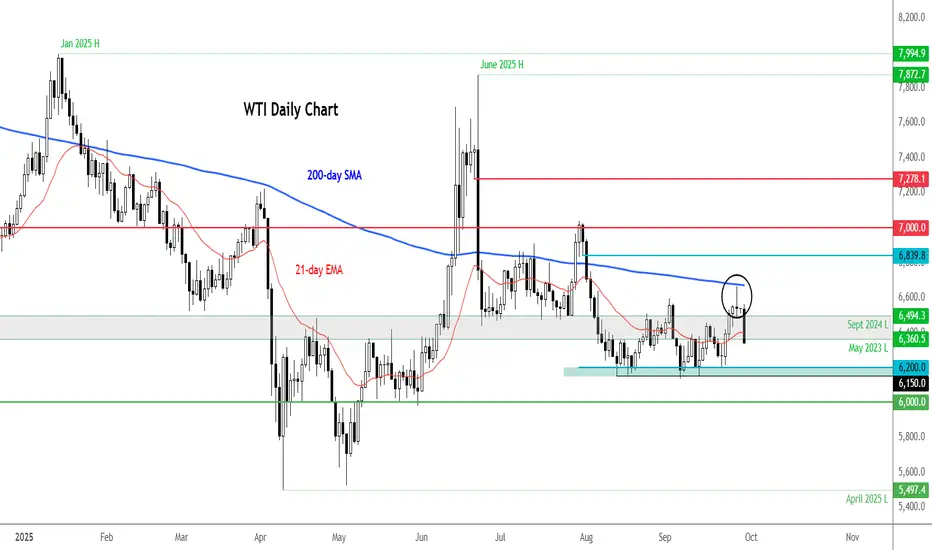
WTI extends drop after 200 MA testAfter printing an inverted hammer off its 200-day average on Friday, we have seen a sharp slide in oil prices today.
Reports that the OPEC+ plans another increase to output in November is not helping the cause, with the market already fearful over excessive supply and weak demand growth.
Key support at 61.50 to 62.00 area was tested multiple times last week and it held. A break below that zone this week could be pivotal, if seen.
Resistance seen at 65.00 now, then the area between 66.50-67.00 - marking the 200 day MA.
By Fawad Razaqzada, market analyst with FOREX.com
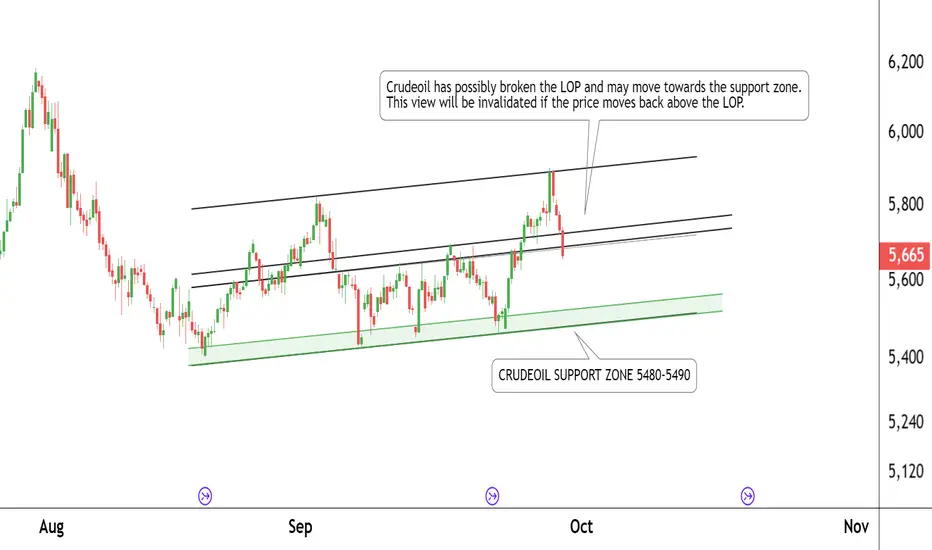
Crude Oil Breakdown – Short Trade ViewThis is the 4-hour timeframe chart of Crude Oil.
Crude Oil has broken the LOP support zone around 5700–5720.
The next key support zone is placed around 5480–5490.
The previous LOP zone may now act as a resistance.
If this resistance holds, Crude Oil prices may continue to move lower.
Thank You!!