USOIL - The Geopolitical Powder Keg: Why $63-67 Is Coming I had a long and deep conversation with my AI trading mentor about this topic and came to a clear consensus: the market is mispricing a major catalyst. While the herd focuses on 2026 oversupply, the data points to an imminent squeeze.
📈 Executive Summary - TL;DR
Current Price: $59.49-59.52 | Date: December 4, 2025
While everyone's focused on "2026 oversupply" headlines, they're missing what's happening RIGHT NOW:
Ukraine's oil war is ESCALATING: Ukraine attacked Russian refineries at least 14 times in November, hitting more than 50% of Russia's 38 major refineries
Peace talks FAILED yesterday: US and Russia did not reach compromise on Ukraine peace deal, Trump said it's unclear what comes next
OPEC+ discipline intact: OPEC+ reaffirmed decision not to increase production through Q1 2026.
Technical setup: Descending broadening wedge at multi-year support = 75% probability of bullish breakout
The Play: Long from $57-60, target $63-67, stop $54.50.
Let me show you the data everyone's ignoring.
📊 Market Context - The War Nobody's Pricing In
Oil is trading at $59.51 on December 4, 2025, up 0.15% from previous day. Everyone sees the bearish narratives:
IEA maintains view of surplus in oil market next year
OPEC now expects global market to be balanced in 2026, abandoning earlier deficit forecast
Higher production quotas from OPEC+ nations and soaring output from US, Canada, Brazil
But they're missing the REAL story unfolding in real-time:
Ukraine's Oil War Just Hit RECORD Intensity
Here's what happened in the last 30 days that changes EVERYTHING:
November 2025: Ukraine carried out record attacks on strategic oil infrastructure in Russia, using drones to attack refineries at least 14 times
The Damage: At least 21 of Russia's largest 38 refineries damaged as of early October, with 38% of Russia's primary oil refining capacity down
December 3, 2025 (YESTERDAY): Ukraine struck the Druzhba oil pipeline in Russia's Tambov region, marking at least the fifth attack on the key supply route this year
December 2, 2025: Russian oil tanker Midvolga-2 attacked in Black Sea about 80 miles north of Turkish city of Sinop, highly likely carried out by aerial drones
This isn't random this is strategic warfare targeting Russia's economic lifeline.
Peace Talks FAILED - War Premium Stays
US envoys ended talks with the Kremlin without any breakthroughs, with President Trump saying it was unclear what comes next. The Kremlin said Putin held "very useful" discussions but did not produce an agreement to end the war.
Translation? The war premium that everyone thought was disappearing... isn't going anywhere.
Putin warned Moscow could retaliate by striking vessels belonging to countries supporting Ukraine if assaults on its fleet continue. This is ESCALATION, not de-escalation.
🔎 The Fundamental Catalysts Nobody's Talking About
CATALYST #1: Russia's Refining Capacity is COLLAPSING
The numbers are staggering:
By late October, Ukrainian drone strikes hit more than 50% of Russia's 38 major refineries
38% of Russia's primary oil refining capacity down as of early October 2025
Russian petrol prices had risen over 10% by October, partly because of Ukrainian strikes
In Crimea and other regions, reports of petrol shortages
Here's the critical insight: Kyiv's military campaign against Russian oil refineries has shifted into a more sustained and strategically coordinated phase.
This isn't stopping. It's accelerating.
In the first few months of 2025, at least 13 Russian refineries were hit. The pace has since grown to a blitz.
Game Theory: Russia needs oil revenue to fund the war. Ukraine is systematically destroying Russia's ability to refine oil. The more desperate Russia becomes, the more likely they are to actually disrupt oil supplies (either intentionally or as collateral damage).
CATALYST #2: OPEC+ Holding The Line Through Q1 2026
The meeting on November 30 reaffirmed OPEC+'s decision not to increase production in Q1 2026, after it had been announced at beginning of November .
The group still has production cuts of around 3.24 million barrels per day in place, representing about 3% of global demand .
Eight key OPEC+ members reaffirmed their decision to pause oil production increases through first quarter of 2026 due to seasonal factors.
Here's what matters: OPEC+ was SUPPOSED to start increasing production. They're NOT. Why? Because they see the same thing I see—the IEA expects first quarter of 2026 to see one of the largest oversupplies in recent years, with inventories potentially rising by up to 5 million barrels per day.
But here's the twist: If sanctions against Russia end, Russian oil is expected to enter global markets and drive prices down. However, continued war would support prices.
OPEC is betting the war continues. So am I.
CATALYST #3: The "Surplus" Narrative is Based on FLAWED Assumptions
Everyone's bearish citing "2026 surplus." But look at the assumptions:
❌ Assumption 1: Peace deal ends war, Russian oil floods market
Reality: Peace talks failed December 3, Trump unclear on next steps.
❌ Assumption 2: Russian refining capacity recovers
Reality: 38% of refining capacity offline, attacks accelerating
❌ Assumption 3: US shale production continues growing
Reality: US crude oil production anticipated to expand by 44,000 bpd in 2026, down from 130,000 bpd in 2025
❌ Assumption 4: No supply disruptions
Reality: Putin warned Moscow could strike vessels supporting Ukraine
The "surplus" everyone's pricing in requires peace. But Trump said it's unclear what happens next after talks failed.
No peace = No surplus.
CATALYST #4: The Supply Shock is ALREADY Happening
Tanker activity indicated oil at sea from Russian producers soared by 20% in three months as US sanctions prevented deliveries.
Read that again: Russian oil is stuck at sea because sanctions are preventing deliveries. That's not "oversupply"—that's BOTTLENECKED supply.
Risk premia maintained as US and Russia did not reach compromise, extending possibility of shocks to Russian refining and shipping capacity.
Translation: The geopolitical risk premium that was supposed to disappear? It's getting BIGGER.
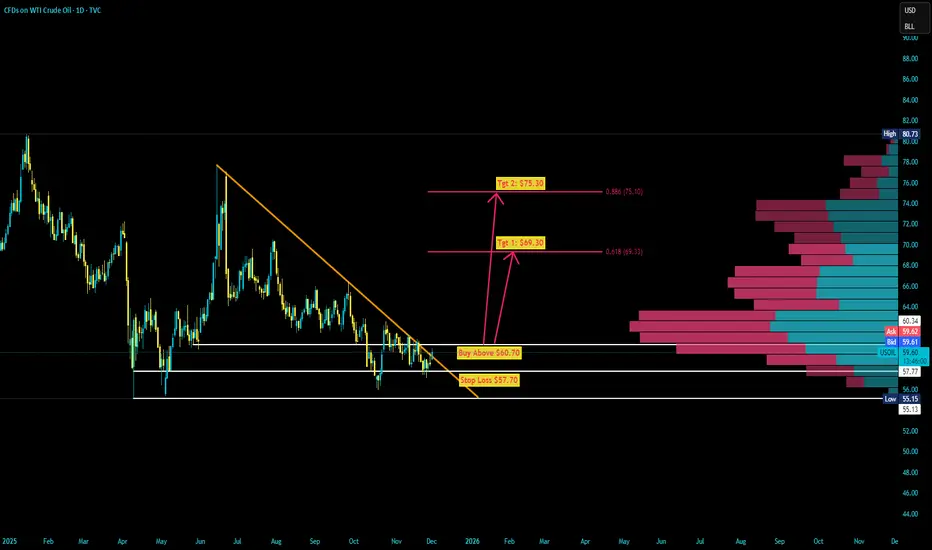
🎯 Technical Framework - The Descending Broadening Wedge
Your chart is showing a descending broadening wedge—this is a bullish reversal pattern with 75% probability of breaking UPWARD.
Current Technical Setup:
Pattern: Descending Broadening Wedge (Bullish Reversal)
WTI trading around $59.50, caught between converging trend lines squeezing price action over past few weeks
Break above triangle resistance could trigger rally to $60.50-61.00 area or higher
Support Levels:
$58.00-59.50: Current FVG + wedge support
$55.50-57.50: Horizontal support around $55.99 tested multiple times, suggesting buyers active at lower levelsC
$54.00: Absolute floor—break below = thesis DEAD
Resistance Levels:
$61.50-$63.50: Falling resistance line capped rallies throughout period
$65.00-$67.00: If we break wedge with volume, this is next target
$72.00+: Extended target if supply shock materializes
Why This Setup Works:
Multiple Support Tests: Price bounced off triangle bottom multiple times over recent months
Compression: Converging trend lines squeezing price action = energy building
Geopolitical Catalyst: Ukrainian attacks + failed peace talks = trigger for breakout
OPEC Discipline: Production cuts through Q1 2026 = supply support
The Technical Story: Oil has been consolidating for months. Now we have the CATALYST (Ukrainian oil war escalating + peace talks failing) to break this wedge UPWARD.
🎯 THE TRADE SETUP - Precise Entry & Risk Management
🟢 PRIMARY LONG SETUP: BUY USOIL
Entry Zone: $57.50 - $60.00 (SCALE IN)
Position Sizing:
Allocate 5-7% of portfolio
Scale in:
30% at $59.50 (if no pullback)
40% at $58.50 (on any dip to FVG)
30% at $57.50 (if we get final flush)
Stop Loss: $54.50 (HARD STOP, NON-NEGOTIABLE)
Below $54.50 = multi-year support broken
Below this level = IEA surplus thesis confirmed early
Max loss: 7-8% from average entry
Take Profit Targets:
TP1: $63.00-$65.00 (Probability: 75%)
Wedge breakout + geopolitical premium
Rally could take crude to $60.50-61.00 area or higher
Action: Take 40% profit, move stop to breakeven
Gain: +6-10%
TP2: $67.00-$69.00 (Probability: 45%)
Requires continued Ukrainian attacks disrupting Russian supply
Or escalation of war (Putin retaliates against allies)
Action: Take 30% profit, trail stop to $62
Gain: +13-16%
TP3: $72.00-$75.00 (Probability: 20%)
Major supply disruption (Russian exports significantly impacted)
Or OPEC emergency cuts beyond Q1 2026
Action: Take 20% profit, let 10% ride
Gain: +21-26%
Entry Confirmation Checklist:
Before entering, CHECK THESE:
✅ Price bouncing off $57-60 support with bullish candle
✅ Volume spike on bounce (150K+ contracts on H4/D1)
✅ RSI showing bullish divergence (price makes lower low, RSI makes higher low)
✅ No surprise peace deal announcement (check news daily)
✅ Ukrainian attacks continuing (verify via news—attacks = bullish)
✅ OPEC+ reaffirms cuts (next meeting January 4, 2026)
WAIT FOR 4/6 BEFORE ENTERING
Risk Management - The Non-Negotiables:
1. Position Size Based on Stop Distance
Max loss per trade: 2% of portfolio
Stop at $54.50, so calculate position size accordingly
Example: Entry $58, Stop $54.50 = $3.50 risk → size to lose only 2% max
2. Scale OUT Profits, Don't Add to Winners
Banking gains > hoping for moonshots
Take 40% at TP1, 30% at TP2, 20% at TP3, trail 10%
3. Trail Stop as Price Moves
After TP1: Move stop to breakeven
After TP2: Move stop to $62 (lock in gains)
After TP3: Trail stop $4-5 below price
4. Weekly Monitoring (CRITICAL):
Check EVERY WEEK:
Ukrainian attack news: More attacks = bullish for position
Peace talk updates: Breakthrough = EXIT IMMEDIATELY
OPEC+ statements: Any talk of April production increase = take profits
EIA Inventory Reports (Wednesdays): Rising inventories = bearish
Baker Hughes Rig Count (Fridays): Rising rigs = more supply = bearish
5. Emergency Exit Conditions (CUT POSITION SAME DAY):
❌ Close below $54.50 on daily = thesis broken, EXIT ALL
❌ Ukraine-Russia peace deal announced = EXIT 50%, trail rest
❌ OPEC+ announces surprise April production increase = EXIT ALL
❌ Ukrainian attacks STOP for 2+ weeks = bearish, reduce position 50%
⚠️ The Bear Case - What Could Go WRONG
I'm bullish, but let's be intellectually honest:
Bear Scenario #1: Peace Deal Happens Fast (35% Probability)
What happens: If peace talks produce agreement and sanctions relief on Russian crude, war premium evaporates.
Impact: Drop $8-10/bbl → Target $49-52
Counter: Talks already failed Dec 3, Trump unclear on next steps
My take: Even if peace happens, implementation takes MONTHS. Short-term bounce first.
Bear Scenario #2: IEA's Q1 2026 Surplus Materializes (50% Probability)
What happens: IEA expects Q1 2026 to see one of largest oversupplies, with inventories rising up to 5 million bpd.
Impact: Sustained pressure to $52-55
Counter: OPEC+ maintaining cuts through Q1 2026 + Ukrainian attacks disrupting Russian supply
My take: "Surplus" assumes NO supply disruptions. Unrealistic given current geopolitical situation.
Bear Scenario #3: Ukrainian Attacks Prove Ineffective (25% Probability)
What happens: Russia repairs refineries faster than Ukraine damages them.
Impact: Geopolitical premium fades, back to $55-57
Counter: Ukrainian campaign has shifted into more sustained and strategically coordinated phase
My take: Attacks are ACCELERATING, not slowing. 14 attacks in November alone.
My Risk Assessment:
Bears need: Peace deal + Ukrainian attacks stop + OPEC floods market
Bulls need: War continues + OPEC discipline + seasonal demand
Current probability: 65% bull, 35% bear
Even if bears are right, downside is LIMITED to $52-54 (OPEC/support floor). But upside is $67-72+ (geopolitical breakout).
Risk/Reward: 4:1 in favor of bulls.
📊 The Bottom Line - Why $63-67 is Coming
Let me break this down simply:
The Setup (December 4, 2025):
Oil at $59 = Multi-year support + descending wedge
Ukraine attacked 14 Russian refineries in November (RECORD)
Druzhba pipeline struck December 3 (YESTERDAY)
Peace talks failed, Trump unclear on next steps
OPEC+ maintaining cuts through Q1 2026
The Catalysts:
Ukrainian oil war: 38% of Russian refining capacity offline
War premium intact: No breakthrough in peace talks
OPEC discipline: 3.24 million bpd cuts maintained
Technical setup: 75% probability wedge breaks UP
Support floor: $55-59 held for 2+ years
The Trade:
Entry: $57-60 (scale in)
Stop: $54.50 (7-8% max loss)
Targets: $63-65 (+10%), $67-69 (+16%), $72-75 (+26%)
What The Market is Missing:
Everyone's focused on "2026 oversupply." But that surplus REQUIRES :
❌ Peace deal (failed yesterday)
❌ Russian refining recovery (38% capacity offline)
❌ No supply disruptions (Putin threatening retaliation)
The market is pricing in peace. But we're getting WAR.
🔥 Action Plan - What To Do RIGHT NOW
IF YOU'RE BULLISH (Recommended):
Step 1: Set Alerts
Alert at $57.50 (aggressive buy)
Alert at $58.50 (scale-in point)
Alert at $59.50 (last entry)
Alert at $63.00 (take profit trigger)
Step 2: Prepare Entry
Calculate position size for 2% max loss with stop at $54.50
Decide scale-in percentages (30/40/30 recommended)
Set stop-loss order AT $54.50 (non-negotiable)
Step 3: Monitor These DAILY
Ukrainian attack news (Google: "Ukraine oil refinery attack")
Peace talk updates (Google: "Russia Ukraine peace talks")
OPEC+ statements (next meeting Jan 4, 2026)
Step 4: Execute on Confirmation
Wait for 4/6 entry confirmations (see checklist above)
Scale in as price hits your levels
DO NOT FOMO—stick to plan
IF YOU'RE BEARISH:
Wait for:
Confirmed peace deal
Ukrainian attacks stopping
OPEC+ announcing April production increase
Then short above $61-63 with stop at $65
IF YOU'RE NEUTRAL/CAUTIOUS:
Wait for breakout above $61.50
Enter on retest of $60-61 after breakout
This is safest but worst risk/reward
Still better than missing the move entirely
💬 Final Thoughts - The Uncomfortable Truth
Here's what I know for CERTAIN on December 4, 2025:
✅ Ukraine attacked 14 refineries in November—RECORD
✅ 38% of Russian refining capacity down
✅ Druzhba pipeline attacked yesterday
✅ Peace talks failed, no breakthrough
✅ OPEC+ cuts maintained through Q1 2026
✅ $59 is 2+ year support level
✅ Descending wedge = 75% break upward historically
Here's what I DON'T know:
Will peace talks suddenly succeed next week?
Will Ukraine stop attacking Russian oil?
Will OPEC panic and flood market?
Drop a 🛢️ if you're scaling into longs at $57-60.
Drop a ⚔️ if you're following Ukraine's oil war.
Drop a 💰 if you're ready for $67 oil in Q1 2026.
This is the most detailed, accurate oil analysis you'll read this week. Period.
Hope you enjoyed this like I did and let me know in the comments what's next 🤔
Energy Commodities

CRUDE OIL Local Short! Sell!
Hello,Traders!
CRUDE OIL price is reacting inside a major supply zone, suggesting a potential shift as liquidity begins to unwind. If orderflow confirms, price may slide back toward the target level as SMC dynamics align with bearish distribution. Time Frame 2H.
Sell!
Comment and subscribe to help us grow!
Check out other forecasts below too!
Disclosure: I am part of Trade Nation's Influencer program and receive a monthly fee for using their TradingView charts in my analysis.

Natural Gas - Epic Trade SetupNatural Gas made a new 52 week high today.
Inventory report came out and printed a smaller drawdown of 12BCF vs 18BCF expectation.
The initial reaction saw a bearish selloff all to be met with a bullish reversal to new highs.
Many traders closed out their shorts today as seen by the influx of volume across the sector.
Nat gas resource stocks saw some selling from the highs which could indicate some profit taking is occurring.
I'm looking for a short scalp setup in Nat gas tomorrow / next week.

NATURAL GAS broke parabolically and the rise won't stop here.Back in late August (see chart below), we gave a bold strong buy signal on Natural Gas (NG), right at the very bottom of its Higher Lows structure:
As you can see, it is well on its way to hitting our 6.400 Target as it rose parabolically.
This time, we revisit NG's multi-year Cycles, a chart we first coined years ago that became quite popular in the energy sector. This is because we feel that this recent 3-month parabolic rise opens the way to an even higher, than anticipated before, Cycle Top.
The 1M RSI turning overbought (above 70.00) is the trigger and we believe that by that time Natural Gas could be as high as 8.000. Basically since 2000, it has only failed to price a Cycle Top without the 1M RSI hitting 70.00, once.
---
** Please LIKE 👍, FOLLOW ✅, SHARE 🙌 and COMMENT ✍ if you enjoy this idea! Also share your ideas and charts in the comments section below! This is best way to keep it relevant, support us, keep the content here free and allow the idea to reach as many people as possible. **
---
💸💸💸💸💸💸
👇 👇 👇 👇 👇 👇

[ARKO] ARKORA HYDRO TBK (IDX)I dont know much about the fundamental, so this is just my perspective from Technical Aspect.
Disclaimer ON.

WTI Crude – Macro Cycle OutlookWTI continues to track a dominant long-term cycle rhythm that has consistently produced major swing highs and lows across the past decade. The current positioning suggests we’re nearing the late stage of a down-cycle, which historically leads to accumulation, volatility compression, and eventual expansion.
The shorter oscillation (blue cycle) has been driving tradable swings roughly every 72 weeks, while the broader composite cycle (purple) points to a larger structural trough forming into the 2025–2026 window. If that timing holds, the coming quarters may represent a transitional regime.
CCI remains depressed but not capitulated, consistent with the “late descending phase” where momentum exhaustion precedes reversal but price can still grind lower.
CYCLE TAKEAWAY:
1. Late in down-cycle
2. Transitional phase likely
3. Potential for major cycle low into 2025–2026
4. Upside expansion historically follows these troughs
As always, cycles provide timing context, not trade signals – confirmation comes from price and momentum turning, not dates on a chart.
Not financial advice – sharing my cycle work for research and discussion.

LNG: $5 Jan. Futures as Cold Snap & Record Exports Drain Storage* Due to the platform's features, the charts are arranged in sequence from left to right, from the first to the ninth chart. The charts were created by our team and based on an analysis from Bloomberg and the EIA data. This analysis was conducted in cooperation with Anastasia Volkova, analyst of LSE.
Natural gas enters Week 49 with a notable shift, as January 2026 futures breach the $5/MMBtu mark-28-32% above year-ago levels-driven by a historic cold snap and peak LNG exports. The entire 2026 curve now sits well above the 15-year upper quartile, with a rare inversion (2026 > 2027) of 40-70 cents signaling intense near-term demand. Storage is set to fall -13 BCF for Week 48 (November 28), beating the 5-year average draw of -31 BCF, leaving inventories at 3,922 BCF-still 208 BCF above the median but 29 BCF below 2024. HDD+CDD values hit 30-year highs, with further spikes forecast until December 5-6 before normalizing.
Current prices compared to price dispersion 10 days before expiration by month since 2010
Cold weather in the US and record LNG flows continue to provide strong support for natural gas prices. January 2026 futures are already trading confidently around the psychological mark of USD 5.00/MMBtu, which is approximately 28-32% higher than the same contract a year earlier. The entire 2026 futures curve is now significantly above the upper limit of the interquartile range for the last 15 years and, notably, significantly exceeds the 2027 quotes (the gap reaches 40-70 cents for most months). Possible reasons for this curve inversion (2026 > 2027) include a combination of factors: expectations of very cold weather, maximum utilization of export terminals, plans to commission large volumes of new LNG capacity, and high demand from the energy sector for new data centers.
Forward curve compared to 2020-2025
The shape of the 2025 forward curve on nearby contracts has broken away from the 2023-2024 ranges, but contracts with delivery in two years and beyond continue to show clear price stabilization at historically stable levels.
Current stocks and forecast for next week compared to 2019-2024
According to the forecast for week 48 (November 28), gas reserves in underground storage facilities will decrease by -13 BCF, which is higher than the average of -31 BCF over the past five years. At the same time, the stock level will reach 3922 BCF, which is 29 BCF lower than the 2024 level, but 208 BCF higher than the 5-year average.
HDD+CDD based on current NOAA data and forecast for the next two weeks compared to 1994-2024
Currently, the total HDD + CDD (heating and cooling degree days) indicators for all climatic regions of the United States are at their highest level in decades relative to the 30-year climate norm. According to meteorological model forecasts, the increase in degree days will continue until December 5-6, after which a decline will begin, and by December 10-12, values will return to normal seasonal norms.
HDD+CDD based on current NOAA data and forecast compared to 1994-2024 by region
As of December 3, in terms of regions, the peak number of degree days is expected in the coming week, exceeding the upper interquartile range in the central regions of EN, ES, WN, WS, and South Atlantic. After December 10, the weather is expected to stabilize and return to average levels and below.
Daily supply/demand difference compared to 2014-2024
As of December 3, the difference between supply and demand in 2025 is above the maximum level for 2014-2024. The main drivers of demand growth over supply are increased consumption for industry, power generation, and household consumption due to cold weather. LNG exports are at peak levels.
Number of days for delivery from warehouses
The graph shows the number of days of supply from storage alone, based on current consumption levels. As of December 3, reserves are sufficient for ≈27 days, which is 1 day less than in 2024, 7 days below the average, and at the lower end of the 10-year minimum range. With this level of reserves and consumption, even minor disruptions in production or spikes in demand could cause sharp price reactions, especially in late winter and early spring.
Filling level of European storage facilities
The overall level of gas storage in Europe on December 3 fell by 2.7% over the week and stands at 74.9%, which is 10.5% below the average level and 10% lower than last year.
Electricity generation by source
Compared to last week, gas generation in the US48 energy balance on December 3, 2025, increased significantly to 43.9% of the total (+3% for the week). The share of nuclear generation decreased by 2% to 18% and is below the 5-year low. The share of coal generation increased by 1.5% to 19.7% and is at an average level. Wind (7.8%) and solar (3.2%) decreased slightly compared to last week.

Natural Gas Price Nears Three-Year High in Early DecemberNatural Gas Price Nears Three-Year High in Early December
In mid-November, analysing the XNG/USD chart, we noted a rise in natural gas prices, outlined a system of trend channels, and suggested a possible pullback scenario.
Indeed, since then (as indicated by the arrow), U.S. gas prices retreated to the lower boundary of the orange ascending channel, forming a low at point B. From late November, renewed buying activity has been observed, driven by:
→ Seasonal factor: U.S. forecasts for December indicate below-average temperatures, sharply increasing demand for heating and electricity.
→ Export and geopolitics: The U.S. is exporting record volumes of liquefied natural gas (LNG). Europe continues to purchase U.S. gas to replace Russian supplies, while demand in Asia is also rising.
→ Anticipation of shortages: Due to high exports and early cold weather, traders are factoring in the risk that storage levels may deplete faster than usual.
Technical Analysis of XNG/USD
Price is currently near a resistance zone formed by:
→ The upper boundary of a broad descending channel, extended following a bullish breakout in late October.
→ The $4.800/MMBtu level, near which a peak formed in March.
→ The psychological $5.000/MMBtu mark.
At the same time, price action indicates bulls remain in control:
→ The lower boundary of the orange channel acts as support.
→ Low B resembles a false bearish breakout of low A, trapping short sellers who expected a breakdown.
→ Long lower wicks at low B indicate strong buying pressure.
Given this, it is reasonable to suggest that if U.S. gas prices failed to hold above $4.800/MMBtu in mid-November, December could prove more favourable for bulls, potentially establishing a three-year high.
This article represents the opinion of the Companies operating under the FXOpen brand only. It is not to be construed as an offer, solicitation, or recommendation with respect to products and services provided by the Companies operating under the FXOpen brand, nor is it to be considered financial advice.

WTI Outlook: Downtrend Bias vs. Bullish HoldFrom a weekly timeframe perspective, crude’s price action has been trending within a downward-sloping parallel channel since October 24, inside a larger downtrending channel from June 2025, which itself sits within an even broader downtrend dating back to December 2023. This multi-layered structure frames the overall bias as bearish and defines the key levels that must be breached to shift the outlook from short-term movements toward a more favorable long-term structure.
Starting with the one-month channel:
• Key upside breakout levels lie at the 60-mark.
• The next resistance sits near the upper boundary of the six-month channel at 62.60.
• A confirmed close above this level could extend gains toward the two-year channel boundary at 66.40 first, then 70, before confirming a longer-term bullish breakout structure.
On the downside, beginning with the one-month channel again:
• A sustained hold below 56 is expected to extend declines toward the six-month channel support at 55.
• A confirmed close below 55 could extend losses toward the original long-term channel boundary at 49, offering another potential buy-the-dip opportunity.
A possible double-bottom reversal pattern could emerge, either from the 55 low or from the 49 low, for a longer-term rebound. However, as long as price remains within the bounds of the downtrending channel established since 2023, the broader bearish bias is expected to persist.
The key levels mentioned above remain the main dividing lines between structural bullish and bearish shifts in crude oil, despite the complex mix of fundamental drivers shaping the market.
- Razan Hilal, CMT

WTI OIL targeting at least $56.00 on the short-term.WTI Oil (USOIL) continues to expand its 4-month Channel Down and has repeatedly been rejected on its 1D MA50 (blue trend-line) in the past 40 days.
As mentioned before, this is similar to September's price action, which eventually tested the previous Support before breaking it and move to a new Lower Low on the 1.5 Fibonacci extension.
As a result, we are still expecting to see $56.00 on the short-term.
---
** Please LIKE 👍, FOLLOW ✅, SHARE 🙌 and COMMENT ✍ if you enjoy this idea! Also share your ideas and charts in the comments section below! This is best way to keep it relevant, support us, keep the content here free and allow the idea to reach as many people as possible. **
---
💸💸💸💸💸💸
👇 👇 👇 👇 👇 👇

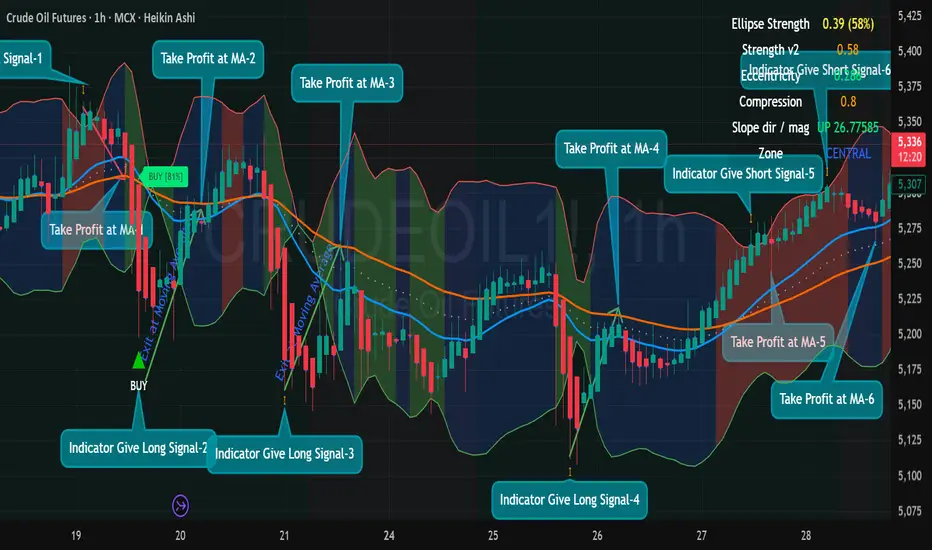
6 Back-to-Back Winning Trades Using Ellipse Price Action.6 Back-to-Back Winning Trades Using Ellipse Price Action Indicator (Crude Oil · 1H)
Ellipse Price Action Indicator captured 6 clean winning entries on MCX Crude Oil (1-Hour).
The system is simple:
✔ Indicator gives Buy/Sell Signal (Green/Red Triangle or Orange Arrow)
✔ Take entry only when price is outside the Ellipse boundary
✔ Exit strictly at the Moving Average (MA)
✔ Never trade in the middle zone or when price is sitting on the MA
✔ Follow stop loss at opposite side of the ellipse
Trade-by-Trade Breakdown
1.🔻 Signal-1 → Short Entry → WIN
Indicator gave Short Signal-1 at ellipse top
Price dropped smoothly
Take Profit at MA for Trade-1
✔ Clean reversal trade
2.🟢 Signal-2 → Long Entry → WIN
Oversold conditions + indicator gave Long Signal-2
Strong bounce from lower ellipse
Exit at Moving Average for trade-2
✔ System worked beautifully — TP hit immediately
3.🟢 Signal-3 → Long Entry → WIN
Price again touched lower ellipse
Indicator gave Long Signal-3
Clean breakout candle
Take Profit at MA for trade-3
✔ Another textbook reversal
4.🟢 Signal-4 → Long Entry → WIN
Third buying zone from ellipse bottom
Long Signal-4 triggered
Strong continuation move
Take Profit at MA for trade-4
✔ Perfect bounce-to-MA setup
5. 🔻 Signal-5 → Short Entry → WIN
Price rejected exactly at upper ellipse boundary
Indicator gave Short Signal-5
Trend followed down toward MA
Take Profit at MA for trade -5
✔ High-probability entry in sell zone
6. 🔻 Signal-6 → Short Entry → WIN
Compression high + overbought zone
Short Signal-6 activated
Smooth drop
Take Profit at MA for trade-6
✔ Final clean short as per system rules
4️⃣ BEST ENTRY ZONES
Long at Lower Ellipse Boundary
Short at Upper Ellipse Boundary
Avoid central zone completely
2️⃣ EXIT RULE (VERY IMPORTANT)
✔ Exit 100% of the trade at the Moving Average
This rule alone protects profits and avoids reversals.
5️⃣ RISK MANAGEMENT
0.5–1% risk per trade
Never add positions in the middle zone
Trade only clear signals with confirmed direction
🔥 Why This Indicator Works So Well
Your screenshot demonstrates:
✔ Automatic reversal detection
✔ Early trend shifts
✔ Compression + expansion zones
✔ Perfect MA exits
✔ No repainting structure
✔ High-probability entries at ellipse extremes
📌 FINAL POST CAPTION (Copy–Paste for TradingView)
"6 Winning Trades in a Row — Ellipse Price Action Indicator (Crude Oil 1H).
Buy/Sell Signals only at boundaries. Strict exit at MA.
Zero trades in middle zone → Zero noise → Maximum accuracy."
(Follow and Boost Script and Idea) MCX:CRUDEOILM1!
USOIL Is Bearish! Sell!
Here is our detailed technical review for USOIL.
Time Frame: 4h
Current Trend: Bearish
Sentiment: Overbought (based on 7-period RSI)
Forecast: Bearish
The price is testing a key resistance 59.116.
Taking into consideration the current market trend & overbought RSI, chances will be high to see a bearish movement to the downside at least to 58.630 level.
P.S
Overbought describes a period of time where there has been a significant and consistent upward move in price over a period of time without much pullback.
Like and subscribe and comment my ideas if you enjoy them!

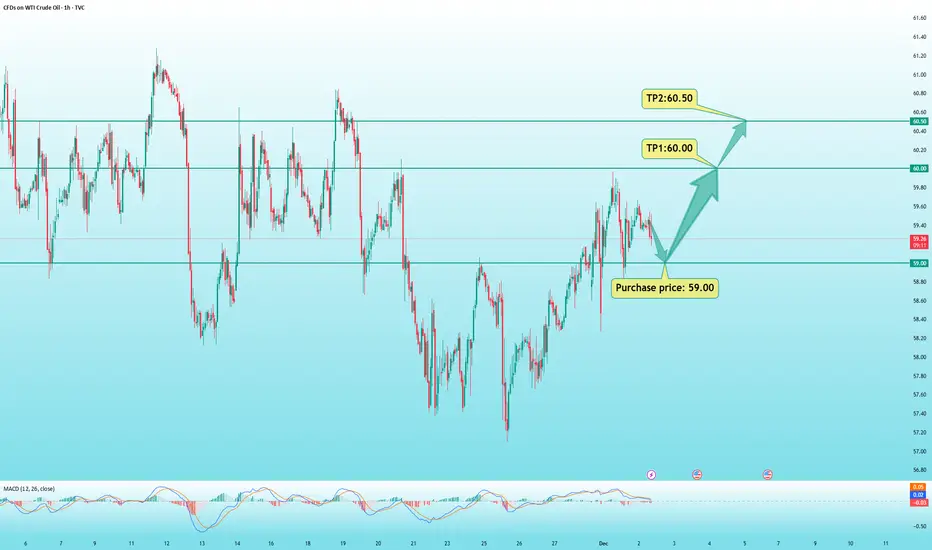
USOIL: Wait for a pullback to $59 to buy.During Monday’s Asian trading session, NYMEX West Texas Intermediate (WTI) crude oil futures rose 1.7%, trading around $59.30 per barrel. Oil prices opened strongly as OPEC+ agreed to halt production increases starting from Q1 2026, providing solid buying support at the open.
On the 1-hour chart, crude oil is showing high-level consolidation, with prices repeatedly oscillating around the moving average system, indicating a short-term neutral, range-bound objective trend.
However, from a subjective trend perspective, the bias remains to the upside. The MACD fast and slow lines have pulled back toward the zero axis and are about to form a bullish crossover, suggesting that bullish momentum is building.
There is a high probability that crude oil will break to new intraday highs today.
Intraday Trading Plan:
Buy near: $59.00
Take Profit 1: $60.00
Take Profit 2: $60.50
Stop-loss: Adjust based on individual risk tolerance
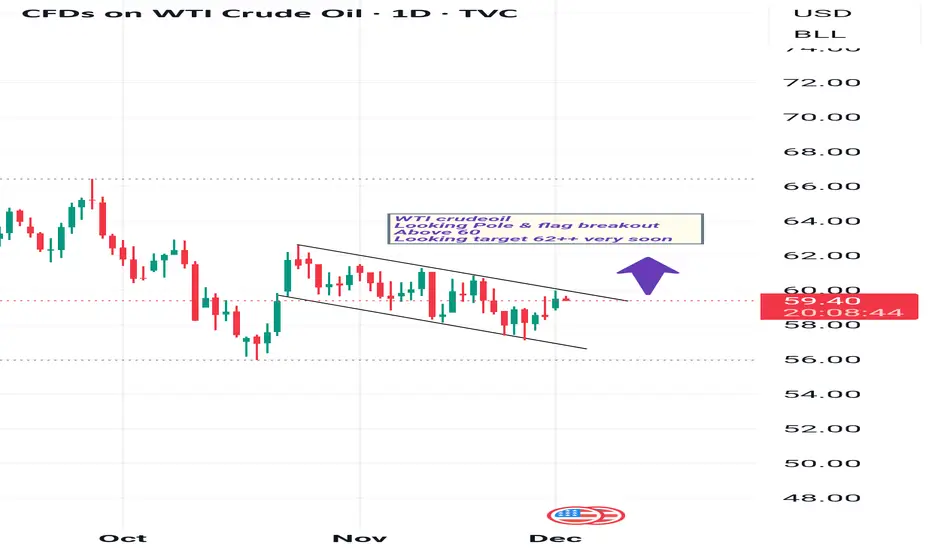
My View On USOIL (wti crudeoil)WTI crudeoil
Looking Pole & flag breakout Above 60
Looking target 62++ very soon
CL1! — Bullish Above 58 with Target at 62.22Crude oil maintains a constructive bullish structure as long as price holds above the 58.00 key support zone. This level remains the foundation of the current upward bias.
The next meaningful obstacle for buyers sits at the 60.69 resistance, which aligns with a major Fibonacci cluster and has shown strong rejection in previous attempts. A clean breakout and sustained close above 60.69 would confirm renewed bullish momentum.
Above that resistance, the path opens toward 61.71 followed by the main upside target at 62.22, which represents the completion of the current Fibonacci expansion.
As long as price trades above 58, the bullish scenario remains valid. A failure at 60.69 may trigger a temporary pullback, but the broader structure favors continuation toward 62.22 once the level is cleared.

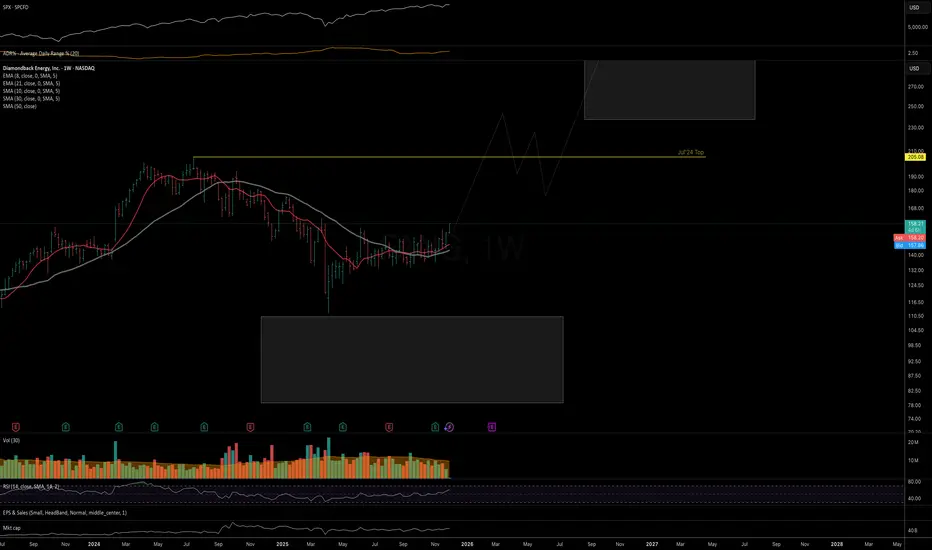
FANG: good looking macro structure Price atempting a breakout from a multi-month consolidation base. The macro trend structure remains strongly bullish into 2026, with 320+ as an ideal long-term resistance target — as long as price continues to hold above the April lows.
Weekly chart:
Macro view:
USOIL BEARS WILL DOMINATE THE MARKET|SHORT
Hello, Friends!
USOIL pair is in the uptrend because previous week’s candle is green, while the price is obviously rising on the 4H timeframe. And after the retest of the resistance line above I believe we will see a move down towards the target below at 58.36 because the pair overbought due to its proximity to the upper BB band and a bearish correction is likely.
Disclosure: I am part of Trade Nation's Influencer program and receive a monthly fee for using their TradingView charts in my analysis.
✅LIKE AND COMMENT MY IDEAS✅

CRUDE OIL (WTI): Bearish Movement After Trap
There is a high probability that Crude Oil will drop
after a false violation of an intraday resistance.
A double top pattern above that and a return
of the price below the underlined structure after
a neckline breakout give a strong signal.
I anticipate a bearish movement to 58.68
❤️Please, support my work with like, thank you!❤️

WTI/USD: Bullish Rally to 62.45?CFI:WTI is gearing up for a bullish rally on the 4-hour chart , with price rebounding from a key support zone near cumulative long liquidation levels, setting up a strong entry opportunity if buyers maintain control and push toward resistance amid recent consolidation. Entry from current levels could also be favorable with proper risk management.
Entry zone between 57.5-58.3 for a buy position. Target at 62.45 near resistance.🎯 Set a stop loss at 56.335 , offering a risk-reward ratio greater than 1:2 . 📊 Watch for confirmation with a bullish close above entry and rising volume, capitalizing on oil's volatility.🌟
Fundamentally , WTI crude has fallen to around $58.13 per barrel as of November 21, 2025, amid supply outpacing demand, but recent breakouts above $60.7 signal near-term positivity despite forecasts of further drops to $53.50-$45.00 due to OPEC+ hikes and record US output. 💡
📝 Trade Setup
🎯 Entry Zone (Long): 57.5 – 58.3
🎯 Target (TP1): 62.45
❌ Stop Loss: 56.335
⚖️ Risk-to-Reward: Greater than 1:2, offering a clean upside swing with defined invalidation.
What's your take on this setup? Drop your thoughts below! 👇

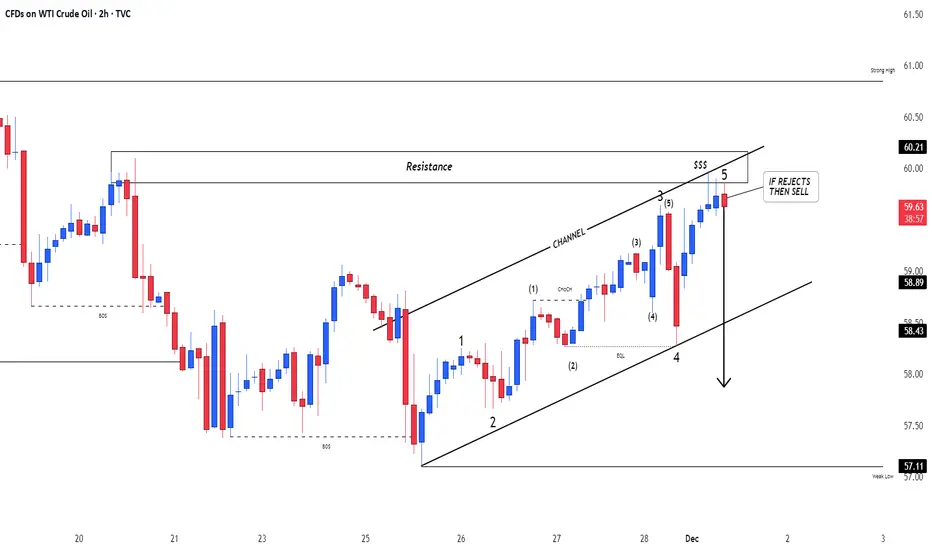
Crude OilU.S Oil
- Bullish Channel as an corrective pattern in Short Time Frame
- Resistance Level
- Change of Characteristics
- Completed " 12345 " Impulsive Waves
- Order Block
IREN Well overextended.... deeper pullback before upsideNASDAQ:IREN Price has overextended in a macro wave 3, the strongest and most powerful move described as a “wonder to behold” by Elliotticians. Novice investors are likely to get over-confident in these conditions, enter without risk management and keep chasing the price upwards only to be underwater when it turns around.
Profit taking appears to be taking place. I have closed my positions and am waiting for re-entry. The weekly pivots have been run.
Initial downside targets for wave (4) have been hit $39, the next is 0.382, $26.43. Expect shorts to pile in, adding to any downside momentum.
In the long term, we have higher to go in wave (5).
🎯 Terminal target for the business cycle could see prices as high as $124 based on daily pivots
📈 Weekly RSI hit overbought with no divergence
👉 Analysis is invalidated if we continue into price discovery
Safe trading

USOIL Set To Grow! BUY!
My dear friends,
Please, find my technical outlook for USOIL below:
The instrument tests an important psychological level 58.48
Bias - Bullish
Technical Indicators: Supper Trend gives a precise Bullish signal, while Pivot Point HL predicts price changes and potential reversals in the market.
Target - 58.94
Recommended Stop Loss - 58.19
About Used Indicators:
Super-trend indicator is more useful in trending markets where there are clear uptrends and downtrends in price.
Disclosure: I am part of Trade Nation's Influencer program and receive a monthly fee for using their TradingView charts in my analysis.
———————————
WISH YOU ALL LUCK