BRIEFING Week #38 : Waiting for Something to Happen !Here's your weekly update ! Brought to you each weekend with years of track-record history..
Don't forget to hit the like/follow button if you feel like this post deserves it ;)
That's the best way to support me and help pushing this content to other users.
Kindly,
Phil
Energy Commodities

USOIL: Market of Buyers
Looking at the chart of USOIL right now we are seeing some interesting price action on the lower timeframes. Thus a local move up seems to be quite likely.
Disclosure: I am part of Trade Nation's Influencer program and receive a monthly fee for using their TradingView charts in my analysis.
❤️ Please, support our work with like & comment! ❤️

USOIL My Opinion! BUY!
My dear subscribers,
My technical analysis for USOIL s below:
The price is coiling around a solid key level - 62.35
Bias - Bullish
Technical Indicators: Pivot Points Low anticipates a potential price reversal.
Super trend shows a clear buy, giving a perfect indicators' convergence.
Goal - 63.12
About Used Indicators:
By the very nature of the supertrend indicator, it offers firm support and resistance levels for traders to enter and exit trades. Additionally, it also provides signals for setting stop losses
Disclosure: I am part of Trade Nation's Influencer program and receive a monthly fee for using their TradingView charts in my analysis.
———————————
WISH YOU ALL LUCK

Review the crude oil movement Let’s review the crude oil movement last week. WTI prices declined amid concerns over the U.S. economy and oversupply. Traders are still assessing the Fed’s remarks regarding further interest rate cuts.
In terms of price action, crude oil maintained a volatile downward trend. There was a brief rebound at one point, but the gains were eventually erased, and prices resumed their decline. The downtrend continued through Friday, yet the key support level of 62 remained unbroken. It is expected that crude oil will stage a rebound and go up in the coming week.
Daily-updated accurate signals are at your disposal. If you run into any problems while trading, these signals serve as a reliable reference—don’t hesitate to use them! I truly hope they bring you significant assistance

Oil Market Update📢 NFX TVC:USOIL Market Update
🛢 GBEBROKERS:USOIL
📊 ECONOMICS:USCOI EIA Crude Oil Inventories – Sep 17, 2025
Actual: -9.285M
Forecast: +1.400M
Previous: +3.939M
⚡ Huge bullish surprise – sharp drawdown vs forecast.
📍 Current Price: 64.3
Holding above 200-day SMA
Trading at key resistance, but zone already weakened from repeated tests.
🔀 Implication:
Given the bullish inventory print, I now lean towards Path B → liquidity push above 64.3 toward 65.0 (38.2% Fib level) before any meaningful bearish retracement.
⚠️ Keep in mind: ECONOMICS:USINTR decision still ahead → volatility risk.

USOIL (WTI Crude Oil) Intraday & Swing Outlook🛢️ USOIL (WTI Crude Oil) Forecast – Intraday & Swing Outlook 🚀📉
Asset Class: USOIL (SPOTCRUDE / WTI CASH)
Last Closing Price: $62.796
Date/Time: 20th Sept 2025 – 12:50 AM UTC+4
🔍 Market Context
Crude oil remains in a volatile zone as macro factors like OPEC+ policy, global demand recovery, and geopolitical risks continue to steer momentum. Traders must prepare for short squeezes, traps, and breakout plays this week.
📊 Technical Overview
Chart Theories Applied:
📈 Elliott Waves – corrective Phase B nearing end.
🔄 Wyckoff – signs of re-accumulation spotted.
🔺 Head & Shoulders (Inverse) – potential bullish reversal.
🔮 Gann Angles & Time Cycle – short-term resistance clustering near $64.50.
🛠️ Indicators
🔵 RSI (H1) → Neutral zone (48–52).
📏 VWAP Anchored → $62.20 (support pivot).
📉 EMA 20 / EMA 50 → Bullish cross on H4 confirmed.
🎯 Bollinger Bands → Expansion phase → Expect high volatility.
🕒 Timeframe Strategies
📌 Intraday (5M / 15M / 1H / 4H)
Buy Entry (Scalp): $62.20 – $62.50 🟢
TP1: $63.20 🎯
TP2: $63.85 🎯
SL: $61.80 ❌
Sell Entry (Scalp): $63.80 – $64.20 🔴
TP1: $63.00 🎯
TP2: $62.40 🎯
SL: $64.70 ❌
📌 Swing (Daily / Weekly)
Buy Zone: $61.50 – $62.00 🟢
Targets: $65.20 / $67.40 / $70.00 🎯
Stop Loss: $60.50 ❌
Sell Zone (Rejection): $67.40 – $68.00 🔴
Targets: $64.50 / $62.20 🎯
Stop Loss: $68.80 ❌
⚠️ Risk Management
Volatility expected due to Fed rate guidance & OPEC+ commentary.
Stick to 2–3% capital risk per trade.
Watch for bull/bear traps near breakout zones.
📌 Summary
Intraday: Range $62.20 – $64.20 ⚖️
Swing: Upside bias if $61.50 holds strong 💹
Key Resistance: $64.50 / $67.40
Key Support: $61.50 / $60.50
🔥 Bias: Short-term sideways → Medium-term bullish above $61.50.
For individuals seeking to enhance their trading abilities based on the analyses provided, I recommend exploring the mentoring program offered by Shunya Trade. (Website: shunya dot trade)
I would appreciate your feedback on this analysis, as it will serve as a valuable resource for future endeavors.
Sincerely,
Shunya.Trade
Website: shunya dot trade

USOIL SENDS CLEAR BULLISH SIGNALS|LONG
USOIL SIGNAL
Trade Direction: short
Entry Level: 62.36
Target Level: 63.32
Stop Loss: 61.72
RISK PROFILE
Risk level: medium
Suggested risk: 1%
Timeframe: 4h
Disclosure: I am part of Trade Nation's Influencer program and receive a monthly fee for using their TradingView charts in my analysis.
✅LIKE AND COMMENT MY IDEAS✅

CRUDE OIL Rebound Ahead! Buy!
Hello,Traders!
CRUDE OIL has been ranging
For a while now and the
Price is now about to
Retest the horizontal
Support level of 61.50$
From where a local
Bullish correction is
To be expected
Buy!
Comment and subscribe to help us grow!
Check out other forecasts below too!
Disclosure: I am part of Trade Nation's Influencer program and receive a monthly fee for using their TradingView charts in my analysis.

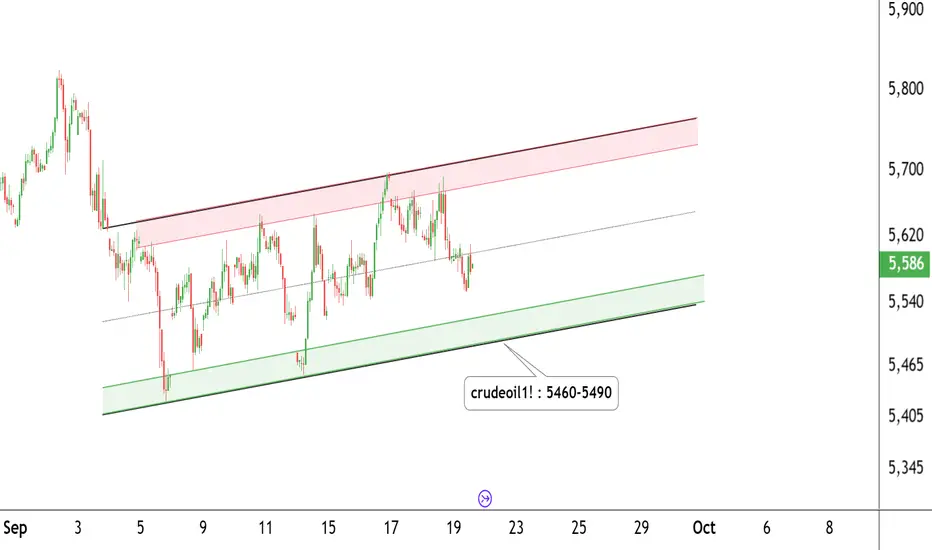
Crude Oil Trading Levels – Plan Your Move!CRUDE OIL – Daily Timeframe Update
Crude Oil is trading within a well-defined parallel channel on the daily chart.
The price is currently taking support near the 5460–5490 zone and moving within an ascending channel.
Support Zone: 5460 – 5490
Resistance Zone: 5700 – 5720
If these levels sustain, we may see higher prices ahead in Crude Oil.
Thank you!!
Natural Gas fell on bearish EIA data and cooler forecastsNatural Gas fell on bearish EIA data and cooler forecasts
October natural gas tumbled on August 18 after the EIA reported a larger-than-expected 90 bcf storage build, pushing inventories more than 200 bcf above the five-year average. XNGUSD remains under pressure from core fundamentals including supply-demand balances, weather trends, geopolitics, macro conditions, and competing fuel prices.
Further downside came as forecasts showed fewer cooling degree days over the next two weeks. Analysts warned the market is running out of time for late-summer heat to tighten balances, with October often bringing cooling demand offset by weaker heating needs.
Losses accelerated on August 18 as late-September forecasts turned cooler, reducing air-conditioning demand. Meanwhile, near-record U.S. output and elevated rig activity continue to weigh on prices.
Natural Gas Bearish News TodayNatural Gas crumbled off the inventory report this morning.
Natural gas inventories came in at 90B vs 80B consensus.
This larger than expected build shows a weaker demand for Nat Gas during this seasonal period.
Key things to consider:
1. EU moves to accelerate ban on Russian LNG.
2. New Israel–Egypt pipeline coming online
3. China continues to import from Arctic LNG‑2 despite sanctions
4. Japan’s JERA in talks to buy U.S. shale gas assets
5. Gas storage in Germany & winter supply concerns
6. Western Canada storage nearly full; supply glut
7. Canadian production at record levels, but prices very low

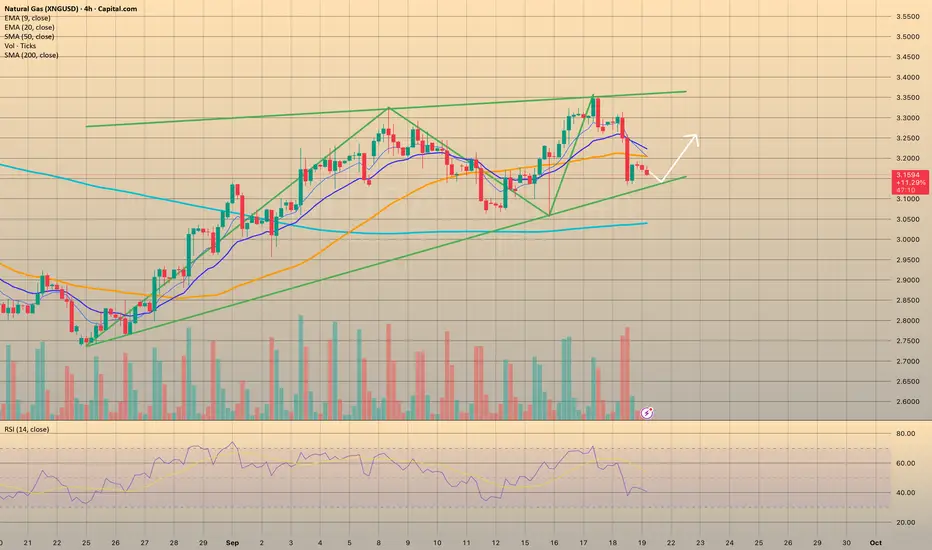
Natural Gas long setupNatural Gas long setup
Entry - 265.2
Stop loss - 263
Target - 278.3
Risk Reward - Approx 1:6

OKLO — when nuclear momentum breaks resistanceSince late 2024, OKLO had been consolidating inside a clear rectangle between $17 and $59. The breakout from this long-term range triggered a new bullish impulse. The price has since returned to retest the breakout zone, now aligned with the 0.618 Fibonacci retracement at $51.94. The retest has completed, and the price is bouncing upward, confirming buyer interest.
Technically, the trend remains firmly bullish. The price closed above the prior range, EMAs are aligned below, and the volume spike during breakout supports genuine demand. The volume profile shows a clean path toward $100, indicating limited resistance ahead. The structure suggests a controlled rally rather than an exhausted move.
Fundamentally, OKLO is a next-generation SMR (Small Modular Reactor) company focused on delivering compact, efficient nuclear power solutions. Following its public debut via SPAC and recent capital injection, OKLO is transitioning from development to implementation. Institutional interest is holding strong, and the broader move toward decarbonization and energy independence places the company in a strategic position.
Target levels:
— First target: $100 — psychological and technical resistance
— Second target: $143 — projected from prior range breakout
OKLO isn’t just another clean energy ticker — it’s a quiet disruptor with nuclear potential. The chart broke out. The volume confirmed. Now it’s time to see if the market follows through.

CRUDE OIL (WTI): Strong Bullish Confirmation?!
Update for my yesterday's idea for WTI Crude Oil.
The price retested a recently broken structure and we see a
strong bullish reaction to that today.
A bullish violation of a resistance line of a falling wedge pattern
indicates a strong buying pressure.
I think that the market will continue growing and reach 64.65 resistance soon.
❤️Please, support my work with like, thank you!❤️
I am part of Trade Nation's Influencer program and receive a monthly fee for using their TradingView charts in my analysis.

U.S. Natural Gas rises, but outlook mixedU.S. Natural Gas rises, but outlook mixed
U.S. natural gas futures climbed about 2% to an eight-week high on August 17, supported by lower daily output and stronger demand forecasts for the next two weeks. However, October contracts retreated from a one-week high on Wednesday, settling slightly lower as traders anticipated a larger-than-average build in EIA inventories.
Prices initially spiked midweek on forecasts for late-summer heat across much of the U.S., which is expected to drive up power-sector demand for air conditioning and slow inventory accumulation ahead of the winter heating season. Atmospheric G2 projected above-normal temperatures for September 22–26, with warmer conditions extending into the north-central U.S. from September 27–October 1.
On the supply side, higher U.S. production remains a headwind. The EIA last week raised its 2025 output forecast by 0.2% to 106.63 bcf/day, near record highs, with active natural gas rigs recently hitting a two-year peak.

OIL Trade Insights📲 NFX TRADE ALERT
📊 TRADE TYPE: SWING TRADE
♻ PAIR: GBEBROKERS:USOIL
⬇️ SELL AT MARKET
📝 ORDER TYPE: MARKET ORDER
👨🏻💻 ENTRY : $64.45
⭕️ SL: 65.450
✅ TP: $62.00
📝 REASONS FOR TRADE: H1 Confirmation of Price Rejection at Resistance - SR Holds📈
Multiple reversal candles spotted on H4 around supply zone, indicating weakening bullish momentum.
Pay close attention to US Inventory report later the morning.
I expect report to be bearish for oil given the high supply as seen last week.

WTI OIL This is the bigger picture.WTI Oil (USOIL) is currently on the 2nd straight green week ahead of today's Fed Rate Decision. The long-term pattern though is has been a Channel Down since August 2022 and until it gets invalidated, the trend will remain bearish.
In fact, it has made 3 emphatic rejections on the 1W MA200 (orange trend-line) since August 12 2024. The 1W RSI sequence since then, resembles the pattern of 2023, where WTI found a Higher Lows Support on the 1W MA200. The last such contact was on the 0.786 Fibonacci retracement level before a last rebound to the top of the Channel Down.
That is exactly what we are expecting now, with the new 0.786 Fib waiting at $59.50. That is our medium-term Target.
-------------------------------------------------------------------------------
** Please LIKE 👍, FOLLOW ✅, SHARE 🙌 and COMMENT ✍ if you enjoy this idea! Also share your ideas and charts in the comments section below! This is best way to keep it relevant, support us, keep the content here free and allow the idea to reach as many people as possible. **
-------------------------------------------------------------------------------
💸💸💸💸💸💸
👇 👇 👇 👇 👇 👇

Crude Oil Pivot at $65 | Break & Hold Fuels UptrendLast Sunday Opec+ agrees further oil output boost by 137K barrels per day, but less than Sep / Aug output, when market open it went higher.
How to manage short-term risk, in this case opportunity with CME Group weekly energy options on such a scheduled announcement?
Video version:
Crude Oil Futures & Options
Ticker: CL
Minimum fluctuation:
0.01 per barrel = $10.00
Disclaimer:
• What presented here is not a recommendation, please consult your licensed broker.
• Our mission is to create lateral thinking skills for every investor and trader, knowing when to take a calculated risk with market uncertainty and a bolder risk when opportunity arises.
CME Real-time Market Data help identify trading set-ups in real-time and express my market views. If you have futures in your trading portfolio, you can check out on CME Group data plans available that suit your trading needs tradingview.com/cme/

WTI: Oil Markets on Edge Despite Trump Considering Major TariffsOil prices could drop if Trump backs down on tariffs on countries buying Russian oil, but short-term bullish catalysts, like geopolitical tensions and bullish speculative bets, may still push prices up before longer-term headwinds take hold.
----------------------------------------------------------------------------------------------------------------------
Trump’s threats of steep tariffs on countries buying Russian oil have sent oil prices surging, as traders fear a global supply crunch if Russian barrels are cut off.
But here’s the twist: Trump has a history of backing down or delaying tariffs after using them as leverage. When he does, oil prices usually fall, as the immediate risk of supply disruption fades.
If he caves in again by the deadline, which is 10 to 12 days from 4 August, or extends it, oil prices could drop. The bigger picture also appears bearish: OPEC+ is ramping up supply, global demand is slowing and expected to drop in H2, and inventories are rising (first glimpse by EIA, Wed).
But with the deadline falling around 14–16 August, 2025, short-term bullish catalysts could spark a rally up to the 38.2%-61.8 % Fibonacci retracement levels, positioning WTI better for declines (conditional on Trump!).
This content is not directed to residents of the EU or UK. Any opinions, news, research, analyses, prices or other information contained on this website is provided as general market commentary and does not constitute investment advice. ThinkMarkets will not accept liability for any loss or damage including, without limitation, to any loss of profit which may arise directly or indirectly from use of or reliance on such information.

WTI falls after US slaps 50% tariff on India over Russian oilWTI oil prices have dropped from $65 to around $62.80 as markets react to new US tariffs on India, triggered by India’s ongoing oil trade with Russia. These tariffs, along with threats of even higher tariffs on China, are weighing on global demand and pushing oil prices lower. Meanwhile, Iran’s oil production has hit multi-year highs, adding more supply to the market and reinforcing the bearish trend.
Technically, oil has broken below a key Fibonacci support level, signalling a deeper pullback. If prices fall below $62, further downside toward $57 is possible. Upside moves may be short-lived unless there’s a major geopolitical shock, such as an escalation in the Russia-Ukraine conflict. For now, both the macro environment and technical signals indicate continued pressure on oil prices.
This content is not directed to residents of the EU or UK. Any opinions, news, research, analyses, prices or other information contained on this website is provided as general market commentary and does not constitute investment advice. ThinkMarkets will not accept liability for any loss or damage including, without limitation, to any loss of profit which may arise directly or indirectly from use of or reliance on such information.

CRUDE OIL (WTI): Important Breakout
Crude Oil broke and closed above a major daily horizontal resistance.
With a high probability, a broken structure turns into a potentially strong
support now.
I will expect a rise from that and a bullish continuation to 65.56 resistance.
❤️Please, support my work with like, thank you!❤️
I am part of Trade Nation's Influencer program and receive a monthly fee for using their TradingView charts in my analysis.

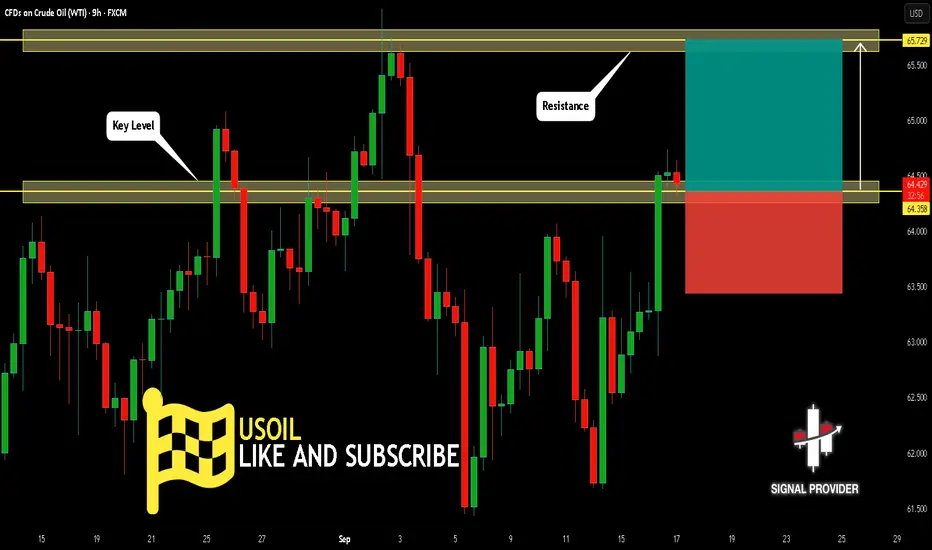
USOIL Will Grow! Long!
Take a look at our analysis for USOIL.
Time Frame: 9h
Current Trend: Bullish
Sentiment: Oversold (based on 7-period RSI)
Forecast: Bullish
The price is testing a key support 64.358.
Current market trend & oversold RSI makes me think that buyers will push the price. I will anticipate a bullish movement at least to 65.729 level.
P.S
We determine oversold/overbought condition with RSI indicator.
When it drops below 30 - the market is considered to be oversold.
When it bounces above 70 - the market is considered to be overbought.
Like and subscribe and comment my ideas if you enjoy them!
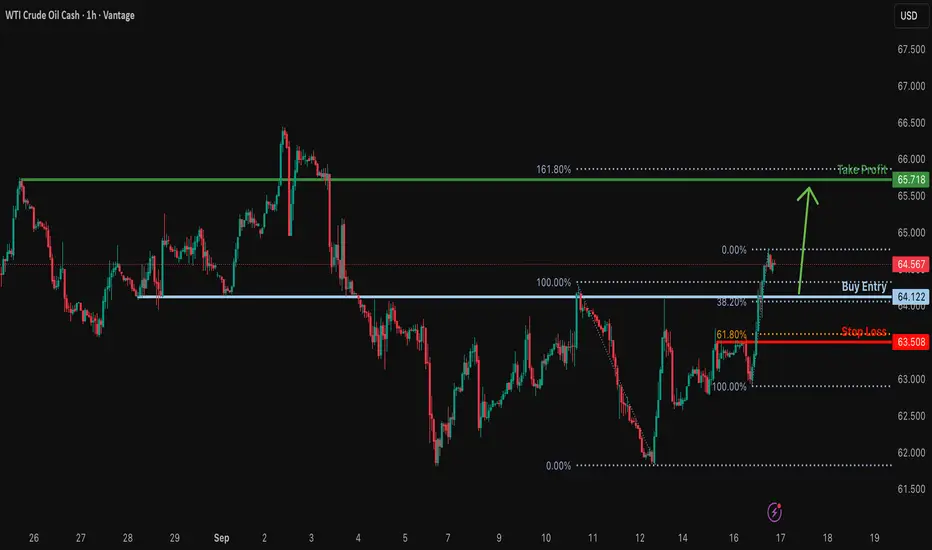
Potential bullish bounce?USO/USD is falling towards the support level, which is an overlap support that lines up with the 38.2% Fibonacci retracement and could bounce from this level to our take profit.
Entry: 64.12
Why we like it:
There is an overlap support that aligns with the 38.2% Fibonacci retracement.
Stop loss: 63.50
Why we like it:
There is a pullback support that is slightly below the 61.8% Fibonacci retracement.
Take profit: 65.71
Why we like it:
There is a pullback resistance level that is slightly below the 161.8% Fibonacci extension.
Enjoying your TradingView experience? Review us!
Please be advised that the information presented on TradingView is provided to Vantage (‘Vantage Global Limited’, ‘we’) by a third-party provider (‘Everest Fortune Group’). Please be reminded that you are solely responsible for the trading decisions on your account. There is a very high degree of risk involved in trading. Any information and/or content is intended entirely for research, educational and informational purposes only and does not constitute investment or consultation advice or investment strategy. The information is not tailored to the investment needs of any specific person and therefore does not involve a consideration of any of the investment objectives, financial situation or needs of any viewer that may receive it. Kindly also note that past performance is not a reliable indicator of future results. Actual results may differ materially from those anticipated in forward-looking or past performance statements. We assume no liability as to the accuracy or completeness of any of the information and/or content provided herein and the Company cannot be held responsible for any omission, mistake nor for any loss or damage including without limitation to any loss of profit which may arise from reliance on any information supplied by Everest Fortune Group.