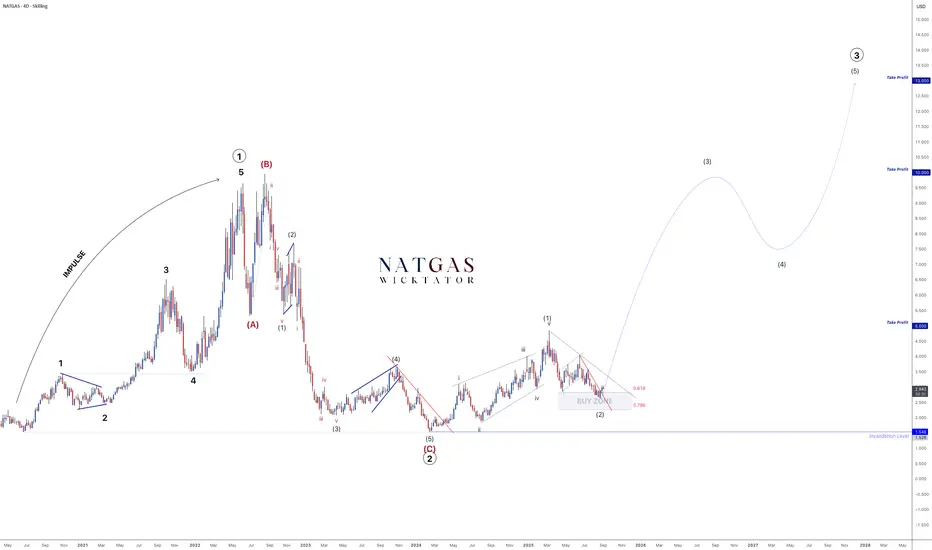
NATGAS – Wave 3 Impulse Confirmed. Multi-Year Rally Started!Our roadmap has played out with precision.
Wave 2 correction is complete, price tapped the buy zone, and the entry is now active.
We’re in the early stages of Wave 3 - historically the strongest and longest Elliott Wave.
🎯 Targets remain:
TP1: 5
TP2: 10
TP3: 13
The impulse has begun - now it’s about riding the wave.
Plan the trade. Trade the plan.
Energy Commodities

USOIL Will Explode! BUY!
My dear subscribers,
USOIL looks like it will make a good move, and here are the details:
The market is trading on 61.96 pivot level.
Bias - Bullish
Technical Indicators: Both Super Trend & Pivot HL indicate a highly probable Bullish continuation.
Target - 63.08
About Used Indicators:
The average true range (ATR) plays an important role in 'Supertrend' as the indicator uses ATR to calculate its value. The ATR indicator signals the degree of price volatility.
Disclosure: I am part of Trade Nation's Influencer program and receive a monthly fee for using their TradingView charts in my analysis.
———————————
WISH YOU ALL LUCK

USOIL Will Go Lower From Resistance! Sell!
Here is our detailed technical review for USOIL.
Time Frame: 12h
Current Trend: Bearish
Sentiment: Overbought (based on 7-period RSI)
Forecast: Bearish
The market is testing a major horizontal structure 61.941.
Taking into consideration the structure & trend analysis, I believe that the market will reach 58.529 level soon.
P.S
The term oversold refers to a condition where an asset has traded lower in price and has the potential for a price bounce.
Overbought refers to market scenarios where the instrument is traded considerably higher than its fair value. Overvaluation is caused by market sentiments when there is positive news.
Disclosure: I am part of Trade Nation's Influencer program and receive a monthly fee for using their TradingView charts in my analysis.
Like and subscribe and comment my ideas if you enjoy them!

I have a dream - OIl below $50I have a dream OIl below $50
since US strike on Iran OIl hit $76 per barral for several days
after down only
I think that trend would go on
and in a case of reaching $50 per barrel WAr in Ukraine would stop

U.S. Natural Gas holds near 4-week highU.S. Natural Gas holds near 4-week high as storage builds match forecasts
U.S. natural gas stayed near a four-week high Thursday after EIA data showed inventories rose by 55 Bcf to 3,272 Bcf for the week ending Aug. 29, in line with expectations. Stocks remain 2.2% below last year but 5.6% above the five-year average, signaling ample supply despite record LNG exports and strong demand.
Higher production, with dry gas output at 107.1 Bcf/day, continues to pressure prices, while weather forecasts calling for warmer temperatures in mid-September may support short-term demand. LNG flows hit 15 Bcf/day, near record highs, as U.S. exports remain strong amid European and Asian demand.

USOIL Is Bullish! Long!
Here is our detailed technical review for USOIL.
Time Frame: 12h
Current Trend: Bullish
Sentiment: Oversold (based on 7-period RSI)
Forecast: Bullish
The market is on a crucial zone of demand 63.116.
The oversold market condition in a combination with key structure gives us a relatively strong bullish signal with goal 65.546 level.
P.S
Please, note that an oversold/overbought condition can last for a long time, and therefore being oversold/overbought doesn't mean a price rally will come soon, or at all.
Disclosure: I am part of Trade Nation's Influencer program and receive a monthly fee for using their TradingView charts in my analysis.
Like and subscribe and comment my ideas if you enjoy them!

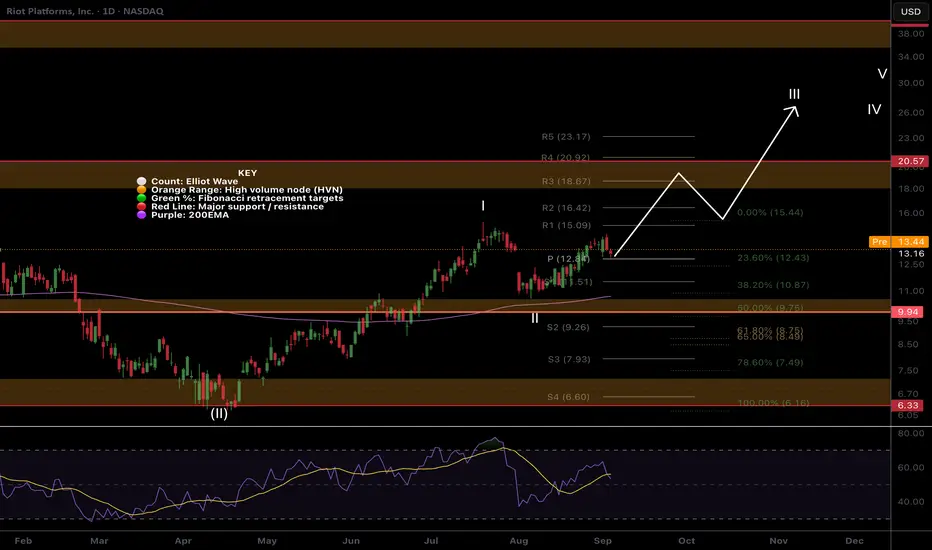
RIOT Wave 3 Begun?NASDAQ:RIOT appears to be in wave III with wave II bottoming at the High Volume Node (HVN) support and daily 200EMA.
The first target is the HVN resistance and R3 pivot at $18.67 but if the count is correct we should extend above that. RSI is sitting comfortably with room to grow.
Analysis is invalidated below wave II, $10.50.
Safe trading
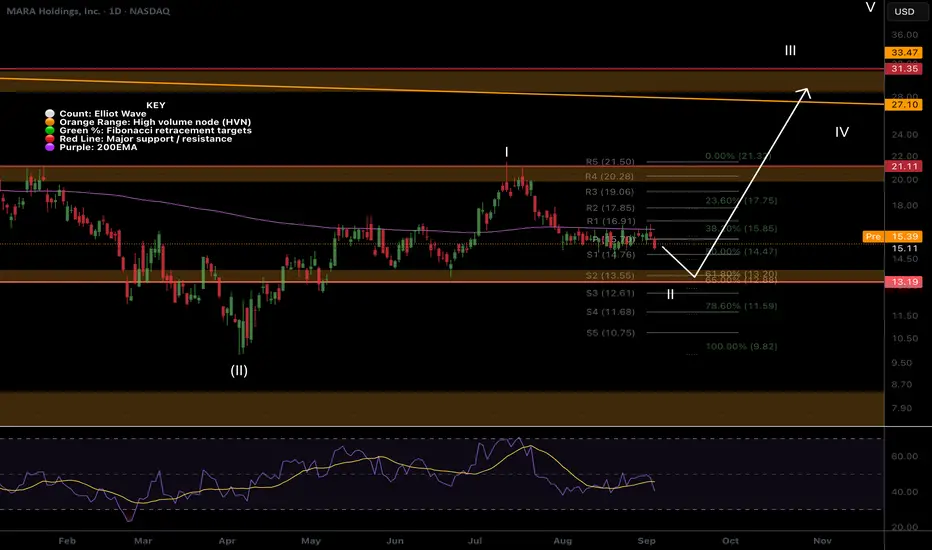
$MARA One More Push Lower to the Golden Pocket?NASDAQ:MARA was rejected hard on the 6th test of the daily 200EMA! The probability of a breakthrough is huge but it just cant overcome supply as people want out of this underperforming Bitcoin Miner! Just the recipe we need for explosive upside, capitulation.
The S2 pivot and Fibonacci golden pocket should see strong support and potential bottoming of wave II, $13.20
Daily RSI is working its way into oversold which will line up nicely for a high probability trade set up I will share in my trading signals substack.
Safe trading
IREN Bear Divergence on the Daily, Deeper Pullback Ahead?NASDAQ:IREN appears to be pulling back locally in wave 4, filling the gap, with eyes on testing the daily pivot as support before continuing higher.
Price is significantly away from mean and catching continued momentum but this will fade as more people take profit.
Bearish divergence persists in the daily RSI and has been confirmed with the close below the signal line. If these signals fail it shows the strength of the momentum trend.
Continued upside target is playing the pivots to $40 and initial downside taregt is the previous all time high at $18.50
Safe trading

USOIL BULLISH BIAS RIGHT NOW| LONG
USOIL SIGNAL
Trade Direction: long
Entry Level: 63.13
Target Level: 65.08
Stop Loss: 61.82
RISK PROFILE
Risk level: medium
Suggested risk: 1%
Timeframe: 9h
Disclosure: I am part of Trade Nation's Influencer program and receive a monthly fee for using their TradingView charts in my analysis.
✅LIKE AND COMMENT MY IDEAS✅

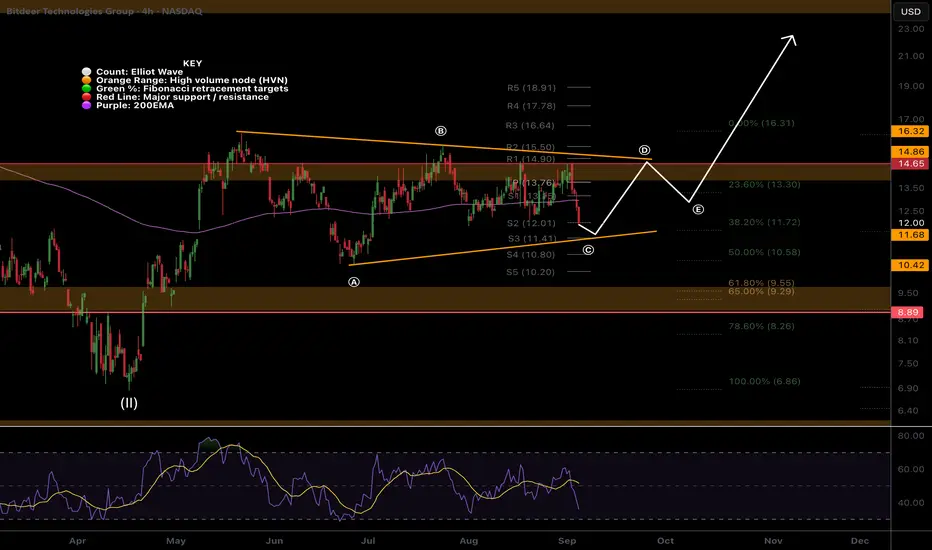
BTDR Still in a triangle, Wave c of (C) downNASDAQ:BTDR Bitdeer was rejected harshly on the 4th test of the High Volume Node (HVN) resistance, each test weakening the Node and adding probability to a breakout.
Wave c of an ABC within a triangle wave (C) appears to be underway with price closing below both the daily pivot and 200EMA. RSI has slight bullish divergence.
Until we get a break below wave (A) or a above wave (B) the analysis is good. Will readjust and update if anything changes. A breakdown below the triangle has a wave 2 target of the golden pocket Fibonacci retracement and HVN support at $9.63 and may offer a great buying opportunity.
Breakout target is the R5 daily pivot at $21.84
Safe trading
Crude oil - Potential UPThe break of breakeven must be give a push UP of price until next resistence area

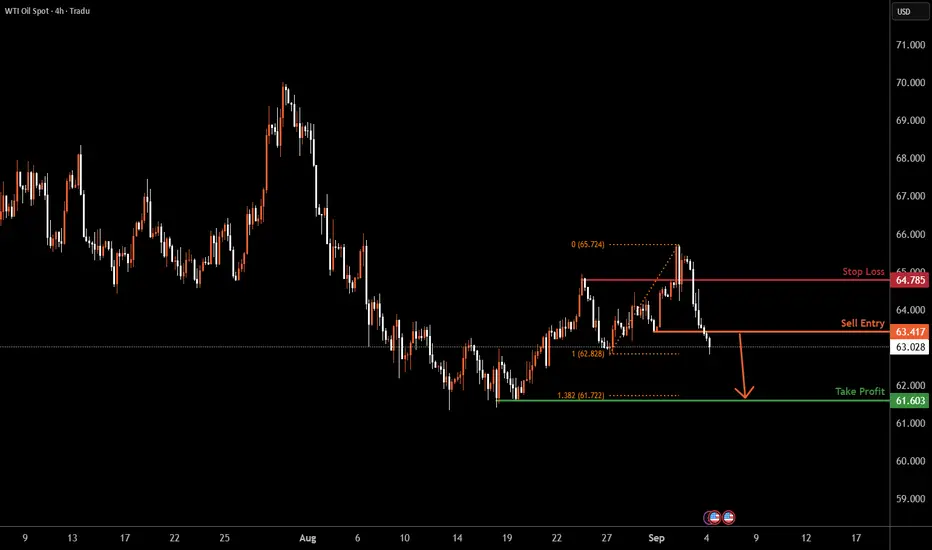
USOIL H4 | Potential bearish dropBased on the H4 chart analysis, we can see that the price has reacted off the sell entry, which is a pullback resistance and could drop from this level to the downside.
Sell entry is at 63.41, which is a pullback resistance.
Stop loss is at 64.78, which is a pullback resistance.
Take profit is at 61.60, which is a swing low support that lines up with the 138.2% Fibonacci extension.
High Risk Investment Warning
Trading Forex/CFDs on margin carries a high level of risk and may not be suitable for all investors. Leverage can work against you.
Stratos Markets Limited (tradu.com ):
CFDs are complex instruments and come with a high risk of losing money rapidly due to leverage. 65% of retail investor accounts lose money when trading CFDs with this provider. You should consider whether you understand how CFDs work and whether you can afford to take the high risk of losing your money.
Stratos Europe Ltd (tradu.com ):
CFDs are complex instruments and come with a high risk of losing money rapidly due to leverage. 66% of retail investor accounts lose money when trading CFDs with this provider. You should consider whether you understand how CFDs work and whether you can afford to take the high risk of losing your money.
Stratos Global LLC (tradu.com ):
Losses can exceed deposits.
Please be advised that the information presented on TradingView is provided to Tradu (‘Company’, ‘we’) by a third-party provider (‘TFA Global Pte Ltd’). Please be reminded that you are solely responsible for the trading decisions on your account. There is a very high degree of risk involved in trading. Any information and/or content is intended entirely for research, educational and informational purposes only and does not constitute investment or consultation advice or investment strategy. The information is not tailored to the investment needs of any specific person and therefore does not involve a consideration of any of the investment objectives, financial situation or needs of any viewer that may receive it. Kindly also note that past performance is not a reliable indicator of future results. Actual results may differ materially from those anticipated in forward-looking or past performance statements. We assume no liability as to the accuracy or completeness of any of the information and/or content provided herein and the Company cannot be held responsible for any omission, mistake nor for any loss or damage including without limitation to any loss of profit which may arise from reliance on any information supplied by TFA Global Pte Ltd.
The speaker(s) is neither an employee, agent nor representative of Tradu and is therefore acting independently. The opinions given are their own, constitute general market commentary, and do not constitute the opinion or advice of Tradu or any form of personal or investment advice. Tradu neither endorses nor guarantees offerings of third-party speakers, nor is Tradu responsible for the content, veracity or opinions of third-party speakers, presenters or participants.
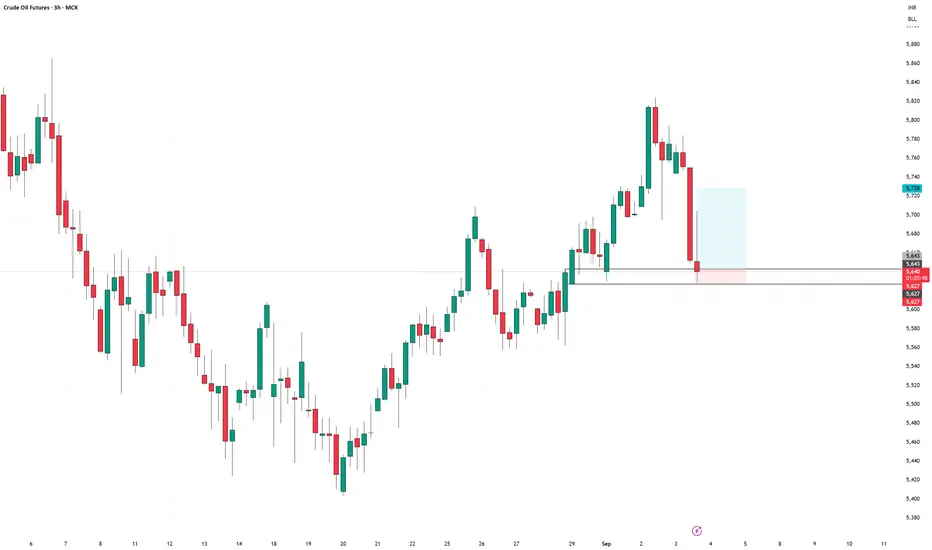
CRUDEOIL September Futures long setupCRUDEOIL September Futures long setup
Entry - 5643
Stop Loss - 5627
Target - 5728
Risk Reward - 1:5.3
WTI: weekly seller targets reached, monthly targets still lowerHi traders and investors!
This analysis is based on the Initiative Analysis concept (IA).
The sellers have reached the targets mentioned in the previous review (65.628 and 64.378).
What to expect next.
Daily timeframe
On the daily timeframe (D1) for WTI, we see a manipulation of the 65.771 level, which may indicate that the market is moving toward the monthly targets I mentioned earlier — 61.818 and 58.504.
Hourly timeframe
On the hourly timeframe (H1), this manipulation appeared as a false breakout of the upper boundary of a sideways range. The range boundaries are clearly defined: the upper boundary at 65.771 and the lower boundary at 63.580.
Wishing you profitable trades!

Natural Gas Surging into Key Moving AverageNatural gas has tagged near term resistance.
We have trimmed and locked in profits on many of the equity trades and the boil trade that we were long.
The entire commodity complex minus oil has been very strong.
Inventory report is tomorrow at 10:30am.
Let see if Nat gas can continue its bullish ascent.
Dont forget to trim profits along the way.

BUY USOILBeen a while since I last shared a trade to take, but today as you can see, the market grabbed the LQ to give us an entry point to take for a long trade.
Follow for more!

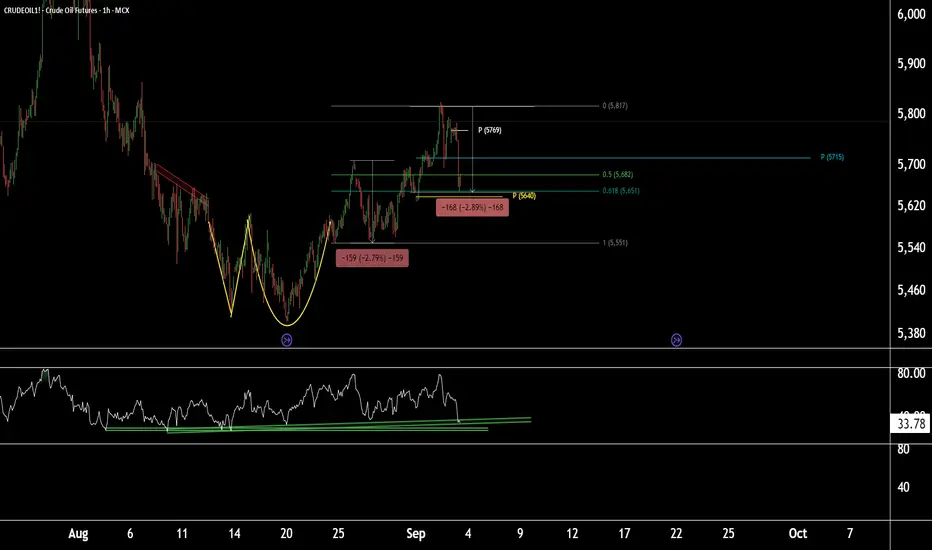
Price action + RSI support = fresh buy opportunity in CrudeOil1!CrudeOil1! (1-Hour Timeframe) Technical Outlook
CrudeOil1! is currently sustaining at the Fibonacci Golden Ratio level of 0.618, with the weekly pivot placed near 5640. Based on Fibonacci projections and price action, this 5640 zone appears to be a crucial area, as it aligns with a 2.8% retracement completion.
On the 1-hour timeframe, the RSI is showing a decline but may take support near the current levels, adding further weight to this support zone.
All technical indicators together suggest that the 5640–5650 zone could act as a strong support in the short term. If this support holds, we may see upside targets at 5715 and 5750, with the potential for CrudeOil1! to make a new high if the bullish momentum continues.
Thank you.
WTI OIL Short-term Channel Up 4H MA50 buy opportunity.Last week (August 26, see chart below) we caught the absolute low with our WTI Oil (USOIL) buy signal, hitting our $66.30 Target shortly after:
This time we have another buy signal on the short-term as the Channel Up that emerged has pulled-back all the way to its 4H MA50 (blue trend-line).
The last 3 times it did so, it was a buy opportunity. Assuming this is another Higher Low bottom, the new Bullish Leg that is about to be initiated, should aim for the 1.382 Fibonacci extension, similar to what the previous two did.
This gives us a $66.75 Target for the short-term.
-------------------------------------------------------------------------------
** Please LIKE 👍, FOLLOW ✅, SHARE 🙌 and COMMENT ✍ if you enjoy this idea! Also share your ideas and charts in the comments section below! This is best way to keep it relevant, support us, keep the content here free and allow the idea to reach as many people as possible. **
-------------------------------------------------------------------------------
💸💸💸💸💸💸
👇 👇 👇 👇 👇 👇

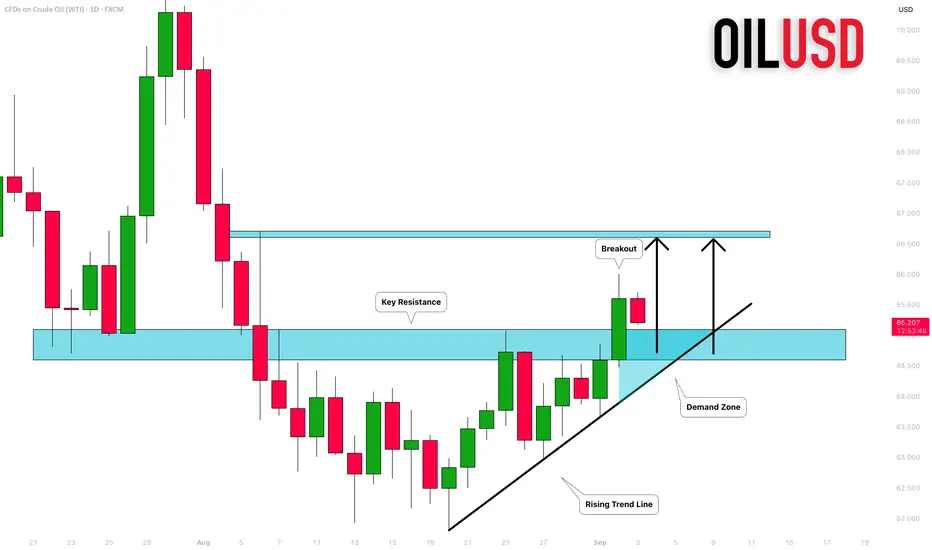
CRUDE OIL (WTI): Important Breakout!
With a strong bullish rally, WTI Crude Oil violated a significant
daily resistance cluster yesterday.
The broken structure and a rising trend line compose an important
demand zone now.
I will expect a bullish continuation from that.
Next resistance - 66.6
❤️Please, support my work with like, thank you!❤️
Is usoil still bullish?
Hi my dears
How are you?
Usoil seems to have the potential to move higher. I think it has the potential to reach $65.80 in the coming weeks if and only if the conditions in the picture are met.
What do you think?
Check out my analysis.

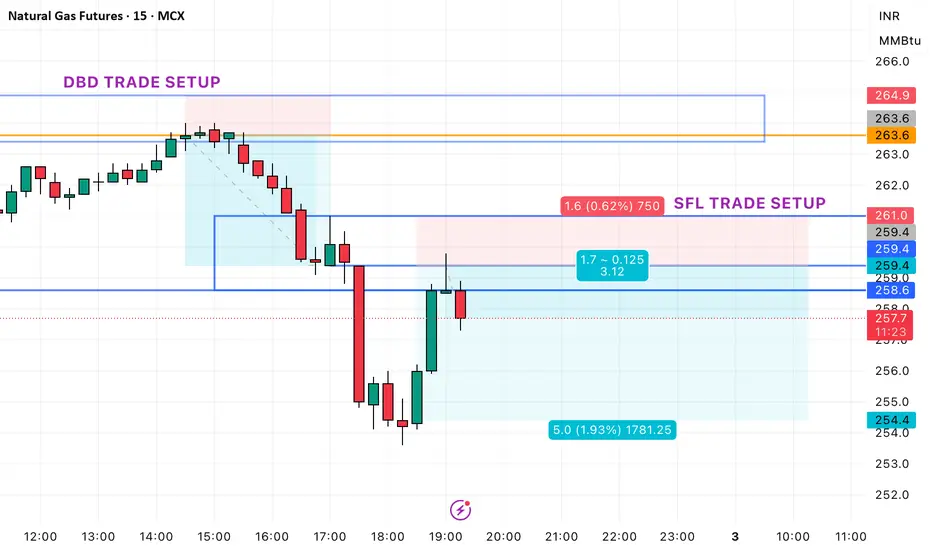
Natural Gas September short setupNatural Gas Short Setup
Entry - 259.4
SL - 261
TGT - 254.2
Risk Reward - 1:3.12