Natural Gas | | Oil | Dollar | Silver | Gold Price ForecastNatural Gas | | Oil | Dollar | Silver | Gold Price Forecast
NYMEX:NG1! NYMEX:CL1! COMEX:GC1! COMEX:SI1!
Energy Commodities

BRIEFING Week #48 : Monthly Hanging ManHere's your weekly update ! Brought to you each weekend with years of track-record history..
Don't forget to hit the like/follow button if you feel like this post deserves it ;)
That's the best way to support me and help pushing this content to other users.
Kindly,
Phil

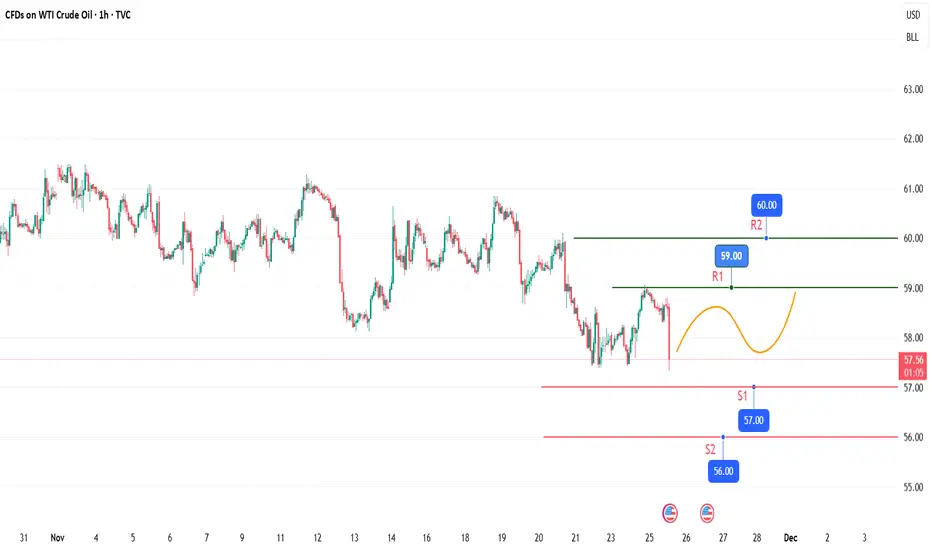
USOIL H1 | Bearish Reversal Off key ResistanceMomentum: Bearish
The price is rising towards the sell entry, which aligns with the 61.8% Fibonacci projection.
Sell entry: 59.31
Pullback resistance
61.8% Fibonacci projection
Stop loss: 60.03
Pullback resistance
145% Fibonacci extension
Take profit: 58.16
Pullback support
High Risk Investment Warning
Stratos Markets Limited (tradu.com ), Stratos Europe Ltd (tradu.com ):
CFDs are complex instruments and come with a high risk of losing money rapidly due to leverage. 70% of retail investor accounts lose money when trading CFDs with this provider. You should consider whether you understand how CFDs work and whether you can afford to take the high risk of losing your money.
Stratos Global LLC (tradu.com ): Losses can exceed deposits.
Please be advised that the information presented on TradingView is provided to Tradu (‘Company’, ‘we’) by a third-party provider (‘TFA Global Pte Ltd’). Please be reminded that you are solely responsible for the trading decisions on your account. Any information and/or content is intended entirely for research, educational and informational purposes only and does not constitute investment or consultation advice or investment strategy. The information is not tailored to the investment needs of any specific person and therefore does not involve a consideration of any of the investment objectives, financial situation or needs of any viewer that may receive it. Past performance is not a reliable indicator of future results. Actual results may differ materially from those anticipated in forward-looking or past performance statements. We assume no liability as to the accuracy or completeness of any of the information and/or content provided herein and the Company cannot be held responsible for any omission, mistake nor for any loss or damage including without limitation to any loss of profit which may arise from reliance on any information supplied by TFA Global Pte Ltd.

Weekly USOIL Trend SummaryOverall, USOIL oscillated at a low level with a slight upward trend during the period from November 24 to November 28, 2025. Despite minor fluctuations of gains and losses throughout the week, it hovered around $59 per barrel and failed to break free from the consecutive monthly decline trend that began this month. The specific trend is detailed in segments as follows:
1.Modest Gain at Week's Start with Synchronous Weakening Price Spread (November 24)
USOIL kicked off the week with a slight upturn. It closed at $58.89 per barrel that day, rising $0.91 or 1.57% compared with the previous week's closing price of $57.98 per barrel.
2.Oscillating Consolidation in Mid-Week, with Gains Constrained by Oversupply Expectations (November 25 - 26)
On November 25, oil prices traded sideways, hovering around $58.77 per barrel with a slight drop of approximately 0.91%.
On November 26, the market rebounded, and the growth rate of the relevant oil and gas index expanded to 0.87%. Oil prices followed suit with an upward movement. However, they failed to break through the earlier oscillating range overall. Meanwhile, potential incremental pressure on the supply side left the oil price rally lacking strong momentum.
3.Minor Fluctuations at Week's End Awaiting Policy Signals (November 27 - 28)
On November 27, oil prices pulled back slightly, and the corresponding oil and gas index edged down by 0.08%. After encountering resistance near $59 per barrel, oil prices retreated moderately. Market sentiment turned increasingly cautious as investors focused on the OPEC+ production policy meeting scheduled for Sunday.
On November 28, oil prices inched up again, and the oil and gas index rose by 0.67%, hitting a weekly closing high of 309.33 points.
Overall, although USOIL recorded a slight increase this week, it remained trapped in a low - range. Moreover, this month marks its fourth consecutive monthly decline, the longest losing streak since 2023. The main bearish factors weighing on oil prices include the expected lifting of sanctions on Russian oil driven by progress in the Ukraine peace talks and weak demand caused by the unexpected growth in U.S. crude oil inventories. Conversely, expectations of interest rate cuts by the Federal Reserve have provided some support for oil prices. Going forward, the production decisions of OPEC+ and changes in the geopolitical landscape will be the key factors determining the future trend of oil prices.
DVN | Strong Oil & Nat Gas Producer About to Pop | LONGDevon Energy Corp. engages in the exploration, development, and production of oil and natural gas properties. It develops and operates Delaware Basin, Eagle Ford, Heavy Oil, Barnett Shale, STACK, and Rockies Oil. The company was founded by J. Larry Nichols and John W. Nichols in 1971 and is headquartered in Oklahoma City, OK.

USOIL : Don't be fooledHello friends
Well, you see that we have a descending channel that has hit the ceiling twice and the ceiling three times.
Well, in the third encounter with the bottom or support, you see that the buyers provided good support for the price and pushed it up and broke our medium-term ceiling. Now, if the breakdown is confirmed, the price will go to the ceiling of the channel and from there, a price correction can be expected.
The specified range is very important for a sell trade. Why?
Because there are many orders here, if the price reaches this area, it will inevitably correct. And there is another reason that we have, and the most important reason is that our trend is down and we should not open a trade against the trend.
This analysis is technically reviewed and is not a recommendation to buy or sell.
Avoid emotional behavior and observe capital management.
*Trade safely with us*

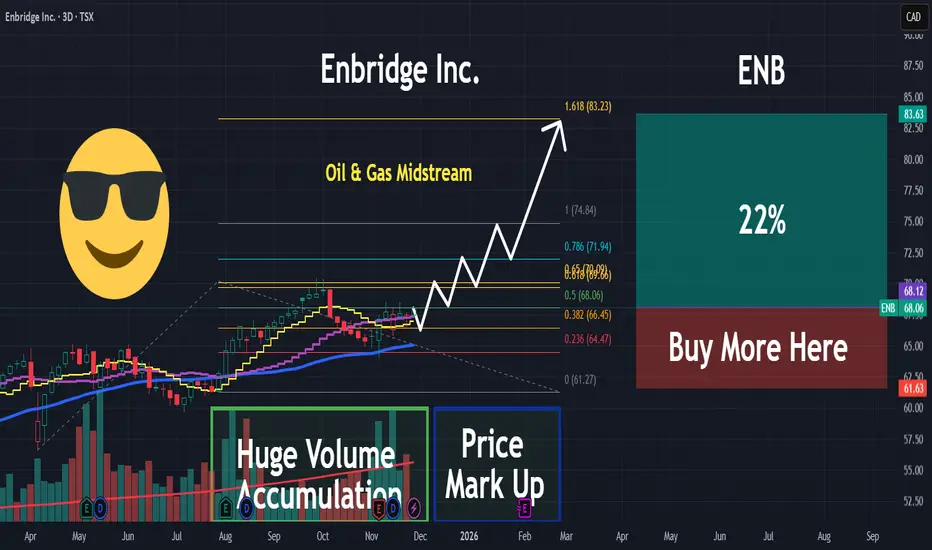
ENB | Natural Gas Producer on the Rise | LONGEnbridge, Inc. engages in the provision of gas and oil. It operates through the following segments: Liquid Pipelines, Gas Distribution and Storage, Gas Transmission and Midstream, Renewable Power Generation, and Energy Services. The Liquids Pipelines segment consists of common carrier and contract crude oil, natural gas liquids and refined products pipelines and terminals in Canada and the U.S., including Canadian Mainline, Regional Oil Sands System, Southern Lights Pipeline, Spearhead Pipeline, Seaway Crude Pipeline interest, and other feeder pipelines. The Gas Distribution & Storage segment consists of natural gas utility operations, the core of which is Enbridge gas, which serves residential, commercial and industrial customers. It also includes natural gas distribution activities in Quebec and an investment in Noverco, which holds a majority interest in a subsidiary entity engaged in distribution and energy transportation primarily in Quebec. The Gas Transmission & Midstream segment consists of investments in natural gas pipelines, processing and green energy projects, the company's commodity marketing businesses, and international activities. The Renewable Power Generation segment consists primarily of investments in wind and solar power generating assets, as well as geothermal, waste heat recovery, and transmission assets. The Energy Services segment consists of businesses in Canada and the United States including logistical services, refinery supply services and the firm's volume commitments on various pipeline systems. The company was founded on April 30, 1949 and is headquartered in Calgary, Canada.
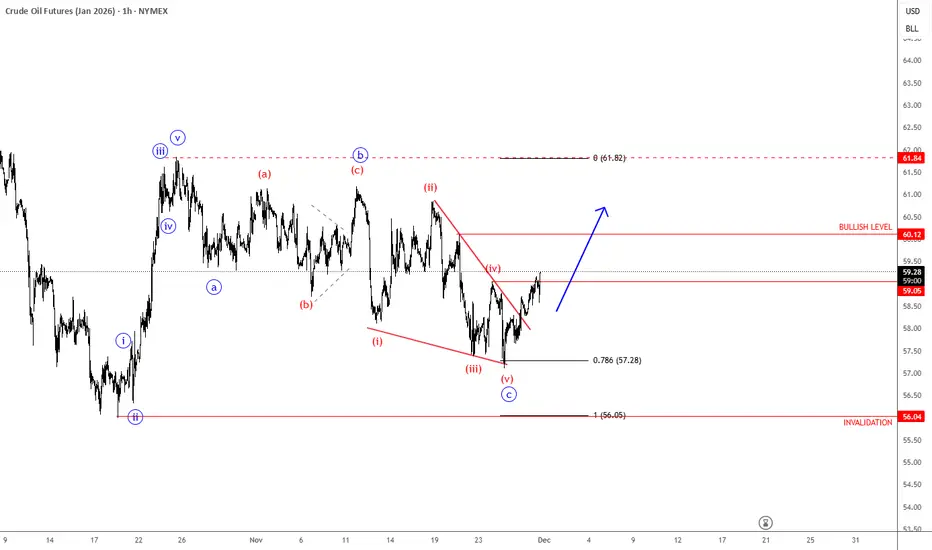
Crude Oil Has Finally Finished An Intraday Corrective SetbackCrude oil made a very strong rebound back in mid-October with an impulsive move of more than 11%, while the current retracement from 62 is very slow, which still suggests a counter-trend movement despite the weakness now retesting the 78.6% support levels. We can still see three waves down, and ideally subwave c is coming into a potential support zone, so a rebound can still happen while the market trades above 55.96 invalidation.
Looks like Crude oil is finally on the way back to October highs, as we see a sharp and impulsive rebound from the 78,6% Fibonacci retracement after a completed wedge pattern. So be aware of more intraday gians, especially if breaks back above 60 level, just watch out for pullbacks.
WTI🌎 Major investment banks forecast two stages for oil: a decline due to oversupply, followed by growth from 2027 due to a lack of investment.
After 2027: A prolonged growth period will begin due to a shortage of raw materials.
A gradual, slow decline in oil prices is observed.
We are near a support level, a break of which could accelerate the decline in prices.

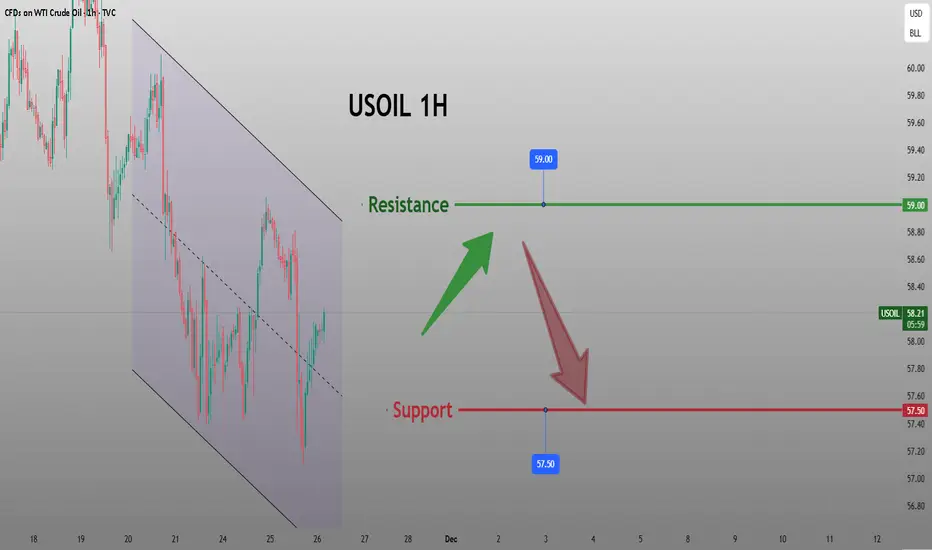
USOIL Will Go Lower From Resistance! Sell!
Take a look at our analysis for USOIL.
Time Frame: 4h
Current Trend: Bearish
Sentiment: Overbought (based on 7-period RSI)
Forecast: Bearish
The price is testing a key resistance 59.046.
Taking into consideration the current market trend & overbought RSI, chances will be high to see a bearish movement to the downside at least to 58.167 level.
P.S
Please, note that an oversold/overbought condition can last for a long time, and therefore being oversold/overbought doesn't mean a price rally will come soon, or at all.
Like and subscribe and comment my ideas if you enjoy them!

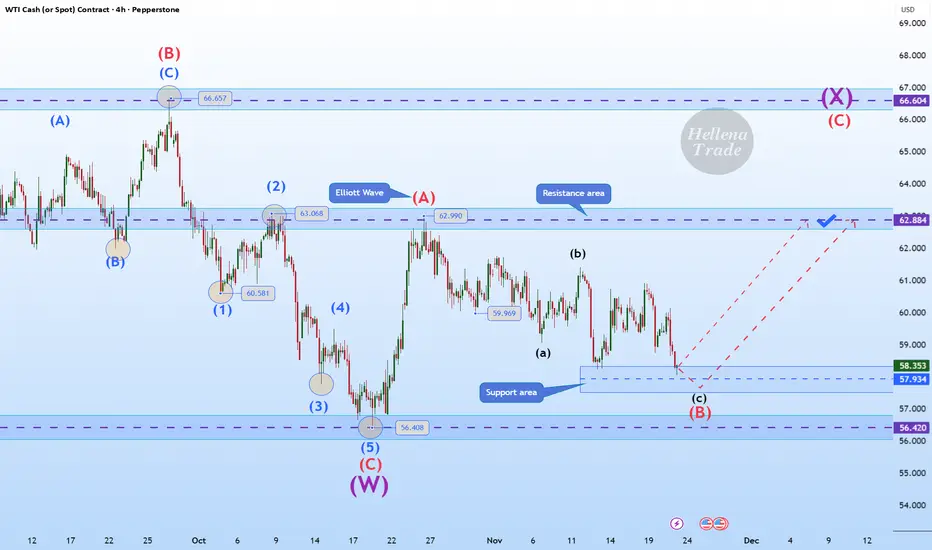
Hellena | Oil (4H): LONG to the area of the maximum of wave “A”.Colleagues, the past forecast has not been canceled, but I see some changes and therefore feel it is necessary to make a fresh forecast.
Apparently, the corrective wave “B” has extended to the area of 57.930. This is quite close to the low of wave “C” at 56.408 and the price should not update it, otherwise there will be a full-fledged break of the structure.
In connection with the above, I think that the price is already completing the downward movement and I expect the resumption of the upward movement at least to the area of the maximum of wave “A” - 62.990.
Manage your capital correctly and competently! Only enter trades based on reliable patterns!
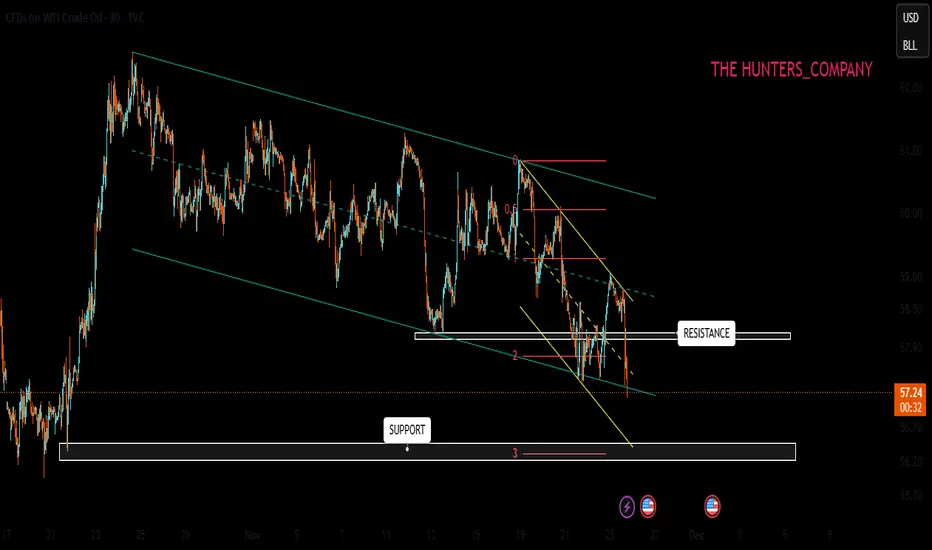
USOIL : Full analysisHello friends
Well, you see that we have a descending channel in which the price is moving, and considering that the price reached the ceiling of the channel, we had a Sharpe decline, and now it seems that the sellers want to break the channel, and the first support identified could be the buyers' stronghold, where we need to see if they support the price or not.
If they support, there is a significant resistance in their way. This area is full of sell orders and can naturally correct the price. In this regard, breaking this resistance is very important and vital for price growth.
Now what if the buyers cannot support the price in the support area and the price falls further?
Well, we need to find areas again for a sell trade because if the descending channel is broken, the fall will be heavier and it is better to move with the trend.
This analysis is purely technical and is not a buy or sell recommendation.
*Trade safely with us*
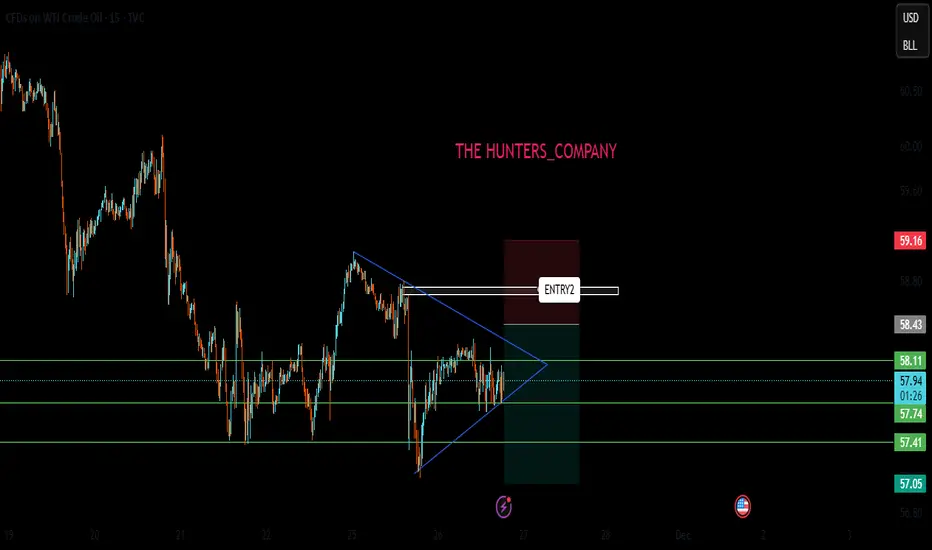
USOIL : LIVE TRADE
Hello friends
Well, considering the downtrend and the power of the sellers, we should also follow the trend and go to the side of the one who has the power.
Given the price drop, if the price pullbacks, we can see the price drop again.
This post is not a buy or sell offer and is only reviewed from a technical perspective.
Observe risk and capital management and avoid emotional movements.
*Trade safely with us*
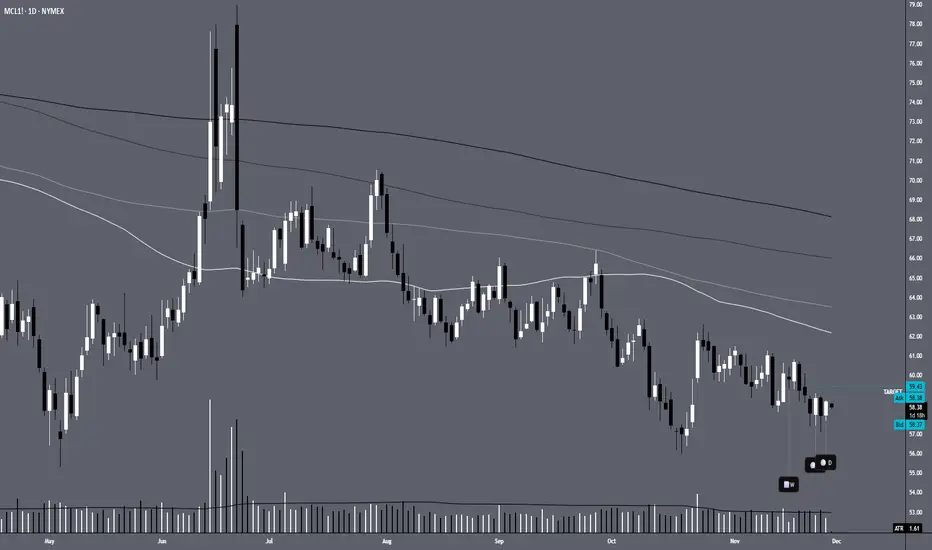
MCL1!Price is currently underneath the quarter's mark. Testing a support zone. Price could retest the November resistance zone.
BRENT OIL ANALYSIS - Nov 22 - is this the bottom?BRENT OIL - Weekly Outlook
Current Price: 62.39
Context: At BOTTOM of recent range (61.80-65.00). Bouncing off weekly lows. Range-bound after multi-week decline.
Bias: NEUTRAL-to-BEARISH (range trade until breakout)
TRADE IDEAS FOR NEXT WEEK
SETUP 1: LONG from Support (most current opportunity)
Entry: 62.00-62.50 (preferably after sweep of prev. week's low)
Stop Loss: 61.50
TP1: 63.50 (partial - 40%)
TP2: 64.50 (partial - 40%)
TP3: 65.00 (final - 20%)
Logic: Price at support, oversold on daily. Range trade targeting middle/top of range.
Pros: At support, good R:R, clear levels
Cons: Oil fundamentals weak, could break lower
SETUP 2: SHORT from Resistance (HIGH PROBABILITY)
Entry: 64.50-65.20
Stop Loss: 66.50
TP1: 63.50 (30%)
TP2: 62.00 (40%)
TP3: 60.50 (30%)
Logic: Resistance zone rejection. Range top. Downtrend bias continues.
Pros: High R:R, higher timeframe trend continuation, clear rejection zone
Cons: Need to wait for rally first
KEY LEVELS
Support Zones:
61.80-62.00 ← Weekly low (CRITICAL support - holding NOW)
60.50-61.00 ← Next major support if breakdown
42-45 ← Long-term support
Resistance Zones:
63.00-63.50 ← Immediate resistance
64.50-65.20 ← Weekly high / major resistance
66.50-67.00 ← Next resistance if breakout

USOIL FREE SIGNAL|SHORT|
✅WTI OIL is returning into the higher-timeframe supply after clearing buy-side liquidity, signaling distribution. If rejection confirms, bearish displacement could drive price toward the sell-side liquidity target below.
—————————
Entry: 58.70$
Stop Loss: 59.00$
Take Profit: 58.12$
Time Frame: 3H
—————————
SHORT🔥
✅Like and subscribe to never miss a new idea!✅

WTI Crude Holds at Its Lowest Levels of the YearWTI crude oil continues to show a steady bearish bias below the 60-dollar area in the short term. For now, selling pressure has remained firm, while recent comments regarding the military conflict between Ukraine and Russia point to an increase in reinforcements aimed at achieving a possible ceasefire. Such a scenario could reduce the economic sanctions currently imposed on Russia and, over time, become an important factor that drives a stronger-than-expected recovery in global crude production. This backdrop has kept confidence in the price of the barrel limited, reinforcing a persistent bearish tone that could continue if an official ceasefire is eventually reached.
Medium-Term Trend Remains Firm:
During the second half of the year, the prevailing bearish movements in WTI have maintained a perspective aligned with a solid medium-term downward trendline. So far, no meaningful buying corrections have appeared that could threaten this bearish structure in recent weeks, making it likely that this formation will continue to dominate most price movements in the medium term—especially if the market continues to trade below the 50-period simple moving average.
Neutrality Begins to Emerge in Indicators:
At the moment, both the RSI line and the MACD histogram remain oscillating within the neutral range of their respective indicators. This suggests that, in the short term, both the average selling and buying impulses and the directional strength of the moving averages remain in a neutral and indecisive zone, which can partly be explained by the price interacting with important support areas. What matters here is that as long as both indicators maintain this neutral stance, they could open the door for potential bullish corrections to develop in the coming sessions.
Key Levels to Watch:
60 dollars: This is the main resistance on the chart, aligned with the current downward trendline, the barrier marked by the 50-period moving average, and the 23.6% Fibonacci retracement level. Buying moves that manage to break above this area could trigger a break of the bearish trend, potentially activating a more constructive bullish tone.
58 dollars: This level corresponds to the most recent zone of indecision and could become the reference area to monitor if bullish corrections begin to form within current price movements.
57 dollars: This marks the lowest level of the year and stands as the most relevant bearish barrier at the moment. Selling moves that break below this level could open the door to a more aggressive bearish bias, extending the current downward trend even further.
Written by Julian Pineda, CFA, CMT - Market Analyst

Analysis of Core Factors in the Short-Term Oil MarketSupply Side: The oversupply situation has become a consensus, and the geo-political support has failed
- Global supply remains consistently tight: The OPEC report in November adjusted the global oil situation to be in an oversupply state. The current daily production exceeds demand by 500,000 barrels, while the previous month's estimate was a shortage of 400,000 barrels. The IEA has continuously raised the expected global crude oil supply surplus for six consecutive months, and it is predicted that in 2026, there will be a record-breaking surplus of nearly 4 million barrels per day. At the same time, the supply increase in the United States is significant. As of the week of November 21, the total number of oil drilling rigs in the United States increased to 419. The Trump administration also plans to open new drilling areas in the west coast and the Arctic. Additionally, although OPEC+ has suspended production increases in the first quarter of next year, the overall supply growth trend remains strong, making it difficult to change the oversupply situation.
- Geopolitical risks have marginally eased: There have been signals of peace talks in the Ukraine conflict. US officials stated that Ukraine has agreed to the terms of the peace agreement, with only some details yet to be finalized. Zelensky expects to "as soon as possible" visit the United States to advance the agreement. This news has weakened the geopolitical risk premium for oil. Although Russian refineries and export ports have been attacked multiple times recently, Russia can buffer through methods such as temporary storage in floating tanks, and the short-term export pressure is limited, making it difficult to have a substantive impact on supply.
Crude Oil Strategy Analysis
sell:58.5-59
tp:58-57.5
sl:59.5
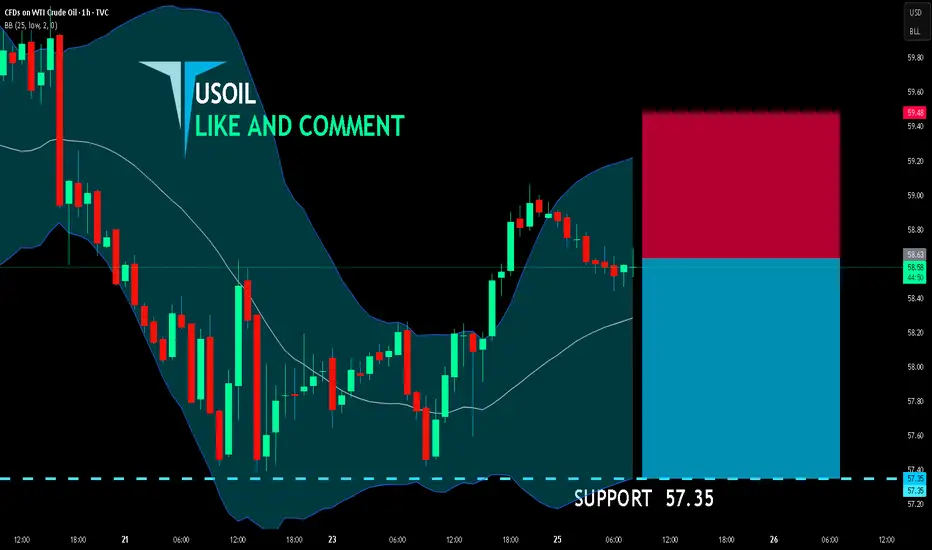
USOIL BEARS ARE GAINING STRENGTH|SHORT
USOIL SIGNAL
Trade Direction: short
Entry Level: 58.63
Target Level: 57.35
Stop Loss: 59.48
RISK PROFILE
Risk level: medium
Suggested risk: 1%
Timeframe: 1h
Disclosure: I am part of Trade Nation's Influencer program and receive a monthly fee for using their TradingView charts in my analysis.
✅LIKE AND COMMENT MY IDEAS✅
Will SPX Make New All Time Highs? We dive into the recent technical setup of the S&P500.
We are on the verge of triggering a new massive bullish patterns.
The backdrop of soft commodities. soft yields, softer dollar and the December 10 rate cute.
We have the tailwinds in place for higher price.
I would like to see some sideways chop to make this rally more sustainable, but bull market bounces are very fierce especially when they come from failed bearish patterns.

Crude oil off earlier lows but pressure remainsCrude oil has bounced off its earlier lows, thanks to a risk-on session in the stock markets. But oil's underlying trend remains bearish. Earlier saw Brent sliding to just below the $61 level—its lowest point this week, before stalling.
Oil’s latest decline kicked off after reports suggested that Ukraine has agreed to the outline of a potential peace deal with Russia. Now, nothing is signed yet—there’s still a lot of negotiation left - but markets reacted immediately.
So why did oil prices fall? Well partly because peace in the Ukraine-Russia conflict could mean sanctions on Russia may eventually be eased, and that could bring more Russian supply back into a global oil market that’s already pretty well-supplied. More supply equals more downward pressure on prices.
From a technical perspective, the chart of oil tells you everything you need to know. As shown by the daily chart of Brent, crude oil continues to print lower lows and lower highs, which is classic downtrend behaviour.
The key level to watch right now is $61 per barrel, a major support zone. If Brent breaks below that, then $60 is potentially the next target, followed by $58.25, which was the low back in April.
Unless something changes fundamentally, we could easily see a continuation of the current downtrend in the days and weeks ahead.
By Fawad Razaqzada, market analyst with FOREX.com

Breaking: CETY Secures $10 Mln Battery Energy Storage ProjectClean Energy Technologies, Inc. (NASDAQ; NASDAQ:CETY ) has spike 80% gearing for a move to the $30 resistant if the stock should break through the 61.8% Fib retracement level.
The RSI is at 54, giving room for massive upside as buyers step in.
In another news, Clean Energy Technologies, Inc. (Nasdaq: CETY) today announced that it has secured a $10 million Battery Energy Storage System (BESS) project in New York State. This award represents the Company’s largest storage project to date and marks the first of several similar, either front of the meter or behind the meter, BESS deployments across New York State CETY expects to finalize in the months ahead.
The New York project includes the deployment of a 5MW / 20MWh standalone energy storage system, designed to support grid reliability, peak-shaving, and market participation under New York’s Value of Distributed Energy Resources (VDER) program and ancillary grid services markets. The site has the opportunity to increase energy storage capacity to the maximum 20MW/80MWh storage permitted for such locations, subject to grid interconnection availability.
About CETY
Clean Energy Technologies, Inc. designs, produces, and markets clean energy products and integrated solutions that focuses on energy efficiency and renewable energy in the United States and internationally. It operates through four segments: Clean Energy HRS & CETY Europe, CETY Renewables Waste to Energy Solutions, Engineering and Manufacturing Business, and CETY HK. The company offers Clean Cycle generator, which captures wasted heat energy and produce electricity.

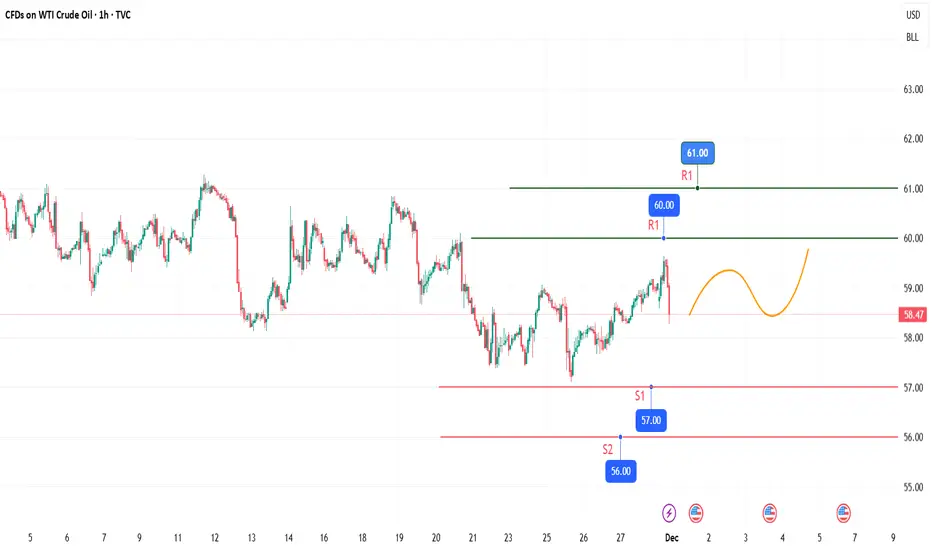
USOIL trades with a weak oscillatory biasUSOIL is exhibiting a weak oscillatory downward trend today. Despite a slight rebound yesterday, affected by bearish news and technical pressure, the intraday upside momentum remains insufficient, with bearish momentum gradually emerging. Overall, it shows a sluggish pattern of a quick pullback after the rebound.
For the upside, focus on the short-term resistance zone of $59.5 - $60.5 per barrel, among which $59.5 per barrel can be regarded as a key watershed. On the downside, closely monitor the support range of $57.0 - $57.5 per barrel. If this zone is effectively broken down, the price may further decline to around $56 per barrel.
Sell 59 - 59.7
SL 60.1
TP 57.5 - 57 - 56.5