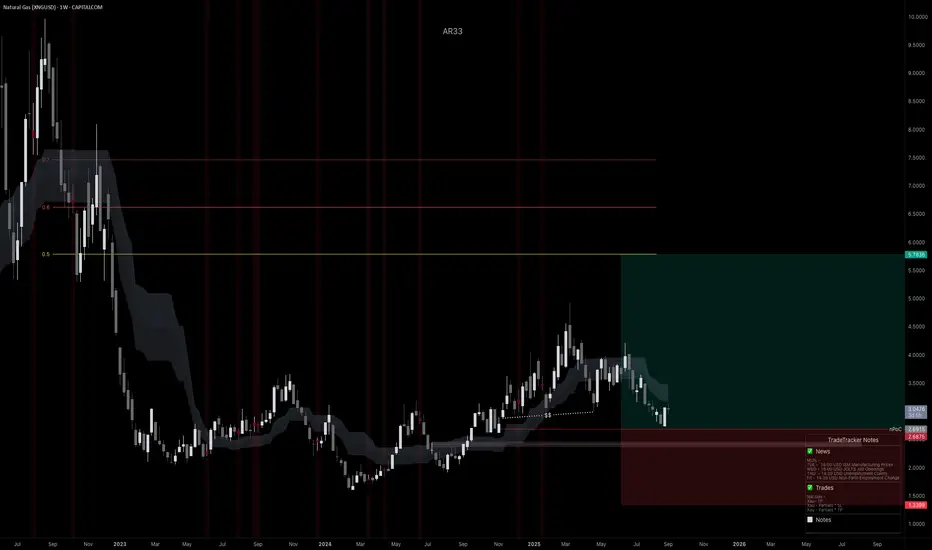
XNGUSD, Accumulation to Expansion? Weekly Long Into Winter RiskI’ve initiated a long on Natural Gas from weekly structure. Price has rotated inside this area since ’23 and is now reacting at a confluence of trendline support + prior demand. The plan is to hold into Q4, when seasonality (heating demand + potential hurricane/LNG disruptions) often provides upside tailwinds. Risk is defined on the weekly chart; I’ll manage around swings and let the position work.
Technicals (Weekly)
• Range base reclaimed: Price is bouncing from the same 2023–2024 accumulation zone (roughly 2.5–3.0).
• Multi-touch trendline support: Current candle is reacting at the rising base trendline; wicks show responsive buying.
• Structure targets: First objective is a move back into mid-range supply; extension aims toward the upper band shown on the chart.
Fundamentals Supporting Long Bias
• Seasonality: Q4 typically brings rising Heating Degree Days across the Northern Hemisphere; winter risk premia often get priced ahead of the draw season.
• LNG pull: Ongoing ramp in global LNG demand + incremental U.S. export capacity tends to tighten the domestic balance on cold forecasts or unplanned outages elsewhere.
• Supply discipline: Gas rig counts have lagged after the 2024 price slump; that slower supply response can tighten later-year balances if weather cooperates.
• Weather & Gulf risk: Peak hurricane season can interrupt Gulf production and processing, periodically supporting price.
• Europe draw season: As EU storage transitions from injection to draws, import needs rise, keeping a bid under seaborne gas.
Trade Plan:
• Entry: From weekly support (see chart).
• Management: Trail below fresh higher lows on the daily; take partials at fib/structure levels; let a runner target the upper band if momentum broadens.
What Breaks the Thesis
• A persistently warm Q4, outsized storage overhang into winter, major LNG outages/delays, or a renewed surge in production that swamps demand.
Note: Please remember to adjust this trade idea according to your individual trading conditions, including position size, broker-specific price variations, and any relevant external factors. Every trader’s situation is unique, so it’s crucial to tailor your approach to your own risk tolerance and market environment.
Energy Commodities
Crude Oil Trading Strategy for TodayThe cooling of inflation data strengthens the logic of a rate cut.
The core PCE price index in the United States rose by 2.8% year-on-year in October (lower than the expected 3.0%), reaching a new low since March 2023 and remaining below 3% for three consecutive months, confirming that inflation is approaching the Fed's 2% target. The probability of a 25BP rate cut in December has risen from 65% to 82%, and the cumulative rate cut expectation for 2026 has reached 125BP. In a liquidity-lean environment, the valuation attractiveness of crude oil as a risky asset has significantly increased - historical data shows that the average increase in WTI oil prices during the rate-cut cycle is 12%-15%, and the current price of $61.21 is still in the early stage of valuation recovery.
The US dollar index is under pressure, and the expectation of non-US demand release is expected.
The US dollar index has fallen by 3.2% from its October high and is currently stabilizing below the 92.5 mark. The purchasing power of non-US currencies has rebounded. The purchasing costs of oil-importing countries such as India and China have decreased. In November, India's oil imports are expected to increase by 6% month-on-month (to 5.2 million barrels per day), and China's refineries have received new quotas in November (an additional 12 million tons), and the policy-driven replenishment demand will directly support oil purchases, forming a positive cycle of "weak US dollar - increased purchases - oil price rise".
Crude Oil Trading Strategy for Today
buy:60.5-61
tp:61.5-62
sl:60

Crude Oil Trading Strategy for TodayU.S. crude oil inventories have exceeded expectations for three consecutive weeks of decline, easing the pressure in Cushing.
The latest EIA data (as of the week ending November 1) shows that U.S. crude oil inventories decreased by 5.8 million barrels on a month-on-month basis (expected - 2.2 million barrels), with the scale of decline in the past three weeks exceeding market expectations, and a cumulative reduction of 12.6 million barrels. The core Cushing region's inventories ended the previous four weeks of consecutive increases and decreased by 1.2 million barrels on a month-on-month basis (to 35 million barrels, 8% lower than the 5-year average), shifting from "accumulation pressure" to "tight balance". This data directly dispelled market concerns about "more than 2 million barrels per day of accumulation in the fourth quarter", and $61 became the strong bottom range supported by inventories.
Global major consumption areas' inventories have improved simultaneously, verifying the resilience of demand
European ARA region's crude oil inventories dropped to 43 million barrels (a 12% year-on-year decrease), China's commercial crude oil inventories decreased by 3.5 million barrels on a month-on-month basis (with the start of refinery replenishment demand), and Japan's crude oil inventories also decreased by 5% compared to the previous month. Global major consumption areas' inventories have simultaneously declined, confirming that terminal demand is not "unilaterally weak", but rather shows "overall resilience under regional differentiation", providing cross-regional supply and demand support for oil prices.
Crude Oil Trading Strategy for Today
buy:60.8-61
tp:61.8-62.5
sl:60.4

Crude Oil Trading Strategy for TodayPrecise control of production increase pace, directly addressing the pain point of the demand off-season
On November 2nd, the eight core member countries of OPEC + reached a key decision: in December 2025, they will maintain a slight increase of 137,000 barrels per day, but in the first quarter of 2026, they will completely suspend further production increases. This decision precisely hedged against the risk of "a record 4 million barrels per day surplus in 2026" as warned by the IEA. By freezing the supply increase in the weakest demand quarter (with demand possibly dropping by 2-3 million barrels per day in February and March), it forms a substantive "price protection and stabilization measure". Compared with the previous market concerns about "continuous production increase", the policy shift brought about a difference in expectations, providing strong support for oil prices. $60 became the implicit bottom line for the OPEC + policy to support the market.
Crude Oil Trading Strategy for Today
buy:60.8-61
tp:61.8-62.5
sl:60.4

BUY USOILOur trade for today is on OIL, as you can see, we bought to target the Daily LQ.
Follow for more trades!

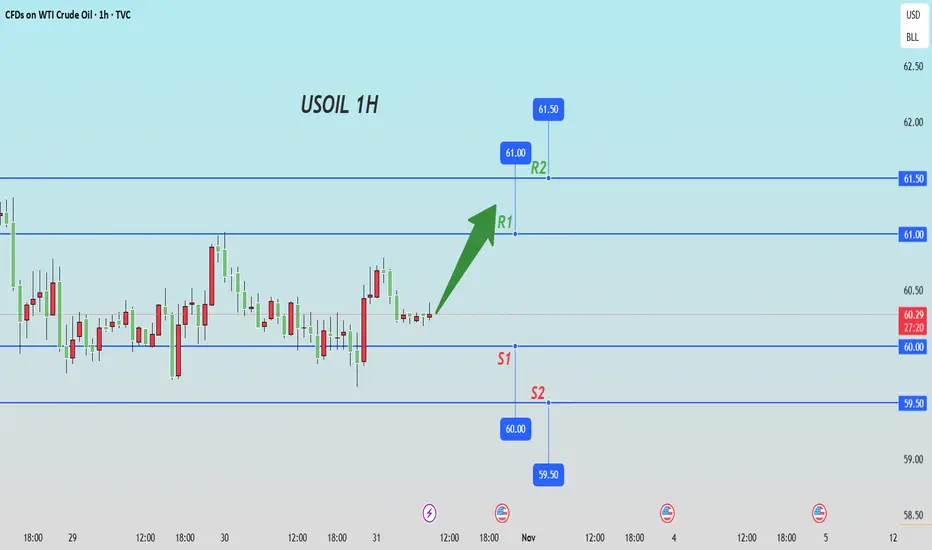
USOIL Is Very Bullish! Buy!
Please, check our technical outlook for USOIL.
Time Frame: 6h
Current Trend: Bullish
Sentiment: Oversold (based on 7-period RSI)
Forecast: Bullish
The market is trading around a solid horizontal structure 60.808.
The above observations make me that the market will inevitably achieve 62.277 level.
P.S
Overbought describes a period of time where there has been a significant and consistent upward move in price over a period of time without much pullback.
Like and subscribe and comment my ideas if you enjoy them!

GBPCAD on the Rise.GBPCAD should be rising this week and potentially getting up to the RESISTANCE zone or close to it this month.

US OilCrude Oil Index
- Bearish Channel as an corrective pattern in Short Time Frame
- RSI - Divergence
- Supply Zone
- Change of Characteristics
- Order Block
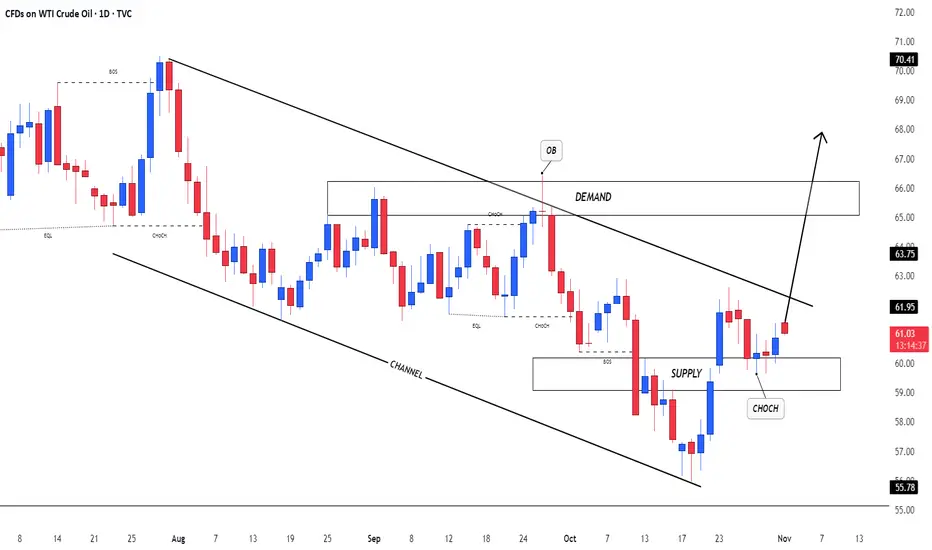
WTI Crud Oil Holds Above $60Crude oil closed higher for a third day on Friday and is showing signs of stability above $60. This suggests the retracement from 62.59 is complete and momentum is preparing to realign itself with the rally from the 55.96 low.
While resistance is nearby - from the 200-day EMA and October's high-volume node (HVN), I suspect prices will eventually break above them. Bulls could consider dips towards last week's low to increase the potential reward to risk ratio, on the assumption of a retest of the 62.59 high and potential break above it.
Matt Simpson, Market Analyst at City Index

Gold | Oil | Dollar | Silver | Natural Gas Price ForecastGold | Oil | Dollar | Silver | Natural Gas Price Forecast
NYMEX:NG1! COMEX:GC1! COMEX:SI1! AMEX:UNG

Is Crude Oil Setting Up for a Major Bearish Reversal?🛢️ XTI/USD “WTI” – Bearish Redistribution Zone Incoming (Thief Strategy Inside)
📉 Setup Overview
Market: XTI/USD (WTI crude oil)
Bias: Bearish confirmed — we’re looking for re-distribution / supply pressure to take control
Trade Type: Swing / Day Trade hybrid
🎯 Entry Plan (Thief-Layer Strategy)
I use a layering / multiple limit order approach (aka “Thief Strategy”). You may use any price level as entry, but here’s my preferred ladder:
Sell Limit @ 61.500
Sell Limit @ 61.000
Sell Limit @ 60.500
Sell Limit @ 60.000
Sell Limit @ 59.500
(You may extend more layers if you like)
You don’t need to hit all layers — just get partial fills, ride the move downward.
🚫 Stop Loss
Thief’s SL: 62.500
⚠️ Note to Thief OG’s: I’m not forcing you to follow my SL. You choose what works. Make money, take money — at your own risk.
🎯 Target
We see police barricade as a strong support zone + oversold trap possibility.
So primary target: 57.000
⚠️ Note to Thief OG’s: Don’t blindly hold to my TP. If price gives you your gains early, escape with your money — don’t wait for perfection.
🔍 Related Pairs & Correlations
AMEX:USO or USOIL (oil ETFs / indices) – real-world crude correlation
$BRENT/USD – watch for strength or weakness divergence
AMEX:XOP / AMEX:OIH (oil & gas sector indices) – sentiment in energy names
Key point: if Brent weakens while WTI breaks down, it reinforces the bias.
📌 Key Technical Notes
We’re waiting for ** redistribution / supply zone** to hold — a retest or failure bounce is ideal setup.
Oversold conditions + a “trap” candle (fake breakout) strengthen the move.
Use layering to average in, not “all-in” at once.
Be ready for whipsaws around support zones; partial exits can help.
✨ “If you find value in my analysis, a 👍 and 🚀 boost is much appreciated — it helps me share more setups with the community!”
Disclaimer: This is Thief-style trading strategy just for fun. I am not giving financial advice. Trade at your own decision and risk.
#WTI #CrudeOil #XTIUSD #EnergyTrading #OilStrategy #Layering #SwingTrade #DayTrade #BearishBias #ThiefStrategy
USOIL: Short Trading Opportunity
USOIL
- Classic bearish setup
- Our team expects bearish continuation
SUGGESTED TRADE:
Swing Trade
Short USOIL
Entry Point - 60.87
Stop Loss - 61.10
Take Profit - 60.44
Our Risk - 1%
Start protection of your profits from lower levels
Disclosure: I am part of Trade Nation's Influencer program and receive a monthly fee for using their TradingView charts in my analysis.
❤️ Please, support our work with like & comment! ❤️

The attack committee's risk has triggered supply anxietyDirect supply disruption risk: 900,000 barrels/day capacity at risk of zeroing out
The current daily crude oil production in Venezuela is 940,000 barrels (accounting for 0.9% of the global total). Although the absolute scale is limited, as the only OPEC oil-producing country not subject to production quotas, its production capacity has strategic resilience. Actions such as the arrival of US B-1B bombers and the deployment of the "Ford" aircraft carrier strike group in the Caribbean Sea, if escalated to military strikes, the core facilities of PDVSA, such as Lake Maracaibo oil field (accounting for 60% of the capacity) and Jose Port (the only deep-water oil port), will be directly paralyzed. Short-term exports may drop from 900,000 barrels/day to zero, forming a dual supply shock of "sanctions + war".
Replacement supply gap difficult to fill: OPEC+ remaining capacity in crisis
Currently, the total remaining capacity of OPEC+ is only 210,000 barrels/day, and it is concentrated in Saudi Arabia (180,000 barrels/day). If combined with the sanctions on Iran and disruptions in Red Sea transportation, Saudi Arabia needs to increase production by 170,000 barrels/day to fill the gap, which is close to its maximum idle capacity limit. Although US shale oil has potential, due to capital discipline restrictions, the maximum monthly increase in production is only 30,000 barrels/day, far from covering the supply vacuum in Venezuela. The price spread of heavy crude oil (the main type in Venezuela) has expanded from 1.2 US dollars to 1.8 US dollars, and structural tension has emerged.
Market sentiment preview: Risk premium accelerating inclusion
Historical data shows that after the US imposed sanctions on PDVSA in 2019, the weekly fluctuation range of oil prices expanded to 8%; while the impact intensity of military conflicts is 3-5 times that of sanctions - the oil facilities in Iran were attacked in 2019 (similar supply disruption), pushing oil prices to surge by 7.3% in a single day. Currently, the CFTC crude oil volatility index has risen from 18 to 25, and funds have begun to layout geopolitical risks in advance. The premium of near-month contracts over far-month contracts has expanded to 1.2 US dollars, reflecting short-term supply concerns.
Next week's crude oil trading strategy
buy:59.5-60
tp:61-61.50
sl:58.5

USOIL Will Collapse! SELL!
My dear subscribers,
This is my opinion on the USOIL next move:
The instrument tests an important psychological level 60.87
Bias - Bearish
Technical Indicators: Supper Trend gives a precise Bearish signal, while Pivot Point HL predicts price changes and potential reversals in the market.
Target - 60.50
My Stop Loss - 61.09
About Used Indicators:
On the subsequent day, trading above the pivot point is thought to indicate ongoing bullish sentiment, while trading below the pivot point indicates bearish sentiment.
Disclosure: I am part of Trade Nation's Influencer program and receive a monthly fee for using their TradingView charts in my analysis.
———————————
WISH YOU ALL LUCK

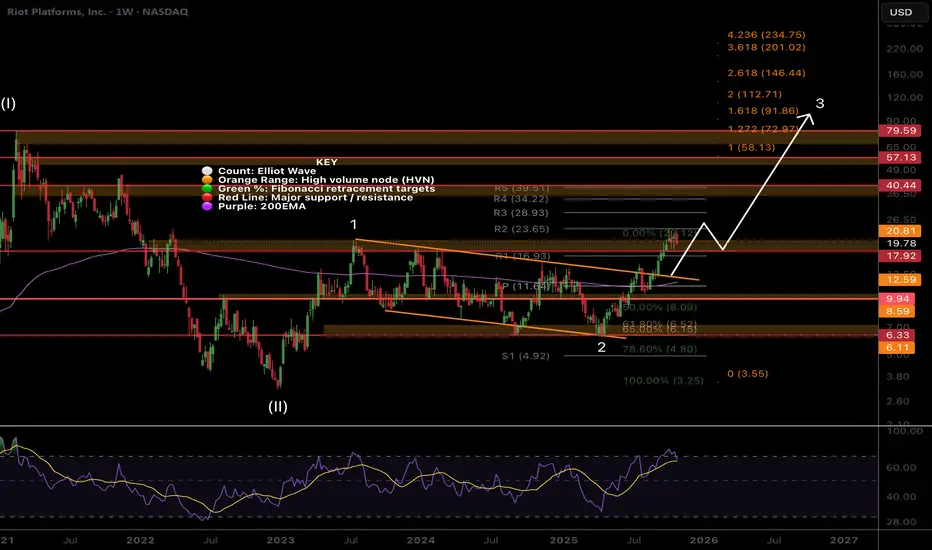
RIOT, nothing changed, Higher...Riot is another low cap volatile asset that keeps people afraid with its wild swings as I am seeing panic in my comments across platforms.
Price remains in momentum breaking out of the channel in a wave 3 with a minimum target of the 1.618 Fibonacci extension at $91, a 4x from here. Wave 2 completed at triple support- Fibonacci golden pocket, High Volume Node and channel boundary before quickly overcoming the weekly pivot and 200EMA. Breaking out above wave 1 is a show of strength.
Price should stall at the High Volume Nodes as supply comes in; $21, $40 and $57 but ultimately they should be overcome.
🎯 Terminal target for the business cycle could see prices as high as $112 based on Fibonacci extensions
📈 Weekly RSI is oversold with no divergence and can remain here for months as price keeps increasing.
👉 Analysis is invalidated if we close back below $9
IREN ready for pullback?Price has overextended in a macro wave 3, the strongest and most powerful move described as a “wonder to behold” by Ellioticians. Novice investors are likely to get over-confident in these conditions, enter without risk management and keep chasing price upwards only to be underwater when it turns around.
Profit taking appears to be taking place, I have closed my positions waiting for re-entry. The weekly pivots have been ran.
Initial downside targets for wave (4) is the 0.236 Fib retracement at $39 followed by the 0.382, $26.43. Expect shorts to pile in adding to any downside momentum.
In the long term we have higher to go towards $100 in wave (5).
🎯 Terminal target for the business cycle could see prices as high as $100 based on Fibonacci extensions
📈 Weekly RSI is oversold with no divergence and can remain here for months as price keeps increasing.
👉 Analysis is invalidated if we close back below the weekly 200EMA

USOIL BEARS WILL DOMINATE THE MARKET|SHORT
USOIL SIGNAL
Trade Direction: short
Entry Level: 60.87
Target Level: 55.71
Stop Loss: 64.31
RISK PROFILE
Risk level: medium
Suggested risk: 1%
Timeframe: 1D
Disclosure: I am part of Trade Nation's Influencer program and receive a monthly fee for using their TradingView charts in my analysis.
✅LIKE AND COMMENT MY IDEAS✅

Crude Oil's Critical Breakdown: Is a Plunge to $58 Imminent?Hello, TradingView community! 👋 SpotCrude (WTI) has taken a significant turn, closing the week at a precarious 61.168 . After failing to sustain its recent rally, oil is now teetering on the edge of a major support level. Is this the beginning of a new downtrend, or will buyers step in to defend the line? The upcoming week, November 3rd to 7th, will be decisive.
Let's drill down into the multi-timeframe data, blending classic technical theories with key indicators to forge a robust trading strategy for the days ahead. 💡
🌍 The Macro Outlook: Weekly & Daily Charts - The Bears Are Back in Town
The market is a battlefield, and the trend is your strongest ally.
The higher timeframes are flashing significant warning signals, suggesting the recent strength was merely a correction in a larger downtrend.
Weekly Chart (1W) : The long-term picture remains bearish. As per Dow Theory , the primary trend is down, with the recent push higher failing at a key resistance zone. The price is firmly below the Ichimoku Cloud, and the formation of a Bearish Engulfing candle last week is a powerful rejection signal.
Daily Chart (1D) : On the daily chart, the story of failure becomes clearer. We have a potential Double Top formation right at a major resistance level. The RSI is exhibiting a clear bearish divergence where price made a higher high, but the RSI failed to confirm, indicating weakening momentum. The price has been decisively rejected and is now threatening to break down from this topping pattern.
⚔️ The Swing Trader's Battleground: 4-Hour & 1-Hour Analysis
For swing traders, a classic and powerful reversal pattern has taken center stage.
4-Hour Chart (4H) : This timeframe is the most critical. A clear Head and Shoulders pattern has formed, and crucially, the price has already broken below the neckline . This is a textbook bearish reversal signal. The Bollinger Bands are expanding, pointing to an injection of downside volatility . From a Wyckoff Theory standpoint, this breakdown represents a "Sign of Weakness" (SOW) following a distribution phase at the highs.
1-Hour Chart (1H) : The hourly chart confirms the breakdown with conviction. Price is trading well below the VWAP and the Ichimoku Cloud, both of which are now acting as overhead resistance. Any attempt to rally back to the broken neckline (around the 62.00-62.20 area) is likely to be met with significant selling pressure.
🔬 The Intraday Scalpel: 30M, 15M, & 5M Insights
For intraday traders, the path of least resistance is clearly down.
30M/15M Charts : These timeframes are displaying a strong, impulsive downtrend. Following the initial breakdown, we are seeing the formation of a Bearish Pennant or flag. This typically represents a brief pause as sellers reload for the next push lower. The RSI is hovering near oversold levels, so a minor bounce is possible, but this is likely a selling opportunity, not a reversal.
5M Chart : On the 5-minute chart, the VWAP is the key level to watch. As long as the price remains below it, bears are in full control. Scalpers should be wary of any sudden spikes upward, as they could be a bear trap designed to lure in buyers before the next decline. Watch for volume to increase on down moves as confirmation of the bearish intent.
⏳ Gann Theory & Price/Time Analysis
Applying the principles of W.D. Gann, the rejection occurred at a key Gann resistance angle. The price has now broken below a key support angle, suggesting an acceleration of the downtrend. Gann's range analysis points to the $58.00 - $58.50 area as the next major price magnet to the downside.
🎯 Actionable Trade Plan for the Week Ahead
Based on this comprehensive analysis, the bearish case is overwhelmingly strong.
The Primary Bearish Scenario 🐻
Entry: The ideal entry is to short a pullback to the broken Head and Shoulders neckline, targeting the 62.00 - 62.20 resistance zone. An alternative entry is to short the breakdown of the current bearish pennant, below 61.00 .
Targets: The first target is the psychological 60.00 level. The main target, derived from the Head and Shoulders pattern measurement, is the major support zone at 58.50 .
Invalidation: A strong and sustained 4H candle close back above the right shoulder of the pattern, specifically above 63.00 , would negate the immediate bearish thesis.
The Low-Probability Bullish Scenario 🐂
Entry: This is a counter-trend trade and is not recommended. It would require an exceptionally strong reclaim of the 62.50 level, effectively invalidating the entire Head and Shoulders pattern.
Targets: Resistance at 63.50 and 64.50 .
Invalidation: Any drop back below 62.00 .
Conclusion: The Evidence Points Down
The technical picture for Crude Oil is decidedly bearish. With a confirmed Head and Shoulders breakdown on the 4H chart, supported by weakness on both higher and lower timeframes, the path of least resistance is to the downside.
This week, the strategy is to sell the rallies . Be patient and wait for a high-probability entry near established resistance.
What are your thoughts on oil? Are you positioning for a further drop, or do you see a reversal in the cards? Share your analysis in the comments below! 👇
Disclaimer: This is not financial advice. This analysis is for educational purposes only. Always conduct your own research and manage your risk appropriately.

Crude Oil Trading Strategy for TodayThe spot market and capital are in resonance, and short-term support is clear.
1.Strengthening of spot structure: The near-month WTI contract has returned to a spot premium structure, and the Brent-WTI spread is stable, reflecting the expectation of short-term supply tightness and providing a fundamental support for the current price.
2.Dual benefits of inventory and capital: U.S. EIA inventories have been reduced for several consecutive weeks, and the latest published value is significantly lower than expected, confirming the marginal improvement in demand; trend trading funds have recently increased their long positions, driving short-term short-squeeze momentum.
3.Cost and reserve support: Warren Buffett's Western Oil holdings imply a long-term equilibrium price of WTI at approximately $58.2, and the current price of $60.26 is close to the value support range; the U.S. SPR is at its lowest level since 1990, reducing its ability to stabilize oil prices and strengthening the bottom support.
Crude Oil Trading Strategy for Today
buy:59.5-60
tp:61-61.5
sl:58.5
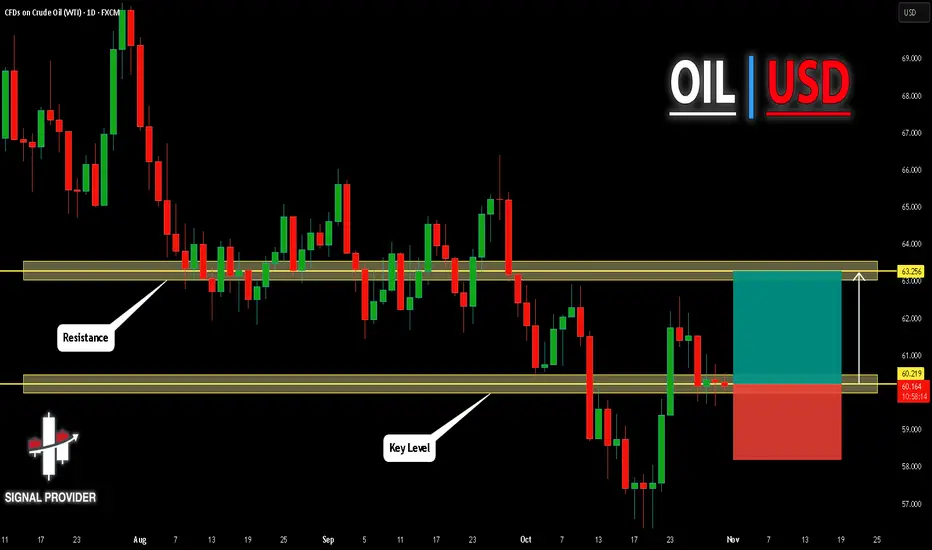
USOIL Is Very Bullish! Long!
Please, check our technical outlook for USOIL.
Time Frame: 1D
Current Trend: Bullish
Sentiment: Oversold (based on 7-period RSI)
Forecast: Bullish
The market is approaching a significant support area 60.219.
The underlined horizontal cluster clearly indicates a highly probable bullish movement with target 63.256 level.
P.S
Please, note that an oversold/overbought condition can last for a long time, and therefore being oversold/overbought doesn't mean a price rally will come soon, or at all.
Like and subscribe and comment my ideas if you enjoy them!
USOIL H4 | Bearish Drop OffUSOIL is reacting off the sell entry, which is a pullback resitance that aligns with the 38.2% Fibonacci retracement and could drop from this level to the downside.
Sell entry is at 60.77, whichis a pullback resistance that lines up with the 38.2% Fibonacci retracement.
Stop loss is at 62.09, which is a swing high resistance that lines up with he 78.6% Fibonacci retracement.
Take profit is at 58.74, which is a pullback support that aligns with the 61.8% Fibonacci retracement.
Stratos Markets Limited (tradu.com ):
CFDs are complex instruments and come with a high risk of losing money rapidly due to leverage. 68% of retail investor accounts lose money when trading CFDs with this provider. You should consider whether you understand how CFDs work and whether you can afford to take the high risk of losing your money.
Stratos Europe Ltd (tradu.com ):
CFDs are complex instruments and come with a high risk of losing money rapidly due to leverage. 70% of retail investor accounts lose money when trading CFDs with this provider. You should consider whether you understand how CFDs work and whether you can afford to take the high risk of losing your money.

Natural Gas Rallies on Weak InventoriesNatural Gas surged up 6% today.
Inventories came out 74B vs 71B estimate.
Despite the weaker report the commodity still surged.
This is showing a great relative strength trade.
A bull flag could be primed for a breakout on the daily chart.
Nat gas equities are beginning to look cheap again.

LNG Week 44: 80 BCF Storage Gain as Demand Edges Supply*Due to the platform's features, the charts are arranged in sequence from left to right, from the first to the Eighth chart. The charts were created by our team and based on an analysis from Bloomberg and the EIA data. This analysis was conducted in cooperation with Anastasia Volkova, analyst of LSE.
Current prices compared to price dispersion 10 days before expiration, by month since 2010
The expiration of the NGX25 contract was above the median according to data from 2010. Quotations for December and winter contracts for 2026 support growth and remain above the upper limit of the interquartile range.
Forward curve compared to 2020-2025
The shape of the forward curve in 2025 shows a steady convergence and is even closer to the configurations recorded in 2023 and 2024 for comparable dates. This trend is particularly evident in contracts with delivery in three years or more, where prices are steadily converging towards historical levels.
Current stocks and forecast for next week compared to 2019-2024
According to the forecast for week 43 (October 20-26), gas reserves in underground storage facilities will increase by +80 BCF, which is slightly above the average of +78 BCF for the past 5 years.
15-day sliding sum HDD+CDD based on current NOAA data and forecast for the next two weeks compared to 1994-2024
The current values of HDD+CDD accumulated over 15 days are in the average range for 1994–2024. The forecast for the coming week suggests that the values will exceed the average by 15–20 points, but in two weeks, there will be a trend toward returning to the average and below.
Accumulated HDD+CDD for 15 days based on current NOAA data and forecast compared to 1994-2024 by region
The current values of HDD+CDD accumulated over 15 days remain within the average range for 1994–2024. The forecast for the next two weeks suggests a return to the average weather trend in all regions.
Weekly total supply/demand difference compared to 2014-2024
This week, the difference between supply and demand in 2025 rose above the average values for 2014–2024, indicating that demand is growing faster than supply.
Number of days for delivery from warehouses
The graph shows the number of days of supply from storage facilities alone, based on current consumption levels. At the end of October 2025, reserves will last for approximately 34 days, which is below the lower limit of the interquartile range. With such a moderately reduced level of reserves, even minor disruptions in production or spikes in demand could cause sharp price reactions, especially in late winter and early spring.
Anomalies in weather (HDD+CDD) and fundamental factors
Overall, fundamental and weather factors are within the expected range, except for continued growth in consumption in the residential and commercial sectors caused by the start of the heating season. However, there has been no significant cooling at the start of the heating season so far.
