From Neckline to Target: Setting H&S Bearish Entries and ExitsUnderstanding the Head & Shoulders Breakdown
A bearish head and shoulders pattern gives traders a structured way to define entries and exits using price geometry rather than emotion. The pattern forms when a market transitions from strength to distribution, creating a left shoulder, a higher head, and then a lower right shoulder as momentum begins to fade. The neckline acts as the key support level that separates a developing pattern from a completed one.
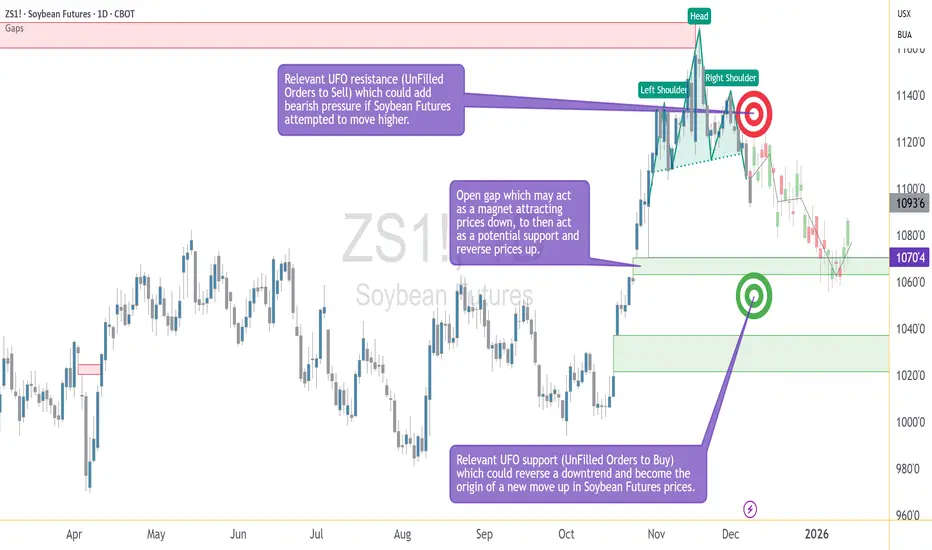
In the case study illustrated on the chart, the daily timeframe shows a fully developed head and shoulders structure that confirmed during the December 5 trading session, when price closed below the neckline. This type of close is often interpreted by traders as evidence that bearish participation has taken control of the pattern. Whether a trader enters immediately or waits for a retest, the priority becomes identifying the levels that will structure the trade: the area of invalidation, the downside objective, and the points where risk must be controlled.
A confirmed neckline break does not imply certainty about future price direction. Instead, it provides an organized framework—a map traders can use to define where their idea is considered valid and where it is considered invalid. The educational value of this pattern lies not in its ability to predict, but in its ability to help traders pre-plan actions with clarity.
Structuring the Bearish Entry: Neckline Retests and Resistance Zones
One of the most common approaches to trading a bearish head and shoulders is to monitor for a modest bounce back toward the neckline after the breakdown. Retests do not always occur, but when they do, many traders see them as opportunities to enter with more control over the distance between entry and stop.
In this example, price sits beneath a well-defined UFO resistance area between 1123 and 1136. This band aligns with a cluster of unfilled sell orders, which may reinforce bearish pressure if price attempts to climb. More importantly, the upper boundary of the zone—1136—serves as an objective point of invalidation. If price were to move above that level, the logic of the completed bearish structure would no longer hold. Therefore, traders could use this upper boundary as a stop-loss level. It is neither arbitrary nor emotional; it is derived directly from the structure.
This type of predefined invalidation is essential because even the cleanest technical patterns can fail. The purpose of using a pattern is not to guarantee the outcome, but to know exactly when the trade thesis no longer makes sense. In this framework, the neckline provides context for the entry, while the resistance zone provides clarity for where the idea is wrong.
Defining the Target: Gap Alignment and Technical Confluence
After establishing where a trade becomes invalid, traders turn to the question of where it becomes complete. In pattern-based trading, target selection often blends classical measurement rules with the identification of technical areas where price has reason to react. In this case study, the downside objective centers on 1070'4, where two important elements align.
First, there is an open gap at this price level. Gaps frequently attract price because they represent prior imbalances in trading activity—areas where the market moved too quickly for participants to fully transact. When price revisits such a location, it becomes a zone where activity may increase. Second, the gap coincides with a region of unfilled buy orders that may serve as a UFO support area. When gaps and demand zones overlap, the confluence strengthens the rationale for using the level as a target.
Because the bearish pattern is already confirmed, traders using this structure may calculate a reward-to-risk ratio by comparing the distance from the entry zone to the stop (near 1136) and the distance from the entry zone to the target (1070'4). The role of the target is not to predict where price will go, but to anchor the trade in a predefined and measurable plan. It transforms the setup into a risk-managed scenario rather than an open-ended directional hope.
Understanding Contract Specs, Margin, and Risk Management
Traders using standardized futures contracts must structure their decisions around contract size, tick value, and margin requirements. The chart example in this idea uses the standard ZS contract, which represents 5,000 bushels. The micro contract (MZS) represents 500 bushels. This difference directly affects position sizing and the dollar impact of each tick. Because margin requirements vary over time, traders should always check the latest values before entering any position.
Tick (Minimum Price Fluctuation:
ZS: 1/4 of one cent (0.0025) per bushel = $12.50 per contract
MZS: 0.0050 per bushel = $2.50 per contract
Current Margin Requirements:
ZS: $2,000 per contract
MZS: $200 per contract
A key benefit of having two contract sizes available is flexibility. Traders seeking to maintain disciplined risk parameters often use micro contracts to fine-tune exposure, ensuring that the stop-loss level does not exceed their predefined risk tolerance. The objective of the head and shoulders pattern is not merely to identify a direction but to help traders organize their plan around risk boundaries. Knowing the contract’s characteristics enables the trader to size positions correctly.
Risk management remains the foundation of pattern-based approaches. Price can behave unpredictably, even when the chart seems decisive. This is why traders emphasize position sizing, controlled leverage, and strict adherence to the stop-loss level. The goal is not to avoid losses entirely but to keep them manageable and consistent. A well-constructed head and shoulders strategy relies not only on identifying the pattern but on respecting the risk parameters that accompany it.
Bringing It All Together: Structure, Context, and Discipline
The chart included in this idea illustrates the essential elements of the bearish head and shoulders setup: the left shoulder, head, and right shoulder; the neckline break; the gap at 1070'4; and the resistance band between 1123 and 1136. These levels form the backbone of a structured trading plan. Rather than reacting to market movement in real time, traders can use these predefined reference points to guide decision-making with consistency.
The purpose of this article is educational. It demonstrates how entries, exits, and risk parameters can be structured around a classical bearish head and shoulders pattern, how confluence strengthens downside targets, and how contract specifications help traders align position size with their risk tolerance. Above all, it shows that disciplined planning matters more than attempting to anticipate every price movement.
When charting futures, the data provided could be delayed. Traders working with the ticker symbols discussed in this idea may prefer to use CME Group real-time data plan on TradingView: www.tradingview.com - This consideration is particularly important for shorter-term traders, whereas it may be less critical for those focused on longer-term trading strategies.
General Disclaimer:
The trade ideas presented herein are solely for illustrative purposes forming a part of a case study intended to demonstrate key principles in risk management within the context of the specific market scenarios discussed. These ideas are not to be interpreted as investment recommendations or financial advice. They do not endorse or promote any specific trading strategies, financial products, or services. The information provided is based on data believed to be reliable; however, its accuracy or completeness cannot be guaranteed. Trading in financial markets involves risks, including the potential loss of principal. Each individual should conduct their own research and consult with professional financial advisors before making any investment decisions. The author or publisher of this content bears no responsibility for any actions taken based on the information provided or for any resultant financial or other losses.
Entries
The SAFEST Entry Technique - 18 Period Moving Average MethodA great deal of viewers have contacted me asking how I "time" the market. In other words, once I've identified a market as "set up" (via COT strategy or Valuation Strategy), how do I get into a trade.
This video is the first in a series that will outline the entry techniques that I use.
18 PERIOD MOVING AVERAGE ENTRY METHOD:
By far, this method is the safest change of trend confirmation that you will find. There are other entry techniques that will get you into the market sooner, sure. But those other entry techniques come with greater risk, and could be called "bottom picking" to some degree.
The 18 Period MA Entry Method is simple.
STEP 1: Plot the 18 period SMA on your chart based on the closing price.
STEP 2: For LONGS , you need to see two full range candles form ABOVE the MA. From there, mark out the highest high of those 2 candles. When price trades up into that high, the trend has officially changed to bullish. For SHORTS , you need to see to full range candles form BELOW the MA. From there, mark out the lowest low of those 2 candles. When price trades down into that low, the trend has officially changed to bearish.
CAVEAT: We do not count inside bars (bars that form within the range of the previous candle). If you see inside bars, skip them and continue your 2 bar count.
STEP 3: Enter at market when high/low is breached. Risk management is something I will review in another video, but generally, I add/subtract 120%-150% of the 3 bar ATR.
CLARIFICATION: To be clear, this entry technique should not be traded blindly. You need to have a REASON to take the trade (for example, COT strategy suggests a market is setup for a trade, or the Valuation/Ducks in a Barrel setup suggests a market is setup for a trade).
CREDIT: I credit Larry Williams, Tom DeMark, Brian Schad & Jake Bernstein for their influence in these ideas.
If you have any questions about this entry technique, feel free to shoot me a message.
Good Luck & Good Trading.

Using Fibonacci & FPT To Identify Trends/Entries/ReversalsLearn how powerful Fibonacci Retracements and Fibonacci Price Theory are when adequately deployed.
It can tell where and when to target entries, trends, risks, and reversals.
Anyone can do this when they learn to efficiently manage the ranges and use Fibonacci tools in Trading View.
It's time you took a few minutes to learn the PRICE is the ultimate indicator. You don't need to use dozens of other indicators (unless you want to add to the core Fibonacci techniques).
Watch this video, then follow my research/videos.

TRADE TODAY 6:1 (result)BYBIT:AUCTIONUSDT.P
Auction enters my preferred liquid zone where I will scalp a 6:1 on the 15 minute chart
DM for free lessons.
NO BS

Trade Discipline - Improving Your Entries
How many times have you been stopped out of a great trading idea you noticed just because you missed your original entry and decided to enter at a worse price?
This was most likely due to the fear of missing out (FOMO) and lack of discipline that got you into the trade.
You were right on the market direction, but due to FOMO and your lack of discipline, the trade entry was bad, and you ended up being stopped out, only to then painfully watch the market go your way.
Do not feel bad, as this has happened to the best of us, so this post will discuss methods on how to improve your entries and discipline to ensure that you do not get stopped out again because of a bad entry.
Never chase missed entries.
Let’s say the market is in a nice healthy trend, making a series of higher highs and higher lows. And when you overlay the 20-day moving average over it, you notice the market bounce off the moving average quite a few times. You then get a buy signal near the moving average, but unfortunately, you missed the entry and are just watching the market go up without making any money from it.
Now, when you look at the chart, the market is very far away from the 20-day moving average. So even though the market is currently in an uptrend, ideally you don’t want to be buying now because, from looking at your analysis, the market tends to pull back to the 20-day moving average. If you impulsively buy when the price is very far away from the 20-day moving average, when the price is overstretched and the market has been overbought, there’s a high probability the market will reverse or pullback, and you will most likely get stopped out.
We all miss entries and opportunities; it is completely normal to do so, and sometimes the market can give you a second chance to enter by coming back to your original level. If it does not and you completely miss the move, do not dwell on it; dust it off and move on. The markets are not going anywhere, and plenty more opportunities will come your way.
You can see in the above image why it is a bad idea to chase missed entries. When the impulsive move has happened and you missed the initial move, leave the market alone at that current time. Either wait for a pullback to trade the continuation, or if your analysis is suggesting a possible market reversal, then wait for a confirmation signal and trade the reversal at a good entry price.
Be Proactive.
Many traders, especially beginners, do not place enough importance on entries when trying to get consistent profits in the markets. The reason why entries are important is due to market noise and the limited funds that traders have. Let me explain further: Traders are buying and selling constantly; therefore, all markets have ups and downs (market noise). This means that markets rarely go up and down in a straight line, so when you put your hard-earned capital at risk in a trade, due to the up and down ticks, your capital will float up and down as the market moves up and down. So if your entry is bad, then you are more likely to get stopped out due to market noise.
If you want to see consistency in your trading, it is crucial to work on your timing and discipline. The best thing you can do to improve the entries in your trades is to be proactive, not reactive.
Being proactive means planning ahead for your trade entry. You must do your homework to anticipate and predict the key levels in the markets to help you get the best entries. Setting up trades after the market closes or during quiet hours is one effective way to be proactive and help improve your entry. You will not second-guess yourself as compared to being a reactive trader because you are prepared. The reactive trader, as the name suggests, reacts to the constant ebb and flow of market prices, always working in "the now." More often than not, reactive traders will end up jumping into momentum plays that will reverse on them, leaving this type of trader frustrated and confused.
Use Limit Orders to improve trade entry.
When using a limit order, you place a limit on how much you're willing to pay to buy or sell a specific product. Limit orders allow traders to enter the market at the best possible price. For example, if you have a specific setup with a good entry level that the market may reach, you can place a limit order at that specific price to buy or sell. Limit orders are very helpful in giving traders the patience and discipline to wait for their entry prices instead of spontaneously entering the market at random levels that will most likely stop them out.
The main disadvantage of a limit order is that there are no guarantees that the order will actually go through. The product price must meet the limit order specifications to execute properly; however, even with this disadvantage, it is still better to have better control by entering at a price you want instead of entering at a price you are not comfortable with.
Support and Resistance levels.
Support and Resistance levels are in the markets for a reason, and you should use them to help with your entries. One of the worst things you could do is think the market is going up and end up buying it at a resistance level before it heads down to stop you out, only for it to go back up again.
Always look at your charts, and get into the habit of looking to the left. Why? Because looking to the left will give you information on historical price movements, and with those movements, you will see consistent areas where the market bounced off (Support) and consistent areas where the market pulled back (Resistance). When you really understand this and grasp how support and resistance levels work, you will instinctively understand these levels and will actually notice the market moving towards them to test them. So the next time you think the market is going up, try to enter near or at a support level, and if you think the market is going down, try to enter near or at a resistance level.
The image above shows support and resistance levels in the market. Can you notice how the market is always drawn to these levels? You can see the numerous times the market has traded around these areas. These areas are often good entry points for your trades, and you should always take the time to look at your charts for these levels.
Use additional timeframes.
Using one or more additional timeframes to double-check a trend can help improve your entries.
For example, if you’re using a four-hour chart as your main timeframe to look for opportunities on a specific product and you spot a pullback from a bull run that has the potential of a big reversal, you could confirm the broader move by taking a look at a daily chart to confirm how long the trend has lasted or identify some support and resistance levels in its wider trend. Alternatively, you could hop over to an hourly chart or 30-minute chart and see what is happening on a smaller timeframe.
By doing this, you can also check whether buyers or sellers are in charge during the current trading period.
What you want to avoid doing, though, is adding too many different charts to your analysis and moving between them at random to find opportunities. Instead, stick to a ‘base chart’ that you use to trade, with one or two others for confirming moves.
As you can see in the image above, there are three charts. On the main time frame, a potential reversal signal was spotted, and there may be a possible pullback to the bull run. By looking at both the longer time frame and the shorter time frame to help support the analysis, this will help improve your entry because, for example, if all timeframes clash with each other or show conflicting signals, this may help the trader second guess their original analysis and may decide to wait for clearer confirmation signs on all time frames before deciding to enter the market.
The goal of every trader is to be successful in achieving consistent profits, and entries play a big part in this. You can correctly call the market and still lose money due to bad entries. The more you understand key market levels and have the discipline to wait and trade around them, the more probability you will have of trades going your way. Though it is still possible to lose trades on good entries, trading is a probabilistic outcome with no guarantees, so why would you want to enter at a bad entry price to give yourself a disadvantage in the markets before the trade has even started?
Trade safely and responsibly.
BluetonaFX

For usdt buy long Pls 🙏 comment & #dyor 😃
I have realised 📌 2023 to 2026 btc road map 🗾
We already successfully completed 🚀 old road map 2020 to 2022
For buy long enjoy

Bitcoin Scalping Signal for Day Trading🖥️ We have determined there is a 60% chance Bitcoin will Rise from our current entry point.
📉 LONG - BTC : 29,150 📉
💵 Length of trade: we are expecting BTC to hit a HKEX:650 scalp, with a high end of HKEX:900 , with a possible rejection signified by the red boxes, and will look to short.
🕰️ Duration of trade: we are expecting the minimum target to occur within 10 hours. Then we see the rest of this trade playing out by Thursday.


Bitcoin Scalp Signal for Day Trading🖥️ We have determined there is a 65% chance Bitcoin will Fall from our current entry point.
📉 SHORT - BTC : $24,545 📉
💵 Length of trade: we are expecting BTC to hit a $550 scalp, with a high end of $1,000, and a minimum expectation of $350.
🕰️ Duration of trade: we are expecting the minimum profit target to possible get hit by market open in NYC. Then we see the rest of this trade playing out until the day end.

Bearish on Eurusd #letsdothis
I had already taken a nice trade of EU yesterday and price was retracing I closed half of my positions on my mt4 and the remaining move SL to entry which is still on and now I've entered a sniper entry its very aggressive but I've got in as it will be the only risk trade as my 1st trade is risk free

Bitcoin Scalp Signal for Day Trading🖥️ We have determined there is a 65% chance Bitcoin will Rise from our current entry point.
📉 LONG - BTC : $21,800 📉
💵 Length of trade: we are expecting BTC to hit a $400 scalp, with a high end of $700, and a minimum expectation of $250.
🕰️ Duration of trade: we are expecting the minimum target to occur within 10 hours. Then we see the rest of this trade playing out around market open for NYSE.
📊🖥️ INDICATOR SHOWN ON CHART : Scot Signal Indicator

Bitcoin Scalp Signal for Day Trading🖥️ We have determined there is a 65% chance Bitcoin will Fall from our current entry point.
📉 SHORT - BTC : $23,755 📉
💵 Length of trade: we are expecting BTC to hit a $550 scalp, with a high end of $1,000, and a minimum expectation of $350.
🕰️ Duration of trade: we are expecting the minimum profit target to possible get hit by midnight. Then we see the rest of this trade playing out Monday morning.
📊🖥️ INDICATOR SHOWN ON CHART : Scot Signal Indicator

GBPUSD ShortFX:GBPUSD
After price broke its bearish structure on the 1H. Price continued to rally down. It then made a pullback with multiple candlesticks testing on the 50% Fibonacci retracement level creating a potential lower high and a resistance level. Entries are found on the lower timeframes like the 5min and 15min timeframes

✅ 4 Methods to Confirm EntriesYou should make sure that your reward is bigger than your risk.
It is up to you what your optimal risk to reward should be – ideally you should have a risk to reward of 1:2 or 1:3.
✔️Trendline Reversal & Break
The trader should constantly monitor both the support and resistance trendlines and redraw them as the old ones break and new ones form.
When an intersection of the projections happens, one of the trendlines must be broken and the other will most likely continue to hold the price.
We trade in the direction of the trendline that remained unbroken with potential entries at the trendline breaks.
✔️Support & Resistance
Look at the price chart and observe the support and resistance levels that you have drawn on the charts.
You will look to place sell orders at the resistance levels and buy orders at the support levels.
Stop loss below the support level or above the resistance level depending the call you’re on.
✔️Fibonacci Retracement
Fibonacci retracement levels connect any two points that the trader views as relevant, typically a high point and a low point.
The percentage levels provided are areas where the price could stall or reverse. These levels should not be relied on exclusively,
so it is dangerous to assume that the price will reverse after hitting a specific Fibonacci level.
✔️Consolidations
A price consolidation is a period when the price is moving sideways without any significant advancement in the upward or downward direction. A price consolidation can take any form.
It could be a rectangular pattern (often called a range), any of the different types of triangle patterns, a rising or falling wedge, a pennant, or a flag.
Depending the pattern that takes place, you’re gonna look for entries and stop loss bellow pattern’s invalidation.
👤 @AlgoBuddy
📅 Daily Ideas about market update, psychology & indicators
❤️ If you appreciate our work, please like, comment and follow ❤️

Bitcoin Scalp Signal for Day Trading🖥️ We have determined there is a 65% chance Bitcoin will Rise from our current entry point.
📉 LONG - BTC : $20,710 📉
💵 Length of trade: we are expecting BTC to hit a $500 scalp, with a high end of $700, and a minimum expectation of $350.
🕰️ Duration of trade: we are expecting the minimum target to occur within 10 hours. Then we see the rest of this trade playing out around market open for NYSE. Tomorrow there is key economic data released before market open, which could cause big moves. Today the economic data caused a positive spike of 500pts, we will try to sell during this spike, if it occurs similar on Thursday.
📊🖥️ INDICATOR SHOWN ON CHART : Scot Signal Indicator

Bitcoin Scalping Signal for Day Trading🖥️ We have determined there is a 70% chance Bitcoin will RISE from our current entry point.
📉 LONG - BTC : $16,855 📉
💵 Length of trade: we are expecting BTC to hit a $200 scalp, with a high end of $300 - minimum expectation $125.
🕰️ Duration of trade: we are expecting BTC to try and retouch today's top, and then possibly continue its way up still till Friday.
📊🖥️ INDICATOR SHOWN ON CHART : Scot Signal Indicator

Bitcoin Day Trading Setups, Scalping Entries🖥️ We have determined there is a 75% chance Bitcoin will RISE from our current entry point.
📉 LONG - BTC : $16,605 📉
💵 Length of trade: we are expecting BTC to hit a $250 scalp, with a high end of $350 - minimum expectation $175.
🕰️ Duration of trade: we are expecting a possible fast spike going up 150-200pts, then BTC to makes its way up to the prior level 16.85-17k by market close Friday.
📊🖥️ INDICATOR SHOWN ON CHART : Scot Signal Indicator

Bitcoin Scalping Signal for Day Trading🖥️ We have determined there is a 70% chance Bitcoin will RISE from our current entry point.
📉 LONG - BTC : $16,821 📉
💵 Length of trade: we are expecting BTC to hit a $250 scalp, with a high end of $300 - minimum expectation $150.
🕰️ Duration of trade: we are expecting this to occur within a couple hours of market open Tuesday. And we can see this continuing until tomorrow. We are looking to a more positive week, pending no negative news impacts on the market.
📊🖥️ INDICATOR SHOWN ON CHART : Scot Signal Indicator

Bitcoin Day Trade Setups, Scalping Entries🖥️ We have determined there is a 65% chance Bitcoin will RISE from our current entry point.
📉 LONG - BTC : $17,810 📉
💵 Length of trade: we are expecting BTC to hit a $400 scalp, with a high end of $550 - minimum expectation $250.
🕰️ Duration of trade: we are expecting this to occur within a couple hours of market open Thursday. But we can see a fast spike up to 18k at anytime prior.
📊🖥️ INDICATOR SHOWN ON CHART : Scot Signal Indicator

Bitcoin Scalp Signal for Day Trading🖥️ We have determined there is a 60% chance Bitcoin will RISE from our current entry point.
📉 LONG - BTC : $16,785 📉
💵 Length of trade: we are expecting BTC to hit a $185 scalp, with a high end of $300 - minimum expectation $125.
🕰️ Duration of trade: we are expecting this to occur near, or after U.S. Market close. Then we see this trade playing out till U.S. markets open Wednesday. The Bitcoin market seems to be moving slower than usual at the moment
📊🖥️ INDICATOR SHOWN ON CHART : Scot Signal Indicator

Perfect Buy Points: The Power PlayJS-Masterclass #9:
Perfect Buy Points – The Power Play
In the recent tutorials we have some patterns leading to a Perfect Buy Point (Volatility Contraction Patterns, IPO’s – The Primary base).
In this tutorial we will cover the so called Power-Play.
Characteristics of a Power-Play:
1. An explosive price move on huge volume; the stock
shoots up 100% or more in less than 8 weeks.
2. The rapid price run-up could be induced by a major news
development such as an FDA drug approval, litigation
resolution, a new product or service announcement or
even an earnings report, or on no news at all.
3. The stock price then moves sideways in a relatively tight
range not correcting more than 20% over a period of 3-
6 weeks (some emerge after only 10 or 12 days).
Here are some examples:

Special Entry Patterns - IPO'sJS-TechTrading Masterclass : Special Entry Patterns - IPO's
In a previous tutorial, I have explained the general characteristics of a perfect buy point. In this tutorial, we will look at IPO's (Initial Public Offerings) and discuss how to identify primary bases.
IPO's coming out of primary bases can make huge price moves - let's discuss how to find the next monster mover, similar to what stocks like Amazon could achieve after their Initial Public Offering phase.
Perfect Entry Points – IPO’s – The Primary Base
When it comes to investing in IPO stocks, new issues don't play by the usual rules.
Companies making initial public offerings draw a lot of investor attention. That often results in unusual and brand-new chart patterns. Volatility can rise as investors size up demand for the new stock. Yet there are opportunities in these cases, if you can spot the correct characteristics amid the price-and-volume action.
The framework of a good IPO base is simple. The decline from peak to low usually doesn't top 20%, but the most volatile markets have produced declines of up to 50%. The length is often less than five weeks and can be as short as seven days. These two factors alone make IPO bases wayward cousins compared with proper bases, such as the cup with handle and flat base, which need at least five to seven weeks of work.
In an IPO base, the pattern typically starts within 25 days of the stock's first day of trading. Know the important similarities with regular bases. For example, the buy point is drawn by taking the prior high and adding 10 cents. The price gain on the breakout should be strong.
There are ways to evaluate these blind spots, however. Important factors include seeing a shallow correction within the base during normal market conditions, a large increase in price and a close near session highs on the breakout day, and heavy volume on the breakout day and week.
Also, the stock should generally form the base above its IPO price.
Example - ServiceNow (NOW)
The business software company, went public in June 2012, at 18 a share and has built its primary base during the period from the initial offering to April 2013 when the stock developed its first perfect buy point.

JS-Masterclass #6: The Perfect Buy PointThe Perfect Buy Point
A Perfect Buy Point represents the completion of a stock’s consolidation and the potential start of its next advance. After a base pattern has been established, the Perfect Buy Point is where the stock establishes a price level that will act as the trigger to enter a trade.
When a stock’s price level moves through the Perfect Buy Point, there is a high probability that this represents the start of the next advancing phase.
You can also call the Perfect Buy Point a “call to action” price level – it is the optimal buy point.
In the context of a stock’s Volatility Contraction Pattern, a temporary pause (also called a base building process) allows you to set a buy stop to enter a trade. You want to buy as close to thePerfect Buy Point as possible without chasing the stock up more than 1.0%. In this context, the use of buy stop limit orders is recommended.
As a solid consolidation process and the formation of a Volatility Contraction Pattern are needed before a Perfect Buy Point can occur, The Perfect Buy Point can also be considered as the line of least resistance. A stock can move very fast once it crosses this threshold. When a stock breaks through the line of least resistance, the probability is high that the price level will move much higher in a short period of time.
This is the case because this represents an area where supply is low. Therefore, even a small amount of demand can move the stock higher.
The importance of the Volume at the perfect Buy Point
A Volatility Contraction Pattern is needed before a Perfect Buy Point can develop. As explained earlier, supply will stop coming to market at the ed of a valid Volatility Contraction Pattern. This is why we want to see the Volume significantly come down in the day or the couple of days before the Perfect Buy Point develops.
Now, with only very little supply of stock in the market from sellers, even a small amount of buying can move the price up very rapidly as the price level moves through the Perfect Buy Point.
In the ideal case, this move through the perfect Buy Point occurs under heavily increasing volume. This might be an indication that big institutions are putting their big money into the stock.
When all of this comes together, you want to place the order as close to the Perfect Buy Point as possible.
Always wait for the price level to move through the Perfect buy Point!
Some traders will try to get in before the breach of the pivot point to save a few pennies on the trade. Assuming that a stock will break out is dangerous and the breakout may fail. Be patient!
Remember
Even if you respect all these technical requirements of a Perfect Buy Point, you will still get stopped out and incur losses.
BUT: Trading is all about probabilities…respecting these rules will increase your probability to enter profitable trades and significantly outperform other traders and increase your chances to be consistently profitable in the market.
