Weekly US Market Outlook – SPY, QQQ, DXY, VIX (30 NOV)Weekly US Market Outlook – SPY, QQQ, DXY, VIX
Bullet points:
Market sentiment turned bullish again as the probability of a December Fed rate cut climbed to 87%.
Fear & Greed Index recovered from extreme fear (9) to 24.
Options sentiment still signals extreme fear → room for upside continuation.
DXY remains bearish until 99, supporting risk assets.
VIX continues to decline toward 15.70–14.20, but these levels historically precede sharp corrections.
Heavy data week ahead (ADP, Jobless Claims, PCE) → major volatility drivers.
SPY targets 690 → 700 zone; QQQ targets 625 → 637 → 647.5.
Market Sentiment
Market sentiment has shifted decisively toward a bullish stance after the probability of a December rate cut surged back to 86%. Markets are now pricing in one more cut before 2026, creating a supportive macro backdrop for equities. At the same time, the Fear & Greed Index has rebounded from extreme fear levels of 9 to 24, indicating a slow but clear improvement in risk appetite.
Stronger than expected earnings from NVDA continue to reinforce the narrative that the AI cycle is intact and far from bubble conditions. Additionally, easing geopolitical tensions specifically the US–China trade agreement have reduced risk premia across global markets. Taken together, these developments support a short to mid term bullish environment and increase the likelihood of a Santa Rally.
Options Sentiment
Despite improving market sentiment, options markets remain deeply positioned in the extreme fear zone. This divergence between spot indices and options positioning typically suggests that market participants remain hedged or underexposed, allowing equities to extend higher as positioning normalizes. In other words, options sentiment indicates there is still significant room for markets to explore higher price levels.
DXY – US Dollar Index
Monitoring the DXY is essential because of its direct correlation with risk assets. A rising dollar weighs on equities, while a declining dollar supports them. The DXY was rejected at the 100.30 level and is now retracing toward the HTF Key Zone, highlighted around 99.
My base case is a move down into the 99 region, followed by short term accumulation and a potential bounce back above this level. Until DXY reaches 99, the trend remains bearish, which historically provides strong support for equities, commodities, and other USD sensitive assets.
VIX – Volatility Index
VIX, which reflects S&P 500 options based volatility expectations, has been declining since the November 21 peak, which aligned with the recent local bottom in the S&P 500. I expect VIX to continue trending lower toward 15.70 and potentially 14.20 levels previously associated with S&P 500 all time highs.
However, it is crucial to note that when VIX reaches these zones, markets often experience rapid and unexpected corrections. Therefore, while volatility compression favors short-term bullish continuation, the risk of a sharp reversal increases as VIX approaches these historically significant thresholds.
Upcoming Data Releases
A high-impact macro week is ahead, especially between Wednesday and Friday. The key releases include:
ISM Manufacturing PMI – Monday
JOLTS Job Openings – Tuesday
ADP Nonfarm Employment – Wednesday
Services PMI – Wednesday
ISM Non-Manufacturing PMI – Wednesday
Initial Jobless Claims – Thursday
PCE Inflation (September, delayed) – Friday
Michigan Consumer Sentiment – Friday
The most influential dataset will be the combination of ADP Employment, Initial Jobless Claims, and PCE Inflation. If labor data comes in stronger than expected, the Fed may interpret it as a sign of a resilient labor market reducing the need for additional cuts. Conversely, if PCE inflation comes in hotter than expected, policymakers may see it as a reason to delay cuts.
Given that this PCE print is delayed due to the U.S. government shutdown, the market reaction may be muted, but it still matters for the December policy narrative.
SPY Weekly Outlook – Prediction
In my opinion, SPY is positioned to target new all time highs early in the week. Price may first test 686, followed by a brief retracement or consolidation, and then continue higher toward 690, marking a fresh ATH. Under strong bullish momentum, SPY may extend into the 700 zone by the end of the week. These levels represent the primary upside targets I will be monitoring closely.
QQQ Weekly Outlook – Prediction
QQQ remains structurally weaker than SPY, yet it also maintains strong bullish momentum. The 617 level is a key zone for potential call entries. Price may initially target 625, where a short term rejection could occur, followed by a small pullback. Afterward, QQQ could advance toward its all time high at 637, and in a stronger continuation scenario, possibly extend to 647.5.
Conclusion
Overall, market conditions have turned constructive again. Sentiment is stabilizing, central bank expectations are supportive, volatility is compressing, and the dollar remains weak all providing a tailwind for equities. This week’s heavy macro calendar may bring volatility spikes, but unless data significantly challenges the rate cut narrative, both SPY and QQQ appear positioned to continue their upward trajectory toward new highs.
⚠️ This analysis is for educational purposes only and does not constitute financial advice. Always conduct your own research before trading or investing.
Equties

Weekly QQQ (US100) Outlook - Prediction (09 NOV)Weekly QQQ Outlook - Prediction (09 NOV)
📊 Market Sentiment
Market sentiment remains slightly bearish as expectations for a December rate cut may be postponed into 2026. We have seen some sell-offs, likely due to hedging or profit-taking activity. However, the market experienced a healthy bounce last Friday, as anticipated in my previous Daily SPY Outlook on November 7.
Today, Trump announced that American citizens, excluding high-income individuals, will receive a $2,000 payment. This news could inject additional liquidity into risk assets, similar to what occurred during his first term. In my opinion, this development may create a short-term bullish narrative for the markets.
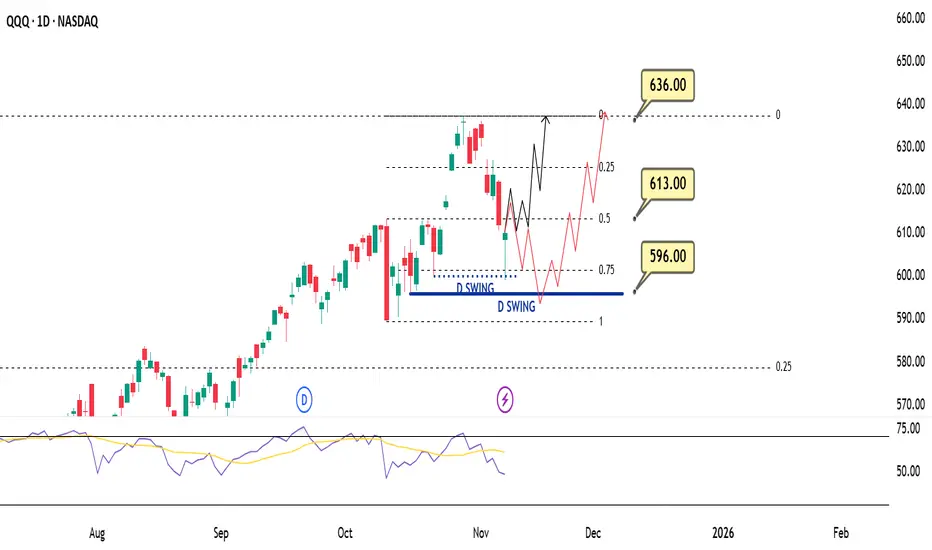
📈 Technical Analysis
Price retraced throughout the week and reached the 600 level. The 601 zone represents the most discounted range (based on my quarterly range theory, 0.75 fib level), which I consider an optimal buy area. This level also aligns with daily swing liquidity, and the recent reaction suggests a potential move toward new all-time highs.
📌 Game Plan
I’m considering two possible scenarios for this week:
Scenario 1 (Black Line):
In my opinion, the price now has enough momentum to extend higher and create new all-time highs. Therefore, I’ll be watching for a daily close above the 613 level. If confirmed, I plan to buy QQQ calls targeting new highs.
Scenario 2 (Red Line):
If the price fails to close above 613, it may indicate that more accumulation is needed before another upward move. In that case, I’ll look to short (buy puts) toward the 596 level and observe whether we can bounce from there. Should that happen, I’ll then switch to calls and target higher prices.
💬For detailed insights and broader market context, please check my Substack link in profile.
⚠️ For educational purposes only. This is not financial advice.
Prediction for Jackson Hole (Fed) Announcement 🏛️ Chairman Powell will be speaking Friday 10am EST.
Leading up to these speeches, BTC has fallen ↘️ then rose strongly ⬆️
We like BTC for more upside, but there could be some regression leading up to this event.
If Powell says something unexpected, it will lead BTC & Equities to fall heavily for the weekend.
🕊️ - WE PERSONALLY FEEL - 🕊️
Powell will speak more softly on the economic state. Leading to a strong outcome for BTC & Equities

AMZN D1 - Long SetupAMZN D1
Again, a very similar structure to what we are expecting with the DCA entries in the Crypto space, $3180 initially and then between that $3000 and $2950 support region.
All details and explanations included in the US stock rundown posted above. With these US stocks there are measurable trading opportunities for swing positions, but also long term investment holds.

VINCI SA (DG.pa) bullish scenarioThe technical figure Flag can be found in French company Vinci S.A.(DG.pa) at daily chart. Vinci, corporately styled VINCI, is a French concessions and construction company. Vinci is listed on Euronext's Paris stock exchange and is a member of the Euro Stoxx 50 index. The Flag has broken through the resistance line on 29/07/2021, if the price holds above this level you can have a possible bullish price movement with a forecast for the next 9 days towards 92.93 EUR. Your stop loss order according to experts should be placed at 85.15 EUR if you decide to enter this position.
Risk Disclosure: Trading Foreign Exchange (Forex) and Contracts of Difference (CFD's) carries a high level of risk. By registering and signing up, any client affirms their understanding of their own personal accountability for all transactions performed within their account and recognizes the risks associated with trading on such markets and on such sites. Furthermore, one understands that the company carries zero influence over transactions, markets, and trading signals, therefore, cannot be held liable nor guarantee any profits or losses.

SocGen (GLE.pa) bullish scenarioThe technical figure Channel Down can be found in French company Societe Generale (GLE.pa) at daily chart. Société Générale S.A., often nicknamed "SocGen", is a French multinational investment bank and financial services company headquartered in Paris, France. The company is a universal bank and has divisions supporting French Networks, Global Transaction Banking, International Retail Banking, Financial Services, Corporate and Investment Banking, Private Banking, Asset Management and Securities Services. The Channel Down has broken through the resistance line on 27/07/2021, if the price holds above this level you can have a possible bullish price movement with a forecast for the next 11 days towards 25.815 EUR. Your stop loss order according to experts should be placed at 22.820 EUR if you decide to enter this position.
Risk Disclosure: Trading Foreign Exchange (Forex) and Contracts of Difference (CFD's) carries a high level of risk. By registering and signing up, any client affirms their understanding of their own personal accountability for all transactions performed within their account and recognizes the risks associated with trading on such markets and on such sites. Furthermore, one understands that the company carries zero influence over transactions, markets, and trading signals, therefore, cannot be held liable nor guarantee any profits or losses.

SPX Bullish Correction for Higher?Here is my first scenario for the current market condition with about a 30-day outlook. It's probable that we started a new 5 wave cycle off the pandemic low and are now in the 4th wave correction. We also have bearish rsi divergence at play on the daily. I do have an alternate scenario that would far more bearish than this one. If I have time and this idea gets some likes and traction I'll post the second scenario. Or, if you would like to see it then ask in the comment section.


Short JPN225 @ 21,956; TP @ 21,077, SL your choiceShort JPN225 @ 21,956; TP @ 21,077, SL your choice

BABA ForecastSimple charting exercise for NYSE:BABA heading into its upcoming earnings. Will be interesting to see how the trade war and in particular the weakening of the RMB may have affected earnings.

US30 H&S on Daily Chart? Head and Shoulders could be forming at the daily chart . A lot of noise surrounding US economy. China trade war was already bad news for the currency and then Mexico talks this weekend. After bad month opening for the equities market. I will be expecting a retracement back to the neckline caused by oil rise and then short. What do you think? Is it a valid formation?
