

VINCI SA
No trades
No trades
Compare with Vinci
9.10 EUR
4.90 B EUR
75.37 B EUR
475.29 M
Next report date
—
Report period
—
EPS estimate
—
Revenue estimate
—
Company info
Sector
Industry
CEO
Pierre Anjolras
Website
Headquarters
Nanterre Cedex
Founded
1899
IPO date
Jan 7, 1985
ISIN
FR0000125486
FIGI
BBG000BDXBJ7
Identifiers
ISIN FR0000125486
VINCI SA engages in the design, building, finance, and management of facilities for transport systems, public and private buildings, urban development, water, energy, and communication networks. It operates through the following business segments: Concessions, Energy, and Construction. The Concessions segment develops and operates motorway, transport infrastructures, and public facility concessions. The Energy segment provides services in the energy sector, manufacturing and energy-related services. The Construction segment handles major projects, specialty networks, and proximity. The company was founded by Alexandre Giros and Louis Loucheur in 1899 and is headquartered in Nanterre Cedex, France.

VINCI SA (DG.pa) bullish scenarioThe technical figure Flag can be found in French company Vinci S.A.(DG.pa) at daily chart. Vinci, corporately styled VINCI, is a French concessions and construction company. Vinci is listed on Euronext's Paris stock exchange and is a member of the Euro Stoxx 50 index. The Flag has broken through the
Long
Evolution Of Vinci Stocks'This share is showing a good potential in the French market.
It could hit the $104 in the next 3 months.
Long
Strong resistance on 96€ and ascending triangleWe can see DG has failed several times to break through the 96€ resistance.
We also are in an ascending triangle configuration which often leads to negative tendency.
In absence of good news that are not already priced by the markets I think of a short strategy of a part of the stocks under 96€ and
Short
Vinci - DG• Nice uptrend in the last days and weeks
• Nice flagpole followed by a pennant in the short-term chart (left side)
• Formation price target 112.22
• Nice flag followed by an upward move in the long-term chart (right side); currently there is a consolidation after closing the gap from beginning marc
Long
divergence haussière H4on peut voir une divergence haussière en H4, plus une formation de triangle ascendant.
Long
Short Vinci on premice of adistribution phase ?Prices have reached the highest level from early June @90.48.
This limit may be a strong resistance. After the surge of more than 20% this week a distribution phase is likely to occur with prices trading in a range from 83 to 90.
I don't know what will happen. But as prices don't break any support
Short
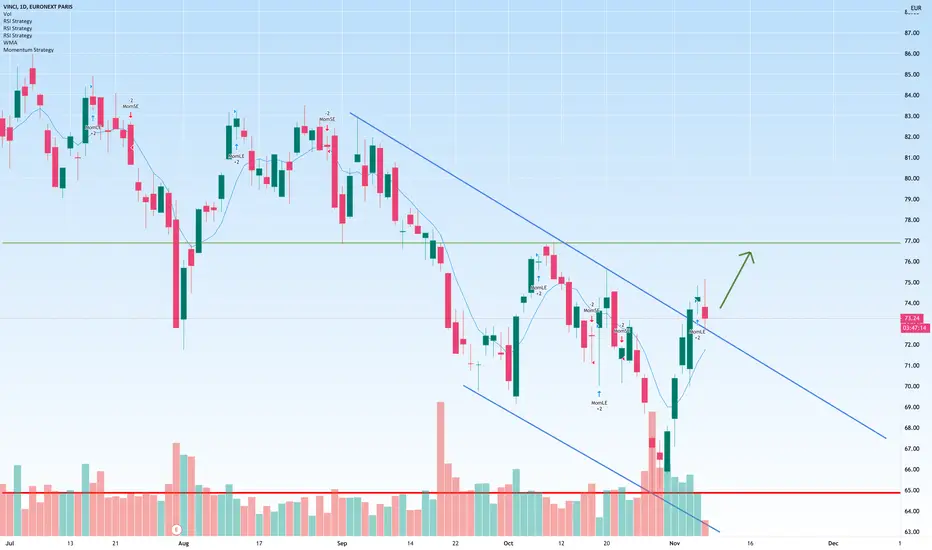
DG.pa bullish scenario:DG.pa bullish scenario:
We have technical figure Channel Down in French company Vinci SA (DG.pa) at daily chart. Vinci, corporately styled VINCI, is a French concessions and construction company founded in 1899 as Société Générale d'Enterprises. Its head office is in Rueil-Malmaison, in the western
 Long

See all ideas
Summarizing what the indicators are suggesting.
Neutral
Neutral
Neutral
An aggregate view of professional's ratings.
Neutral
Neutral
Neutral
Displays a symbol's price movements over previous years to identify recurring trends.
Maturity dateJun 30, 2034
Coupon7.00% (Fixed)
Maturity dateSep 15, 2034
Coupon2.75% (Fixed)
Maturity dateApr 10, 2029
Coupon3.75% (Fixed)
Maturity dateMar 15, 2027
Coupon2.25% (Fixed)
Maturity dateJan 19, 2033
Coupon3.25% (Fixed)
Maturity dateMar 6, 2033
Coupon3.13% (Fixed)
Maturity dateFeb 2, 2033
Coupon3.88% (Fixed)
Maturity dateJan 19, 2034
Coupon3.38% (Fixed)
Maturity dateSep 2, 2032
Coupon2.75% (Fixed)
Maturity dateOct 17, 2032
Coupon3.38% (Fixed)
Maturity dateMay 19, 2031
Coupon1.00% (Fixed)
See all DG bonds


Frequently asked questions
The current price of DG is 106.15 EUR — it has increased by 1.14% in the past 24 hours. Watch VINCI SA stock price performance more closely on the chart.
Depending on the exchange, the stock ticker may vary. For instance, on EURONEXT exchange VINCI SA stocks are traded under the ticker DG.
DG stock has fallen by −3.96% compared to the previous week, the month change is a −6.07% fall, over the last year VINCI SA has showed a −10.95% decrease.
We've gathered analysts' opinions on VINCI SA future price: according to them, DG price has a max estimate of 163.50 EUR and a min estimate of 123.00 EUR. Watch DG chart and read a more detailed VINCI SA stock forecast: see what analysts think of VINCI SA and suggest that you do with its stocks.
DG stock is 1.57% volatile and has beta coefficient of 1.19. Track VINCI SA stock price on the chart and check out the list of the most volatile stocks — is VINCI SA there?
Today VINCI SA has the market capitalization of 59.30 B, it has decreased by −1.02% over the last week.
Yes, you can track VINCI SA financials in yearly and quarterly reports right on TradingView.
VINCI SA is going to release the next earnings report on Feb 10, 2027. Keep track of upcoming events with our Earnings Calendar.
DG earnings for the last half-year are 3.70 EUR per share, whereas the estimation was 3.54 EUR, resulting in a 4.37% surprise. The estimated earnings for the next half-year are 5.71 EUR per share. See more details about VINCI SA earnings.
VINCI SA revenue for the last half-year amounts to 35.60 B EUR, despite the estimated figure of 35.07 B EUR. In the next half-year revenue is expected to reach 41.00 B EUR.
DG net income for the last half-year is 2.08 B EUR, while the previous report showed 3.01 B EUR of net income which accounts for 0.00% change. Track more VINCI SA financial stats to get the full picture.
Yes, DG dividends are paid semi-annually. The last dividend per share was 3.95 EUR. As of today, Dividend Yield (TTM)% is 4.68%. Tracking VINCI SA dividends might help you take more informed decisions.
VINCI SA dividend yield was 4.16% in 2025, and payout ratio reached 57.11%. The year before the numbers were 4.76% and 55.69% correspondingly. See high-dividend stocks and find more opportunities for your portfolio.
As of Oct 5, 2026, the company has 294 K employees. See our rating of the largest employees — is VINCI SA on this list?
EBITDA measures a company's operating performance, its growth signifies an improvement in the efficiency of a company. VINCI SA EBITDA is 13.66 B EUR, and current EBITDA margin is 17.57%. See more stats in VINCI SA financial statements.
Like other stocks, DG shares are traded on stock exchanges, e.g. Nasdaq, Nyse, Euronext, and the easiest way to buy them is through an online stock broker. To do this, you need to open an account and follow a broker's procedures, then start trading. You can trade VINCI SA stock right from TradingView charts — choose your broker and connect to your account.
Investing in stocks requires a comprehensive research: you should carefully study all the available data, e.g. company's financials, related news, and its technical analysis. So VINCI SA technincal analysis shows the sell today, and its 1 week rating is sell. Since market conditions are prone to changes, it's worth looking a bit further into the future — according to the 1 month rating VINCI SA stock shows the sell signal. See more of VINCI SA technicals for a more comprehensive analysis.