S&P500 This is the level that confirms the Bear Cycle.The S&P500 (SPX) has reached a point where it could be on the verge of initiating a new Bear Cycle as the price action that led to the end of 2025 (mostly Q4) has been very similar with the one in late 2021 that kick-started the 2022 Bear Cycle.
What confirmed that Bear Cycle was the market closing a 1W candle below the 1D MA100 (red trend-line). This is extremely critical as it has already proven its role as a catalyst during the most recent short-term pull-back in November, where it held upon tested on the week of November 17 2025 and thus rebounded. This is exactly what took place in November 2021, with the index eventually closing a 1W candle below the 1D MA100 almost 2 months later on the week of January 17 2022. That confirmed the 2022 Bear Cycle as the sell-off was accelerated and in just 1 week, the market even hit the 1W MA50 (blue trend-line).
The structure between the two fractals is so far very similar, with a huge 1W RSI Bearish Divergence (Lower Highs against price's Higher Highs) leading the index towards a potential Top. If the price action continues to repeat that of 2022, then we are looking at the very real possibility of a -27.60% overall correction within roughly 12 months time, with the first potential Target being the 1W MA200 (orange trend-line) around 5350 and second the full -27.60% extension at 5050. Those two levels technically form the potential Buy Zone for the next Bull Cycle.
The metric though that cannot be ignored as far as long-term buying is concerned, is the 1W RSI, which has historically given optimal buy opportunities when it turned oversold (i.e. 30.00 or below). If this level is hit before any of the above two Targets, we will be turning into long-term buyers again regardless.
---
** Please LIKE 👍, FOLLOW ✅, SHARE 🙌 and COMMENT ✍ if you enjoy this idea! Also share your ideas and charts in the comments section below! This is best way to keep it relevant, support us, keep the content here free and allow the idea to reach as many people as possible. **
---
💸💸💸💸💸💸
👇 👇 👇 👇 👇 👇
S&P 500 E-Mini Futures

ES (SPX, SPY) Fundamental Analysis for Wed Jan 7As we head into Wednesday's session, the S&P 500 E-mini futures are testing significant resistance at the prior day's highs, reflecting a strong rebound from the lows observed last week. The current market landscape is marked by various challenges, including a divided Federal Reserve, softening labor data, and emerging geopolitical tensions, particularly related to U.S. military actions in Venezuela.
The Federal Reserve is maintaining its interest rates at the 3.50%-3.75% range after a 25 basis point cut in December. Internal divisions within the Fed have become increasingly apparent, with some members advocating for more substantial cuts while others are in favor of holding rates steady. Currently, the market assigns roughly a 15% chance of a rate cut in January, with the next Federal Open Market Committee (FOMC) meeting scheduled for January 27-28.
The minutes from December's meeting revealed growing concerns over short-term funding stress and the potential for abrupt market volatility, spurring discussions regarding the possibility of Treasury purchases to enhance liquidity in the financial system.
Data Catalyst Update
ADP Employment Change (Released at 8:15 AM ET)
- Actual: +41K
- Forecast: +50K
- Previous: -32K
Today's ADP Employment change shows a modest miss, reflecting a labor market that is recovering yet remains soft. While this figure is an improvement from November's contraction, it falls short of expectations. This outcome supports the view of a gradual cooling in the labor market without signaling an imminent recession. The reading is mildly dovish for the Federal Reserve's policy stance and offers limited directional clarity ahead of Friday's Non-Farm Payrolls report.
ISM Services PMI (Scheduled for 10:00 AM ET)
- Forecast: ~53.0
- Previous: 52.6
The ISM Services PMI is the key market-moving release of the day. Given that the services sector accounts for approximately 70% of U.S. economic activity, the implications of this report are significant. A reading below 50 would indicate contraction and likely trigger risk-off sentiment in the markets. Conversely, a robust reading above 54 could reignite concerns about hawkish Fed policies, putting pressure on equities. The ideal scenario for market bulls would be a print that comes in line with expectations or slightly soft, thereby sustaining the narrative of a "soft landing."
Additional Releases of Note:
- Factory Orders (10:00 AM): Expected -1.2%
- JOLTS Job Openings (10:00 AM): Expected 7.64M, down from prior 7.67M
- Fed Vice Chair Bowman to speak at 4:10 PM
LABOR MARKET CONTEXT
In the last week of 2025, initial jobless claims fell to 199,000, marking the lowest level since early last year. This decline indicates a resilient labor market, even as the unemployment rate has risen to 4.6% in November—the highest rate since September 2021. This uptick can be attributed primarily to federal workforce reductions linked to ongoing government restructuring efforts.
Overall, the labor market appears stable, characterized by low hiring and equally low firing rates. Continuing claims have increased to 1.92 million, underscoring the reality that although layoffs have remained subdued, job seekers are facing extended search periods. The upcoming Non-Farm Payroll (NFP) report, with a forecast of approximately 55,000 new jobs, will offer crucial insights into the employment landscape for December.
GEOPOLITICAL RISK
The recent U.S. capture of Venezuelan President Nicolás Maduro has injected a new layer of uncertainty into the geopolitical landscape. In the wake of this development, Washington has announced plans to take temporary control of Venezuela while facilitating the involvement of U.S. energy firms in the exploration and development of the country’s vast oil reserves—the largest in the world. This situation has led to a modest uptick in demand for the dollar as a safe haven, while simultaneously increasing volatility within energy markets.
From an equities perspective, this scenario presents a short-term challenge as investors grapple with the implications of U.S. access to Venezuelan oil. However, should this development result in a significant increase in oil supply, it could ultimately have disinflationary effects.
CURRENCY & RATES
The EUR/USD exchange rate has retraced to the 1.1685-1.1700 range after failing to maintain momentum above the 1.1800 threshold. While the dollar is finding some support driven by geopolitical flows, it remains fundamentally weak in light of expectations for Federal Reserve easing. The DXY index is currently hovering around 98.25, notably below the recent high of 100.40.
On the European front, German inflation has come in at 1.8%, marking the first dip below the European Central Bank’s 2% target since September 2024. This development effectively reduces the likelihood of any near-term ECB interest rate hikes, maintaining the narrative of policy divergence between the ECB and other central banks.
In the bond markets, a rally occurred overnight as yields fell, reflecting a shift in investor risk positioning as they look ahead to 2026.
Market Structure Analysis
ES futures closed Tuesday at 6,988.25, marking a notable rebound from Monday's low of 6,931. This upward movement has brought prices near key resistance levels established in the prior week and quarter, specifically between 6,991 and 6,995. This zone represents a significant confluence of resistance.
While daily oscillators indicate elevated levels, they do not yet reach extremes, allowing for the possibility of continued upward momentum should this resistance be surpassed. The overarching trend remains bullish, underscored by a series of higher highs since the lows observed in October. However, an analysis of the 4-hour and 1-hour timeframes reveals overbought conditions, which typically signal a need for consolidation or a potential pullback.
Market Outlook: Neutral-to-Bullish with Anticipated Pullback
The current macroeconomic landscape favors equities, as the Federal Reserve adopts a more accommodative stance, inflationary pressures appear to be easing, and while the labor market remains stable, signs of cooling are evident. However, market positioning has grown extended near resistance levels, and the upcoming ISM report introduces potential volatility.
From a bullish perspective, an ideal scenario would see a quick dip in response to the ISM data, targeting the 6,960-6,970 support zone. Such a pullback could facilitate institutional buying before the market resumes its upward trajectory. A sustained move above 6,995 would pave the way toward the psychologically significant 7,000 mark and possibly higher.
Key Risk Factors to Watch:
- A surprisingly strong ISM reading (greater than 55) could reignite hawkish concerns from the Fed.
- Ongoing tensions in Venezuela could introduce additional market uncertainties.
- Pre-NFP positioning may lead to increased market volatility and choppy trading conditions.
Bottom Line
Today's market outlook is largely shaped by the upcoming 10:00 AM release of the ISM Services index, which is expected to bring significant volatility. The recent ADP employment report, which fell short of expectations, did not stir up much reaction, leading to a market that remains in a cautionary holding pattern around key resistance levels.
Traders should be watchful for potential trading opportunities, particularly during any pullbacks to the value-area support. Current higher-timeframe trends suggest a preference for buying on dips rather than pursuing breakouts at these elevated levels.
Key Levels to Monitor:
- Support: 6,959 - 6,972
- Resistance: 6,991 - 7,000

ES (SPX, SPY) Analysis, Levels, Setups for Tue (Jan 6)U.S. stock markets closed on a positive note today, buoyed primarily by gains in the energy sector and large banking institutions. This upside was propelled by headlines related to Venezuela, which invigorated both the energy market and investor risk sentiment. Meanwhile, the ISM Manufacturing Index for December showed a contraction, remaining below the 50 threshold, which reinforces the narrative of uneven economic growth and places increased emphasis on upcoming services data scheduled for release later this week.
Looking Ahead to Tuesday:
The macroeconomic calendar for Tuesday appears relatively light, suggesting that the equity markets may engage in a more directional trading pattern unless unexpected geopolitical developments emerge overnight. The primary risk window looms larger later in the week with significant reports on ADP employment, ISM Services, and the EIA energy outlook, culminating in the Nonfarm Payrolls report.
Overnight Outlook into New York:
The most probable scenario sees a rotation around the 6948.50 level (VWAP), with a two-sided trading dynamic expected. Key support is identified at the 6942.50/6940.00 range, while the first resistance ceiling is placed between 6955.25 and 6963.50. A bullish scenario would emerge with a stable hold above 6942.50 and a successful move through 6955.25, paving the way toward the 6963.50 resistance level and beyond. Conversely, bearish pressure may materialize if the index falls below 6940.00, with a failure to reclaim 6942.50 potentially exposing levels around 6932.75 and the 6912.75-6906.00 range.
Trade Setups for Tomorrow
A++ Long Setup (Preferred):
Entry: 6932-6935 (PDL / NYAM.L test)
Stop: 6927
Target: 6948-6955
B+ Short Setup (Fade Rally) :
Entry: 6950-6955 (VWAP / Y-POC rejection)
Stop: 6960
Target: 6935-6940
Deep Discount Long (If Major Flush):
Entry: 6906-6912 (LO.H / AS.H zone)
Stop: 6900
Target: 6940-6950
Good Luck !!!

ES (SPX, SPY) Analysis Week-ahead from Jan 5 to Jan 9, 2026Multi-Timeframe Market Analysis
Weekly Overview: The Big Picture
The E-mini S&P 500 (ES) continues to demonstrate an uptrend on a macro scale, characterized by a series of higher highs and higher lows. However, the recent market activity has resembled a gradual grind near the upper boundaries of a multi-month trading range—a behavior often referred to as “premium.” This indicates a slowdown in upward momentum, with pullbacks becoming increasingly pronounced. While the market does not exhibit extreme overbought conditions, the acceleration seen in prior weeks has noticeably diminished.
Daily Trend and Range Dynamics
On a daily basis, the market is operating within an upward trend that is currently exhibiting range-bound characteristics. We are witnessing repeated attempts to test the upper supply zone around the 6980-7000 level, followed by mean reversion toward the mid-to-lower 6900s. The latest daily swing reflects a pullback from this upper band, positioning prices now towards the center of this range, where liquidity zones take precedence over simply chasing trends.
4-Hour Perspective: Impulse vs. Correction
Analyzing the 4-hour chart reveals a distinct corrective move followed by a rebound that has yet to solidify a sequence of higher highs. While the overarching weekly trend remains bullish, the current 4-hour action feels more like a rebound effort, with the market in a phase of "repair" after experiencing a sharp decline.
1-Hour Intraday Context
At the intraday level, the latest 1-hour movement reflects a rebound from the lower 6800s towards the resistance zone in the low-to-mid 6900s. This places traders in a critical “decision zone” as we enter Monday's session, where the market faces a pivotal moment: it must either reclaim and sustain levels above these key resistance shelves (indicating bullish continuation) or risk further fading of rallies, which would suggest a return to range-bound or corrective trading.
Oscillator and Momentum Indicators (Weekly and Daily)
From a momentum perspective, the weekly oscillators point to a constructive yet cooling outlook, lacking signs of a fresh breakout structure. Daily momentum indicators are closer to neutral territory, indicative of a market that appears to be in a wait-and-see mode, poised for a catalyst to determine its next direction.
Volatility Metrics Analysis
VIX Overview
The CBOE Volatility Index (VIX) closed the previous session at 14.51, reflecting a decline throughout the day.
VIX Term Structure
The VIX term structure remains in contango, with an upward-sloping curve indicating that implied volatility is anticipated to rise over the coming months. Specifically, the implied volatility for January sits at 12.55, February at 15.38, and March at 17.34, with further increases projected for later months. This pattern is typically indicative of stable market conditions, suggesting that volatility is being priced higher down the line compared to the present.
Rates Volatility (MOVE)
The MOVE Index, which measures volatility in interest rates, is currently at 62.36 as we approach market close, also reflecting a decrease on the day. This level does not indicate significant stress within the market, aligning more with an environment in which investors are not exhibiting panic regarding interest rate fluctuations.
Options and Positioning Overview
Current Put/Call Ratios (Latest Daily Figures)
- Total Put/Call: 0.83
- Index Put/Call: 1.08
- ETP Put/Call: 0.85
- Equity Put/Call: 0.56
Analysis: The equity flow currently exhibits a call-leaning sentiment, as indicated by the lower equity put/call ratio. In contrast, index hedging remains active, with the index put/call ratio above 1. This duality is characteristic of late-cycle market behavior, where investors often purchase upside in individual stocks while simultaneously maintaining protective index hedges.
10-day Moving Average of Put/Call Ratios
Unfortunately, a definitive and authoritative 10-day moving average for the total put/call ratio is not readily available from the sources providing daily data in a machine-readable format. While the daily figures presented are confirmed, the 10-day averages cannot be securely sourced at this time.
SKEW - Tail Risk Pricing
The SKEW index closed at 141.86, a figure that Cboe describes as reflective of the pricing dynamics surrounding out-of-the-money SPX options, particularly those associated with tail risk. Typically, values for SKEW fluctuate within the 100-150 range. The implication is clear: despite a calm front-end volatility environment (as suggested by VIX levels), tail hedges are attractively priced.
Dealer Gamma Insights
Considering the current landscape of low spot volatility coupled with contango and a modest equity put/call ratio, market conditions suggest that dip buyers may defend the initial downside levels effectively. However, the elevated SKEW indicates that the demand for downside tail protection is increasing, meaning that if the market breaches key support levels (S4), panic-induced hedging activity could accelerate rapid downward movements. This interpretation is based on the metrics discussed and does not represent direct insights from dealer positioning.
Market Breadth and Internals Analysis
Advancers vs. Decliners (NYSE)
On January 2, 2026, the New York Stock Exchange recorded 1,882 advancing issues compared to 882 declining ones.
Breadth Oscillator (McClellan)
The NYSE’s McClellan Oscillator is currently at -18.826, a notable improvement from -76.414 previously. This indicates that while breadth remains slightly negative, the recent uptick suggests a reduction in selling pressure.
Sector Performance Snapshot
Recent market activity has highlighted leadership in the energy sector, along with notable strength in semiconductor stocks, while consumer segments have lagged behind. Should this trend continue, it would support a “grind/range” market environment rather than a drastic “waterfall selloff,” unless unexpected macroeconomic events disrupt the landscape.
Market Dynamics: Minor Wobble vs. Distribution Day
With breadth showing signs of improvement and credit markets not exhibiting significant stress, the current evidence leans towards a “minor wobble/consolidation” scenario rather than a full-scale distribution. This outlook holds, provided that key support levels remain intact and market internals do not deteriorate concurrently.
Credit and Funding Overview
High Yield ETFs
- HYG: 80.67
- JNK: 97.24
High Yield Spreads (OAS)
As of the last available print on December 31, 2025, the ICE BofA US High Yield OAS stands at 2.81%. This level is considered tight and typically signifies “orderly credit” conditions. It is important to monitor these spreads closely; a sharp widening could signal increased risk aversion, which often leads to more significant pullbacks in equity markets.
Sentiment and Crowd Positioning
AAII Sentiment (Latest)
- Bullish: 42.0%
- Neutral: 31.0%
- Bearish: 27.0%
The current sentiment readings indicate a notable tilt toward optimism. While this sentiment alone does not serve as a reliable timing mechanism for market reversals, it effectively diminishes the “wall of worry” that frequently fuels market squeezes.
Cross-Asset and Global Risk Tone
Crypto (Risk-On Proxy)
- BTC: 91,314
- ETH: 3,137.63
The resilience in cryptocurrency prices typically reflects a broader risk-on sentiment, although it should be noted that this is not a definitive indicator for daily movements in equities.
ES vs. NQ Relative Strength
The Nasdaq (NQ) continues to exhibit higher beta characteristics. If NQ consistently underperforms during market rallies, it may hinder attempts for the S&P 500 (ES) to push through resistance levels at R1 and R2.
Scheduled Events(ET):
Mon Jan 5
• 10:00 AM - ISM Manufacturing PMI (Dec)
Tue Jan 6
• 9:45 AM - S&P Global Final Services PMI (Dec)
Wed Jan 7
• 8:15 AM - ADP Employment Change (Dec)
• 10:00 AM - ISM Services PMI (Dec)
• 10:00 AM - JOLTS Job Openings (Nov)
• Late afternoon - Fed speaker risk (watch headlines)
Thu Jan 8
• 8:30 AM - Weekly Unemployment Claims
• 8:30 AM - Productivity and Unit Labor Costs (Q3)
Fri Jan 9 (highest impact)
• 8:30 AM - Nonfarm Payrolls, Unemployment Rate, Average Hourly Earnings
• 10:00 AM - University of Michigan Consumer Sentiment (prelim)
Two A++ setups (Level-KZ Protocol 15/5/1)
A++ Setup 1 - Rejection Fade Short (R1/R2 cap)
Entry: 6934.75-6937.50
Hard SL: 6946.25 (above the 15m rejection wick)
TP1: 6906.50 (S1)
TP2: 6889.50 (S3 top)
TP3: 6875.50 (S4 top)
Invalidation: 15m acceptance above 6940.75 and holding (no immediate snapback)
A++ Setup 2 - Bounce Long (S4 defend)
Entry: 6869.00-6876.00
Hard SL: 6859.75 (below the reclaim wick and below 6861.75 fib magnet)
TP1: 6902.75 (S1)
TP2: 6938.50 (R1)
TP3: 6982.50 (R3 first tag)
Invalidation: 15m bodies holding below 6866.75
Good Luck !!!

NASDAQ: Support at 25.333? Be Prepared To Buy!Welcome back to the Weekly Forex Forecast for the week of Jan. 5 - 9th.
In this video, we will analyze the following FX market: NASDAQ (NQ1!) NAS100
The NASDAQ is inn a narrowing range, but bullish overall. Last week it closed a bearish Weekly candle.
Is the weakness over? The answer is not obvious, but there are structural clues that show price may find support at the +OB highlighted in the video. Let's see if the market shows respect to the order block and uses it as support for higher prices.
If the market continues to trade into the +OB, then we can short it towards the fractal low.
But we must wait for the market to tip its hand. Right?
Enjoy!
May profits be upon you.
Leave any questions or comments in the comment section.
I appreciate any feedback from my viewers!
Like and/or subscribe if you want more accurate analysis.
Thank you so much!
Disclaimer:
I do not provide personal investment advice and I am not a qualified licensed investment advisor.
All information found here, including any ideas, opinions, views, predictions, forecasts, commentaries, suggestions, expressed or implied herein, are for informational, entertainment or educational purposes only and should not be construed as personal investment advice. While the information provided is believed to be accurate, it may include errors or inaccuracies.
I will not and cannot be held liable for any actions you take as a result of anything you read here.
Conduct your own due diligence, or consult a licensed financial advisor or broker before making any and all investment decisions. Any investments, trades, speculations, or decisions made on the basis of any information found on this channel, expressed or implied herein, are committed at your own risk, financial or otherwise.

ES (SPX, SPY) Analysis, Key Levels, Setups for Fri (Jan 2nd)Market Overview: Context for Friday
As the market transitions from year-end positioning, traders should anticipate a choppy session influenced by holiday-thinned activity. Initially, expect fluctuations without a clear directional trend, but anticipate more definitive movements once New York cash volume resumes its normal pace.
From a structural standpoint, higher timeframes continue to reflect an uptrend. However, a recent decline from the 6980s has initiated a fresh pullback, leading to a short-term bias focused on “repair mode.” A shift in sentiment could occur if prices can reclaim and hold the mid-6940s.
Currently, prices are stabilizing around the 6920 mark following a sharp decline and subsequent bounce. This positioning places the E-mini S&P 500 (ES) in a mean-reversion zone, where oscillations between key value levels are expected as traders navigate the current landscape.
Forecasting Potential Market Movements
Base Case: Expect a range-bound market with a focus on repairing price levels.
Overnight Activity: The market has shown rotation around key levels of 6916 and 6922.50, with buying interest emerging above 6908.50.
Opening Analysis: As the New York session begins, we anticipate attempts to breach the 6922.50 to 6935.25 range. Should buyers fail to maintain support above 6922.50 during retests, the market is likely to rotate back towards 6916, followed by support at 6908.50.
Bullish Scenario: A strong upward movement could materialize with a decisive breakout above 6922.50.
- Trigger Point: A 15-minute close above 6922.50, followed by pullbacks that maintain support above 6921.50.
- Target Levels: Initial target at 6935.25, with further upside potential towards 6947.50 to 6951.50.
Bearish Scenario: A downward failure could emerge if the market loses the 6908.50 level.
- Trigger Point: Persistent failures to sustain above 6916, accompanied by a 15-minute close below 6908.50.
- Target Levels: An initial downside target at 6895.25, followed by 6890.25 to 6888.00. If 6888 is breached and held, the next level of interest would be 6873.
Events to watch tomorrow (timing is ET)
• 09:45 - S&P Global US Manufacturing PMI (final)
• 16:30 - Fed H.4.1 balance sheet update (released on the next business day when the usual Thursday release falls on a federal holiday)
A++ SETUP 1 (LONG) - Rejection Fade
Entry: 6888.00-6892.25 (buy only after a flush into the pocket, then reclaim)
Stop: 6878.00
• TP1: 6922.50
• TP2: 6935.25
• TP3: 6947.50
• Invalidation: 15m body closes below 6888.00 and does not reclaim quickly
A++ SETUP 2 (SHORT) - Rejection Fade
Entry: 6947.50-6951.50 (sell only after a push up, then fail back under 6947.50)
Stop: 6962.00
• TP1: 6922.50
• TP2: 6916.00
• TP3: 6890.25
• Invalidation: 15m closes and holds above 6951.50 (or a clean push above 6962.00)
Good Luck !!!

ES (SPX, SPY) Analysis, Key Levels, Setups for Wed (Dec 31st)Market Outlook for December 31, 2025 (NY Session)
As we approach the end of the year, investors should be aware of key economic data slated for release that could influence the equity markets, particularly the E-mini S&P 500 (ES).
Economic Calendar (All Times Eastern)
07:00 – MBA Mortgage Applications
While typically seen as a low-impact indicator, this data will be closely watched for any surprises due to its sensitivity to interest rates.
08:30 – Initial Jobless Claims
This report has been advanced this week as Thursday is a federal holiday. Given its implications for labor market strength, it could have noteworthy effects on investor sentiment.
10:00 – NY Fed Corporate Bond Market Distress Index
This indicator serves as a pulse on credit market conditions. A significant change here could signal broader market stress.
10:30 – EIA Weekly Petroleum Status Report
The release of this report comes at a time of heightened scrutiny on energy prices and inflationary pressures. It's advisable to keep an eye on potential spillover effects into the broader indices.
Market Structure Note
Please note that while the US stock market will be open for regular trading hours, the US bond market will have an early close at 2:00 PM ET. This adjusted schedule may influence trading volumes and market dynamics as we wind down the year.
Market Analysis: The Path Ahead Amid Holiday-Induced Thin Trading
The trading session was marked by subdued yet erratic price movements, a natural consequence of reduced market participation during the holiday season. Despite some fluctuations, traders largely refrained from aggressively pursuing dips, while upward movements faced difficulties in maintaining momentum.
In the macroeconomic landscape, the recently released Federal Reserve minutes underscored significant internal divisions regarding prospective interest rate cuts. This lack of consensus diminishes certainty about future rate adjustments, extending uncertainty into early 2026.
As we approach year-end, upcoming trading dynamics will be affected. With Wednesday signaling the final trading day of the year, participants should anticipate a landscape characterized by uneven liquidity. This could lead to increased volatility, particularly around key support and resistance levels, with a heightened potential for stop hunts as markets test widely recognized highs and lows.
Overnight NY Market Forecast: A Scenario Analysis
As we observe the market dynamics, we present a scenario plan that outlines potential movements for the coming hours.
Base Case: Currently, the market is oriented towards a bearish sentiment while trading below the 6950-6953 range. We anticipate a two-way trading environment within the 6928-6950 band, characterized by sharper price fluctuations than typically expected as we approach year-end.
Bullish Scenario: A definitive reclaim and sustained trading above 6953.50 would open pathways for an upward movement into the 6958-6961 range, and potentially to the psychological level of 6969-6970 thereafter.
Bearish Scenario: Conversely, a significant breach below 6928.25 could trigger a cascade towards 6926.25, followed rapidly by 6918.00. Should selling pressure intensify, the 6900 mark may become the next focal point for traders.
SETUP 1 (A++) - Long - Reclaim and go (support to value)
Entry
• Buy 6934.00-6935.00 (only after the reclaim hold is visible)
Hard SL
• 6925.75 (below 6926.25, with extra buffer)
Targets
• TP1 6953.50
• TP2 6957.75
• TP3 6961.50
SETUP 2 (A++) - Short - Rejection fade from upper cap (premium to PDL)
Entry
• Sell 6956.75-6958.00
Hard SL
• 6964.00 (above the 6961.50/6960.75 cap with buffer)
Targets
• TP1 6940.75
• TP2 6930.00
• TP3 6918.00
Good Luck !!!

S&P500 rejection can cause a very bearish start to 2026.The S&P500 index (SPX) hit last Friday its Higher Highs trend-line and got rejected, so far not aggressively.
The 1D RSI rejection though on a Lower Highs trend-line that goes as back as the September 22 High, illustrates a massive Bearish Divergence (Lower Highs against price's Higher Highs), has the potential to accelerate the decline first to the 1D MA100 (red trend-line) and then the lower Support Zone.
As long as the Higher Highs trend-line holds, we expect the index to target 6510 (top of Support Zone) at least within January 2026.
---
** Please LIKE 👍, FOLLOW ✅, SHARE 🙌 and COMMENT ✍ if you enjoy this idea! Also share your ideas and charts in the comments section below! This is best way to keep it relevant, support us, keep the content here free and allow the idea to reach as many people as possible. **
---
💸💸💸💸💸💸
👇 👇 👇 👇 👇 👇

ES (SPX, SPY) Analysis, Key Zone, Setups for Fri (Dec 26)Market Overview: Context for Tomorrow
Trend Analysis: The market maintains a risk-on sentiment as we approach the holiday period, characterized by strong index performance accompanied by light trading volume. This condition often results in a “grind up or chop up” scenario, although we may witness abrupt price movements due to diminished liquidity.
E-mini S&P 500 (ES) Positioning: Currently, prices are situated in the upper range of the recent swing high, indicating a premium area. This positioning heightens the probability of a retracement towards mid-range levels before any further upward momentum takes place.
Looking Ahead to Tomorrow: Investors should anticipate one of two scenarios: (a) a decisive dip that finds support at the Volume Weighted Average Price (VWAP) or Value Area Low (VAL), followed by a re-acceleration towards the Previous Day High (PDH) or Value Area High (VAH), or (b) a definitive rejection at the PDH/VAH that results in a retracement back to the VWAP/VAL zone.
Event Risk - Friday Schedule (ET):
Macro Releases: No major U.S. economic data is scheduled for release tomorrow.
Notable Item: The NY Fed Staff Nowcast will be published at 11:45 a.m. ET, though it typically produces limited market impact relative to key indicators like CPI or NFP.
Implications for the Market: With fewer scheduled economic shocks on the calendar, we can expect a market environment driven more by trading flows than by significant data releases, indicative of a "holiday hangover" effect.
New York Session Forecast
As we head into the New York trading session, the anticipated price path for the day suggests a cautious approach.
The primary range rotation is centered around key levels at 6982.50 (Y-POC) and 6976.75 (VWAP). We expect two-way trading to persist within the confines of 6971.50 to 6988.50 until we see a clearer indication of cash volume dynamics in New York.
Bullish Scenario:
In a bullish scenario, we would need to maintain support in the range of 6976.75 to 6971.50 on any pullbacks. A sustained rally would then target upward moves, aiming for 6988.00 to 6988.50. A decisive break above 6988.50 could trigger a significant advance towards the 6996 to 7000 range.
Bearish Scenario:
Conversely, if we experience a failed attempt to break into the 6988.00 to 6996 area—indicative of a lack of acceptance—we may see a pullback towards 6976.75. A breach of the critical support at 6971.50 could lead to testing lower levels at 6962.75 and 6957.25.
A++ SETUP 1 - LONG (pullback reclaim)
Entry: 6976.75-6971.50
Trigger: 15m tags pocket and closes back above 6976.75 -> 5m higher-low -> 1m pullback holds then push
SL: 6966.00
• TP1: 6988.50
• TP2: 6996.00-7000.00
• TP3: 7006.00-7012.00
A++ SETUP 2 - SHORT (top rejection)
Entry: 6988.00-6996.00
Trigger: 15m pushes into band then closes back below 6988.50 -> 5m lower-high -> 1m pullback fails then drop
SL: 6999.00
• TP1: 6971.50
• TP2: 6962.75
• TP3: 6957.25
Good Luck !!!

ES (SPX, SPY) Analysis, Key Zones, Setups for Wed (Dec 24th)Market Overview: Insights from Today's Trading
U.S. equities closed higher once again, reaching fresh highs primarily driven by large-cap technology and AI stocks, although broader market participation appeared mixed. The momentum was fueled by stronger-than-expected Q3 GDP data, which, combined with a dip in consumer confidence, suggests that economic growth may remain robust even as interest rates trend lower in the future. As we approach the holiday season, thinner liquidity in the markets is becoming increasingly relevant, often resulting in subdued trading activity punctuated by abrupt moves in response to key economic releases.
Analyzing the structure, the E-Mini S&P 500 (ES) is positioned in the upper range of recent trading and is approaching a notable overhead supply zone, characterized by the recent swing highs. The recent upward movement was significant, demonstrating a rapid recovery from the low 6900s to the mid-to-high 6900s; however, the price is currently stalling beneath a well-defined resistance level. This scenario typically leads to one of two potential developments:
1. A prolonged period of consolidation beneath the resistance, followed by a sharp breakout, often triggered by key economic data released at 8:30 AM.
2. A failure to maintain support at mid-range levels, which could result in a downward rotation toward previous demand zones, commonly aligning with metrics such as VWAP, Y-VAL, or PDL.
Market Update: Key Economic Indicators and Early Closures
This Wednesday, investors should pay close attention to the following economic releases:
- 8:30 AM ET: Initial Jobless Claims report, adjusted for the holiday schedule.
- 8:30 AM ET: Advance Durable Goods Orders and the Philly Fed Non-Manufacturing Survey will also be released.
- 11:30 AM ET: Weekly Economic Index will provide additional insights into economic trends.
Please note that equity markets will close early at 1:00 PM ET, while bond markets are set for an even earlier close at 2:00 PM ET.
In noteworthy news from the energy sector, the EIA Weekly Petroleum Status Report will not follow its regular schedule this week. The next anticipated release is slated for December 29, 2025.
Overnight Forecast into the NY Session
Base Case Scenario:
Expect a period of consolidation overnight, with prices likely fluctuating within the range of 6948 to 6964. The key moment will come during the 8:30 AM ET data announcement, which should provide a clearer directional bias. If the support level at 6948-6938 holds through this data window, we anticipate another attempt to test the resistance levels at 6963.75 and 6968.75. However, a failure to surpass 6968.75 typically leads to a retraction back towards the 6947-6943 region, with a potential dip to 6938.
Upside Potential:
A decisive push above 6968.75, particularly if it sustains on a pullback rather than merely wicking through, could pave the way for movement toward the 6985-7000 range. Given that tomorrow marks a shortened trading session, these higher targets may be more suitable for “runner” strategies unless we see significantly robust momentum.
Downside Risk:
Conversely, if the 6938.50 level gives way and fails to rebound swiftly, the market is likely to rotate towards the 6919-6913 zone. This area represents the initial support level where buyers may have a viable opportunity to regain control.
A++ Setup 1 - Short rejection from the top
Entry: 6962.50-6966.00 (only after a test into 6963.50-6968.75 fails and price closes back below 6963.75)
Stop: 6974.25
TP1: 6943.50
TP2: 6938.50
TP3: 6919.25-6918.75
A++ Setup 2 - Long breakout and hold
Entry: 6970.50-6972.25 (only after a 15m close above 6968.75, then a pullback that holds above 6963.75)
Stop: 6961.75
TP1: 6998.75-7000.00
TP2: 7012.50
TP3: 7036.75-7040.00
If you enjoy our analysis, please consider boosting and sharing our post.
Good Luck !!!

ES (SPX, SPY) Analysis, Levels, Setup for Tue (Dec 23rd)MARKET OVERVIEW: Key Highlights of the Day
Investor sentiment remained resilient as equity markets advanced ahead of a holiday-shortened trading week, with large-cap technology and AI-related stocks driving the momentum. This robust performance sets a positive tone as we approach year-end. Notably, hard assets, particularly gold and silver, displayed continued strength, indicating that investors are still seeking hedges amid a rising equity environment. Meanwhile, oil prices remain sensitive to geopolitical developments. Interest rates held steady without causing significant disruptions.
For the E-mini S&P 500 (ES), the overarching trend remains upward; however, the holiday trading environment can lead to choppy price movements. Currently, the ES is testing the upper boundary of its range, making this nearby resistance level a critical point to watch as we progress into overnight trading and the New York session.
Nvidia's stock rose over 1% following a Reuters report indicating that the company plans to start shipping its H200 chips to China by mid-February. Micron Technology experienced a surge of approximately 4%, while Oracle's shares climbed more than 3%. This movement underscores Nvidia’s profound impact, as it now makes up a remarkable 8% of the S&P 500, marking the highest concentration for a single stock in over fifty years. Institutional investment flows continue to be fueled by ongoing developments in AI infrastructure.
The Federal Reserve concluded its December meeting with a 25 basis point reduction in the federal funds rate, adjusting it to a range of 3.50% to 3.75%. This marks the third consecutive rate cut, bringing rates to their lowest since November 2022. Notably, the committee exhibited a divide, with three members dissenting against the cut, reflecting the most disagreement since September 2019. The updated "dot plot" suggests only one additional 25 basis point cut in 2026, followed by another in 2027.
Equity markets have successfully recovered their December losses, positioning the S&P 500 for what could be its eighth consecutive month of gains, the longest winning streak since 2018. On Monday, nearly 400 stocks within the index posted gains as it approached record highs. Historically, the so-called Santa Claus rally has yielded positive results about 80% of the time, averaging a gain of 1.6% since 1928.
TOMORROW - EVENTS TO RESPECT (ET)
08:30 - GDP (Q3 estimate) + Corporate Profits
08:30 - Durable Goods (advance report)
10:00 - Consumer Confidence
10:00 - New Home Sales
16:30 - API crude oil inventory
Liquidity note: shortened week continues - moves can be sharp, then stall quickly.
NY PATH MAP: Overnight Analysis
The market is expected to navigate a range between 6908.50 and 6948.25. Notably, the “gravity pocket” is identified around the 6929.75 to 6925.75 range. Maintaining a position above 6920.50 is crucial for sustaining a bullish outlook. However, a decisive move between 6936.25 and 6948.25 would likely pave the way toward a target of 6983.00.
Bullish Scenario: For a bullish trajectory, it is imperative for the market to defend the 6920.50 level during the Asian and London trading sessions. A successful reclaim and sustain above 6948.25 in New York would open possibilities for a push towards 6983.00, with 7000.00 serving as an upper stretch target.
Bearish Scenario: On the downside, a rejection within the 6936.25 to 6948.25 range, coupled with a drop below 6908.50, would shift the odds in favor of a move towards 6891.00 to 6887.00. Continued selling pressure could then target levels between 6846.00 and 6840.00.
A++ SETUPS (Level-KZ 15/5/1 execution, two plays only)
A++ SETUP 1 - LONG - Break and hold above R1 (pop-and-go)
15m trigger: full body close above 6948.25
5m confirm: pullback holds 6948.25 and re-closes back above it
1m entry: buy 6946.75 to 6948.25 on the first pullback after the hold is proven
Hard SL: 6935.75
TP1: 6983.00
TP2: 7000.00
TP3: 7070.00
A++ SETUP 2 - SHORT - Rejection from R1 (pop-and-fail)
15m trigger: push into 6936.25 to 6948.25, then 15m close back below 6936.25
5m confirm: re-test of 6933.50 to 6936.25 fails and 5m re-closes lower
1m entry: sell 6932.75 to 6934.25 on the first lower-high after the failure is proven
Hard SL: 6949.75
TP1: 6889.00 (middle of S1)
TP2: 6846.00
TP3: 6820.00
If you enjoy our analysis, please consider boosting and sharing our post.
Good Luck !!!

S&P500 mini Santa Rally up next on a 1H Golden Cross.S&P500 (SPX) is about to complete a Golden Cross today on the 1H time-frame. The last time it did that was on November 25, almost 1 month ago, while trading on the first Bullish Leg of the current Channel Up pattern.
Following the 1H Golden Cross, the index rallied to the 1.236 Fibonacci extension level, before turning sideways. As a result this could be the mini Santa Rally that the market is waiting, targeting 6920.
---
** Please LIKE 👍, FOLLOW ✅, SHARE 🙌 and COMMENT ✍ if you enjoy this idea! Also share your ideas and charts in the comments section below! This is best way to keep it relevant, support us, keep the content here free and allow the idea to reach as many people as possible. **
---
💸💸💸💸💸💸
👇 👇 👇 👇 👇 👇

ES (SPX, SPY) Week-ahead Analysis (Dec 22-26)This week is notably shortened due to the holiday, resulting in thinner liquidity and heightened volatility. Market participants should prepare for an early close on Wednesday, December 24, with the markets remaining shut on Thursday, December 25. Normal trading hours will resume on Friday, December 26.
Investors should approach breakouts with caution, demanding clearer confirmations at critical levels and exercising stricter time stops.
Multi-Timeframe Analysis (ES)
Weekly Overview:
The broader trend remains upward, suggesting that the larger swing is constructive; however, prices are testing a weekly supply cap near recent highs, entering a premium zone. Momentum has tempered from previous peaks, raising the risk of a "grind and fade" scenario rather than a straightforward continuation.
The market is currently experiencing a rebound leg, yet it is now hitting a daily supply band overhead, where previous selling pressure originated. Upside potential is limited by the upper band near prior highs, while downside risk is anchored by the last swing base and value areas below.
The most recent movement displays an impulsive rally from a base, followed by a controlled pause - though it does not indicate a full reversal at this stage. As long as pullbacks remain above the recently established reclaim shelf (mid to high 6800s), current price action is indicative of "healthy digestion." A breach below this shelf could signal a deeper correction.
1-Hour Context (Intraday):
Prices are currently positioned in the upper range of the recent trading day, approaching key overhead levels. This presents a pivotal moment for either a breakout continuation or a potential failure.
Momentum/Oscillator Analysis (Weekly + Daily):
- Weekly Perspective: Momentum is currently in a neutral zone—not excessively overbought, yet not undervalued either - as it has eased from earlier peak levels.
- Daily Perspective: Momentum has improved off the lows and is showing upward curvature, indicating that dips are being supported; however, the presence of overhead supply may lead to rapid stalls in momentum.
The key trend delineation, or "line in the sand," for market observers currently stands at 6760.
For trading positions resting above this benchmark, any pullbacks can still be classified as "corrections within an overarching uptrend." This suggests that the bullish sentiment remains intact as long as the market holds above this critical threshold. Conversely, a decisive move below 6760 - particularly if there’s acceptance level would signal potential damage to the rebound narrative, indicating that the market is showcasing areas of diminished demand.
NQ Intraday Reference Map:
For the Nasdaq (NQ), immediate resistance is noted between 25600 and 25645, aligning with prior highs and current push zones, followed by further resistance at 25800 to 26000, which serves as the next magnet zone for traders.
On the support side, key levels to watch include 25592 to 25568, which represents a value shelf, descending to the levels of 25504, and further extending to 25393 to 25357, marking the prior day’s low pocket. Should the market breach these levels, the overnight low at 25210 will be significant in assessing downward momentum.
Volatility Metrics Overview
VIX Analysis
The VIX has been trading in the mid-teens recently, with a notable decline observed late last week, indicating a growing risk appetite among investors, albeit with a continued sensitivity to market headlines. FRED's latest reported close was at 16.87 on December 18. However, a subsequent market data feed indicated a significant drop on December 19, with a low/close around 14.91. The takeaway here is that a lower VIX tends to support dip-buying strategies; however, sudden spikes in the VIX during a holiday week often result in sharp mean-reversions.
Rates Volatility - MOVE Index
The MOVE index is currently sitting at approximately 59, indicating a low-to-moderate level of stress in the rates market. This suggests that there is no acute funding stress present, which typically supports equities by mitigating the risk of disorderly sell-offs.
Tail Risk Pricing - SKEW Index
The SKEW index remains elevated in the mid-150s range. This suggests that while the market is not experiencing daily panic, investors are willing to pay a premium for crash insurance, indicating a cautious approach to tail risks.
Options and Positioning
The put/call ratios indicate a measured market sentiment, with the total put/call ratio currently at approximately 0.88 (based on a 10-day moving average), suggesting a balanced approach rather than extreme fear. On a daily basis, the total put/call ratio hovers around 0.86, while the equity put/call ratio is more subdued at about 0.59.
From a qualitative perspective, the VIX trading in the mid-teens, coupled with stable put/call ratios, suggests that dealers are likely positioned closer to long gamma in this range, indicating potential for pinning and mean-reversion behavior unless an external macro catalyst disrupts the current balance. This observation, while not rooted in explicit positioning reports, draws from the context provided by volatility and options data.
Market Breadth and Internals
The NYSE breadth snapshot reveals a positive market internal dynamic, with 1,424 advancing issues versus 1,338 declining, yielding a net advance of 86. The McClellan Oscillator stands at approximately +12.8, indicating that market breadth is not experiencing significant deterioration. Current data suggests we are witnessing a “minor wobble/digestion” phase rather than a full-blown distribution cascade.
Credit and Funding Environment
In the realm of credit markets, US high yield option-adjusted spreads (OAS) are around 2.95%, indicating a tight and orderly credit environment. The NAV of HYG is approximately 80.24, while JNK trades close to 96.82. These observations suggest that the credit markets are not currently signaling a risk-off narrative. However, any rapid widening of spreads may be interpreted as an indicator of shifting sentiment toward a more cautious stance.
Sentiment and Crowd Positioning
The latest reading from the AAII survey reflects a balanced sentiment landscape, with about 44% bullish, 23% neutral, and 33% bearish positions. This lack of overwhelming fear suggests reduced potential for a sustained market squeeze driven solely by under-positioning, unless the price action returns decisively above previous highs.
Cross-Asset and Global Risk Tone
In the cryptocurrency markets, Bitcoin is trading around $88,600, while Ethereum is near $3,000. This firmness in crypto typically aligns with a risk-on sentiment but may also serve as a precursor to heightened volatility should macro developments arise.
Lastly, recent trading has showcased strength in the Nasdaq and tech sectors. Should the Nasdaq (NQ) begin to underperform relative to the S&P 500 (ES) at these elevated levels, it may serve as an early warning signal for a potential fade in risk appetite.
MACRO AND DATA-CALENDAR (EVENT RISK)
Key US Economic Releases This Week (ET)
Monday, December 22
No significant economic data scheduled for release.
Tuesday, December 23
- 8:30 AM: Q3 GDP (delayed due to government shutdown)
- 8:30 AM: Durable Goods Orders (also delayed)
- 10:00 AM: Conference Board Consumer Confidence
Wednesday, December 24** *(Early market close at 1:00 PM ET)
- 8:30 AM: Weekly Jobless Claims
Thursday, December 25
Markets will be closed in observance of Christmas.
Friday, December 26
Markets will reopen with normal hours; however, no notable economic data is scheduled for release.
Event Impact Analysis:
- GDP and Durable Goods: Historically, these releases can lead to rapid volatility spikes, potentially mean-reverting if prices remain confined within established ranges. A breakout, however, could serve as fuel for further trends, particularly if it breaks through resistance levels R2/R3 or support levels S3/S4.
Good Luck !!!
- **Consumer Confidence:** This indicator typically influences equity markets based on growth expectations. A key point of analysis will be the NASDAQ index's reaction, which can provide a clearer picture of risk-on sentiment.
- **Jobless Claims on Early-Close Day:** Expect an increase in volatility, as lower liquidity may lead to exaggerated initial moves, potentially setting traps for traders.
As always, we advise close monitoring of these releases for potential market implications and trends.

$SPY: 15m Structural Repair & Dynamic Trend BreakoutWhat I’m Seeing: I am currently observing a confluence on the AMEX:SPY 15-minute chart following the Friday close at $680.59. My Structure Engine shows that price has fully cleared the $679 intraday demand threshold, effectively 'repairing' the liquidity void created during the mid-morning dip. Simultaneously, the Automatic Trend Line script has printed a fresh support level at $679.50, confirming that the short-term trend is now realigned with the larger bullish bias.
Why It Matters: This 15m confluence is a high-confidence signal for intraday expansion. By 'sealing' the void below $679, the market has established a new structural floor. When the Automatic Trend Line engine identifies support right on top of a repaired zone, it indicates that the 'path of least resistance' has shifted upward. It suggests that intraday sellers have been absorbed and momentum is now being guided by the dynamic trend.
What I Expect to See Next: I expect the 15m trend to hold as price targets the immediate pivot high at $681.50. If we see a 15m candle body close above $681.50, the 'void' to the next major resistance at $684.22 (Monday's projected range high) becomes the primary target. I will be watching for the Trend Engine to maintain its slope; a breakdown below the $676.75 support would invalidate this short-term structural repair thesis.

S&P Futures Trading Day 85 — Watching the Market Run Without MeEnded the day +$80 trading S&P Futures. My pre-market analysis spotted a potential breakout from the recent downtrend, with the only major resistance looming ahead at the 6890s. I set my plan to short that resistance and look for longs at the 5-minute MOB. Unfortunately, I was just a step too late on the long entry, and the market ripped higher without filling my order. It’s always frustrating to watch a planned move happen without you, but I stayed disciplined, took the small win on the shorts, and respected the bullish market structure.
📰 News Highlights
S&P 500 CLIMBS AS ONGOING AI-LED REBOUND PUSHES TECH HIGHER
🔔 VX Algo Signals
9:29 AM — MES Market Structure flipped bullish (X3) ✅ 11:20 AM — VXAlgo NQ X1DP Buy Signal ✅ 2:00 PM — VXAlgo ES X3 Sell Signal ✅
3 out of 3 signals worked — 100% accuracy today.
🔑 Key Levels for Tomorrow
Above 6925 = Bullish Below 6900 = Bearish

ES (SPX. SPY) Analysis, Levels, Setups for Fri (Dec 19th)News + schedule
BoJ delivered a 25 bp hike to 0.75% - this can keep early-session volatility elevated via yen/carry-trade unwind and rate moves.
10:00AM Existing Home Sales (Nov), 10:00AM Michigan Consumer Sentiment (final).
ES is currently bracketed by a solid support level between 6820 and 6824 and a formidable resistance zone ranging from 6863 to 6872. Until either side manages to establish dominance with a convincing 15-minute close outside these boundaries, we can anticipate continued fluctuations and volatility within the midpoint range of 6840 to 6855.
A++ Setup 1 - LONG (Sweep-reclaim at the bottom)
Trigger (15/5/1): 15m sweep under 6820.50-6823.50 and close back above 6823.50 - 5m holds above 6823 - 1m first pullback that holds.
Entry: 6824.00-6826.00
Hard SL: 6810.75
TP1: 6854.50
TP2: 6863.00
TP3: 6872.00
A++ Setup 2 - SHORT (Rejection from the cap)
Trigger (15/5/1): 15m push into 6863-6872 and close back below 6863 - 5m fails to reclaim 6863 - 1m lower-high entry.
Entry: 6860.50-6862.50
Hard SL: 6870.75
TP1: 6842.25
TP2: 6823.25
TP3: 6811.75
Good Luck !!!

ES (SPX, SPY) Analysis, Key Levels, Setups for Thu (Dec 18)TOMORROW EVENT STACK (ET)
07:00 - Bank of England rate decision + statement
04:00 - Norges Bank rate decision (Norway)
08:15 - ECB policy statement release
08:30 - CPI (Nov) + Real Earnings (Nov)
08:30 - Initial Jobless Claims
08:30 - Philly Fed Manufacturing (Dec)
08:30 - ECB press conference begins (adds FX noise, CPI still dominates ES)
High-impact window: The peak whip risk occurs from 08:30 to 08:45 ET. After the market opens at 09:30, it often either continues the 08:30 trend or reverses back to fair value.
October CPI Release and Its Implications
The absence of the October CPI data from the Bureau of Labor Statistics (BLS) introduces significant complexity to the upcoming November CPI release. Notably, the November figures will omit certain one-month percent changes due to the missing October data. This gap is likely to lead to increased volatility in market reactions, as traders may rely more heavily on year-over-year comparisons and overarching narratives. It's important to emphasize that this presents a data-quality risk rather than a straightforward price forecast.
Current projections from Reuters indicate a CPI rise of 0.3% month-over-month, with a year-over-year increase of 3.1%. Additionally, core CPI is expected to mirror this 0.3% monthly change, while the year-over-year core figure is anticipated to remain at 3.0%. These benchmarks represent the market's baseline, and any significant deviation—either a miss or beat—could trigger a pronounced market reaction.
Navigating Market Dynamics: A Practical Guide for E-mini S&P Traders
- Hot Scenario: A core CPI increase of 0.4% or more, or any unexpected data that raises inflation concerns, is likely to drive yields upward. In this case, E-mini S&P futures may see selling pressure on initial rebounds, as traders react to renewed inflation fears and test support levels.
- Cool Scenario: Conversely, if the core CPI prints at 0.2% or below, or if there’s a clear downside surprise against expectations, we might witness a drop in yields. This scenario could facilitate a breakout for E-mini S&P futures, allowing for upward progression through resistance levels as shorts are squeezed.
- In-Line Scenario: The market may react chaotically to the initial news, but typically, direction stabilizes upon the first pullback following the 09:30 cash market open.
To ensure effective trading during the CPI release, adhere to the following guidelines:
1. Avoid initiating new positions in the final 60 seconds leading up to the 08:30 release.
2. Establish four key reference points: the high and low of the pre-CPI trading range (08:20-08:29) and the high and low resulting from the CPI spike (08:30-08:33). These levels frequently serve as pivotal points for price action during the first 30 to 90 minutes of trading post-release.
By keeping these dynamics in mind, traders can better navigate the potentially tumultuous waters of the upcoming CPI announcement.
Market Analysis: Short-Term Outlook
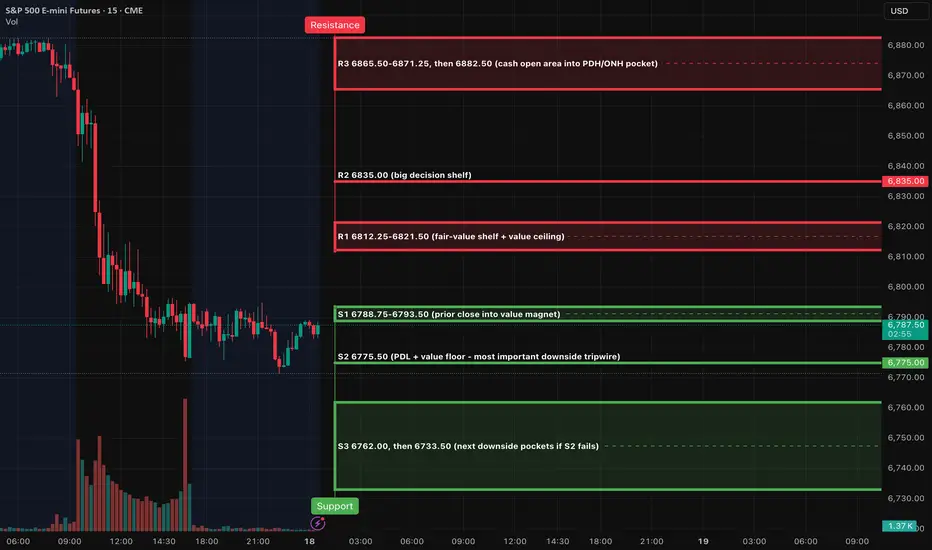
In the broader context, the recent trading action suggests a failure to maintain momentum after reaching the upper resistance band. The most recent price structure indicates a downward trend, with the market currently trading below key resistance levels. For upcoming sessions, this is critical; any attempts at upward movement will need to overcome the 6821-6835 range to signify a genuine reversal rather than mere corrective action.
On the 4-hour timeframe, we observe a distinct sell-off followed by a consolidation phase. There are several resistance zones left untested from the recent decline, which could hinder any potential rallies. The immediate resistance is located between 6812 and 6821, with a higher barrier at 6835. Should the price exceed 6835, it might have the potential to rally toward the 6865-6882 range.
The 1-hour perspective reveals a classic pattern characterized by a sharp decline followed by a basing phase. Notably, trading volume surged during the sell-off before tapering as prices stabilized near the close. This dynamic sets the stage for either a rebound toward immediate resistance levels or a further decline if the established support fails.
The oscillator is currently in a deeply oversold position, registering in the low teens and beginning to show signs of a potential upward turn. This development suggests some bounce potential, although it does not guarantee a trend reversal on its own. A credible shift in trend will require the price to reclaim the R1 resistance and maintain levels above R2.
Overnight Market Outlook: NY Session Forecast
Base Case Scenario (Pre-CPI): Anticipate a period of rotational trading between support level S2 at 6775.50 and resistance range R1 at 6812-6821.
Bullish Scenario: Should the market hold at S2, a reclaim of R1 would be crucial. A successful transition of R2 (6835) from a resistance level to a support floor could propel prices toward R3 (6865-6871), with the potential to reach 6882.50 if bullish momentum remains strong.
Bearish Scenario: Conversely, if the market slips below S2 and fails to reclaim the 6775.50 level, we could see a decline towards S3 at 6762, with a further slide to 6733.50 if selling pressure intensifies.
A++ Setup 1 - Short Position (Rejection at Resistance Level 1)
Entry Criteria: Monitor the market for a minimum of 30 minutes. The ideal entry is between 6816.00 and 6821.00.
- Stop Loss (SL): 6838.00
- Take Profit (TP) Targets:
- TP1: 6775.50
- TP2: 6762.00
- TP3: 6733.50
**Invalidation Point:** The setup will be invalidated if price sustains above 6835.00.
A++ Setup 2 - Long Position (Continuation through Resistance Level 2)
Entry Criteria: Again, monitor for a duration of at least 30 minutes. The target entry range is between 6830.00 and 6836.00.
- Stop Loss (SL): 6818.50
- Take Profit (TP) Targets:
- TP1: 6871.25
- TP2: 6882.50
- TP3: 6936.25
Invalidation Point: The trade will be considered invalid if there is a decisive drop back below 6821.50 after the reclaim action.
Good Luck !!!
S&P Futures Trading Day 83 — Riding the Trendline: Bearish ThesiEnded the day +$250 trading S&P Futures. Today was a textbook session where the morning analysis played out perfectly. My bearish thesis was strong right out of the gate, based on the price being under the trendline and confirming the bearish market structure. I opened my short positions at the open and set a crucial batch of orders at the 2-hour MOB. The market played out exactly as anticipated, delivering a clean profit day. It's always satisfying when the planning, structure, and execution align this well.
📰 News Highlights
*DOW, S&P 500, NASDAQ END LOWER AS TECH STOCKS TUMBLE AHEAD OF JOBS REPORT
🔔 VX Algo Signals
9:30 AM — MES Market Structure flipped bearish (X3) (Assuming Yes, aligning with thesis) ✅ 10:00 AM — VXAlgo NQ X3DP Buy Signal (Assuming No, as it's a Buy signal in a Bearish Market) Yes 1:30 PM — VXAlgo ES X1 Oversold signal (Assuming Yes, marking the low) ✅
🔑 Key Levels for Tomorrow
Above 6925 = Bullish Below 6900 = Bearish

ES (SPX, SPY) Analysis, Key Zones, Setups for Wed (Dec 17th)Market Update: ES Faces Critical Decision Point
The ES market is currently navigating a narrow “decision pocket” between 6850 and 6865, following a significant selloff and a subsequent bounce that has yet to establish a definitive trend. The situation is clear: buyers must defend the lower range of 6834 to 6817 to maintain market stability within this range. Conversely, sellers are focusing on the upper threshold between 6880 and 6892. With the Consumer Price Index report scheduled for release on Thursday morning, traders are likely to become more reactive, potentially taking profits swiftly and responding sensitively to any news regarding interest rates.
What can move ES tomorrow (high-impact catalysts, ET)
7:00 MBA Mortgage Applications - usually a modest mover, but it can nudge rates early.
8:15 Fed Governor Waller (Economic Outlook) - big rates sensitivity; ES can whip on any change in tone.
9:05 NY Fed President Williams - opening remarks at an NY Fed conference; still headline-capable.
10:30 EIA Weekly Petroleum Status Report - can move crude and inflation expectations, which can leak into ES.
11:00 Treasury buyback details (eligible bonds list) - rates pulse risk.
1:00 20Y Treasury auction (competitive bids) - one of the bigger intraday “rates steering wheel” moments.
1:40-2:00 Treasury buyback operation window - can add another yields swing in the early afternoon.
Macro and News Themes to Watch Ahead of Tomorrow’s Market
In the current environment, interest rates are proving to be the primary driver of market dynamics. Any increase in long-term yields exerts downward pressure on the equity markets, particularly when key indices like the S&P 500 are hovering near critical resistance levels.
The Federal Reserve's messaging remains notably inconsistent. While some officials are emphasizing the importance of maintaining inflation credibility and adopting a cautious stance towards future rate cuts, others suggest that monetary policy is already positioned effectively and anticipate a gradual cooling of inflation. This divergence creates a volatile atmosphere, leading to heightened market reactions surrounding Fed speeches.
On the geopolitical front, oil prices are responding to ongoing developments, particularly concerning Venezuela, which has raised supply-risk concerns. This uptick in crude prices has the potential to reinforce inflation narratives and influence equity market sentiment.
Additionally, the looming Bank of Japan (BOJ) meeting, where a rate hike is expected, adds another layer of complexity. Even ahead of this anticipated move, shifts in foreign exchange and global rates could significantly impact U.S. index futures and overall market positioning.
Overnight NY Market Forecast
Base Case Scenario: The market is expected to trade within a range of 6832.75 to 6880.50. Watch for potential retracements towards the 6849.00-6849.75 level, which appears to be a pivotal support point.
Bullish Scenario: Should the index manage to sustain a position above 6880.50, a decisive break above 6892.00 would likely drive prices towards 6936.25, a key resistance level.
Bearish Scenario: Conversely, a confirmed drop below 6817.50 would pave the way for a test of 6800.00 initially. If sellers maintain their grip on the market, further declines to 6767.75 and 6733.75 may follow.
A++ Setup 1 (Rejection Fade short from the upper shelf)
Entry: 6887.00-6891.75
Hard SL: 6896.25
TP1: 6863.50
TP2: 6849.75
TP3: 6834.50
A++ Setup 2 (Acceptance Continuation short under PDL)
Entry: 6814.50-6817.25
Hard SL: 6823.75
TP1: 6800.00
TP2: 6767.75
TP3: 6733.75
Good Luck !!!

S&P500 Will it have a big correction in 2026 back to 5500?The S&500 (SPX) has been trading within a massive 16-year Channel Up since the 2008 U.S. Housing Crisis. Within this pattern it has been repeating various shorter fractals as you can see on this chart it is one that truly stands out.
That's the necessity of the market to correct back to its 1W MA200 (orange trend-line) every time it reaches a Top after an exhaustion rally. With the 1W RSI on a Lower Highs Bearish Divergence (against the price's Higher Highs), there is no better time to consider a market top, thus a strong correction, especially after such a non-stop exhaustion rally since the April 2025 Low.
Based on the 1W MA200 trajectory, we make a fair estimate that contact can be achieved around the 5500 level, which will be our next long-term buy on stocks. Alternatively, if the 1W RSI approaches the 30.00 oversold level, without the index touching 5500, it will be a good idea to Buy regardless of the price.
---
** Please LIKE 👍, FOLLOW ✅, SHARE 🙌 and COMMENT ✍ if you enjoy this idea! Also share your ideas and charts in the comments section below! This is best way to keep it relevant, support us, keep the content here free and allow the idea to reach as many people as possible. **
---
💸💸💸💸💸💸
👇 👇 👇 👇 👇 👇

Day 82 — Falling Asleep During the Session (But Still Green)Ended the day +$130 trading S&P Futures. I came into the session bearish, spotting a setup right at the 10-minute resistance. I managed to execute a short at the open and secure the profit, but the reality of trading US markets from Asia hours caught up with me. I was completely exhausted and literally fell asleep right after that first trade. While I’m happy to be green, it stings to wake up and realize I missed some great movements, including a perfect chance to go long when the market hit the oversold and longer-timeframe MOB levels.
📰 News Highlights
*DOW, S&P 500, NASDAQ END LOWER AS TECH STOCKS TUMBLE AHEAD OF JOBS REPORT
🔔 VX Algo Signals
9:42 AM — MES Market Structure flipped bearish (X3) ✅ 10:40 AM — VXAlgo ES X1 Oversold signal ✅
2 out of 2 signals worked — 100% accuracy today.
🔑 Key Levels for Tomorrow
Above 6925 = Bullish Below 6910 = Bearish

ES (SPX, SPY) Analyses, Key Levels, Setups for Tue (Dec 16th)
As we head into Tuesday, ES is showing signs of structural weakness following a significant sell-off, culminating in a late dip into the 6845-6840 demand zone. The prevailing trend appears to be downward as long as prices remain beneath the resistance range of 6863-6874. However, the 6845-6840 support still has the potential to trigger a rebound. Traders should anticipate the most decisive price action around major data releases, followed by a phased, level-to-level approach in trading strategy.
EVENTS THAT CAN MOVE ES (ET)
2:00am UK labor data
3:15am-5:00am Eurozone PMI batch + ZEW sentiment window
8:30am US jobs data bundle + Retail Sales + Earnings + Unemployment
9:45am US Flash PMI
10:00am Business Inventories
4:30pm API oil stats (can hit energy tone into the close)
Market Outlook: NY Session Forecast
In the upcoming New York trading session, we anticipate a period of consolidation likely to include a modest rebound attempt. However, this upside movement is expected to face resistance within the range of 6859 and 6863-6874. Should sellers maintain pressure and keep prices below 6863 as we head into the session, we could see a subsequent pullback towards the 6845-6840 range, followed by a potential drop to 6825.
On the bullish side, if the market can decisively reclaim and sustain levels above 6874, we might open the door for a rally towards 6902 and possibly 6923.
Conversely, a clear breach below 6840 that lacks immediate recovery signals strengthens the bearish outlook, targeting 6825 initially, with the potential for a further decline to 6800-6790.
ES Short (A++) - Sell 6863-6874 - SL 6876.50 - TP1 6845-6840 TP2 6825 TP3 6800-6790
Key zones
Support - 6845-6840, 6825, 6800-6790
Resistance - 6851-6859, 6863-6874, 6902, 6923-6936
A++ Setup 1 - Short (ceiling fade)
Entry - Sell 6863-6866 after a rejection from 6863-6874
Stop - 6876.50 (above the rejection high)
TP1 - 6845-6840
TP2 - 6825
TP3 - 6800-6790
ES Long (A++) - Buy 6825 reclaim - SL 6814.25 - TP1 6863 TP2 6902 TP3 6923
A++ Setup 2 - Long (flush then reclaim)
Entry - Buy 6825-6828 only after price reclaims and holds above 6825
Stop - 6814.25 (below the flush low)
TP1 - 6863
TP2 - 6902
TP3 - 6923
Good Luck !!!

ES (SPX, SPY) Week-Ahead Analysis (Dec 15-19, 2025)Market Overview: The Week Ahead
This week marks a pivotal moment for the markets as focus shifts from narratives to hard data. Key economic indicators will be released, including U.S. jobs figures on Tuesday and the Consumer Price Index (CPI) on Thursday, both scheduled for 8:30 AM ET. Additionally, the Bank of Japan will convene on December 18-19, with a consensus anticipating a 25 basis point hike, bringing rates up to 0.75%.
In a week filled with significant releases, we often see market behavior akin to a compressed spring - characterized by volatility as traders await fresh data, followed by a rapid price adjustment once new information emerges.
Historically, the most lucrative trading opportunities materialize at the edges of established price ranges, rather than in the middle.
Technical Analysis: Trading Structure
Weekly Outlook
The broader market structure remains constructive, although current trading suggests we may be nearing what appears to be a “ceiling zone” following a recent advance. This level could facilitate rapid upside movements, albeit sustained acceptance is proving more challenging. Notably, momentum is easing rather than collapsing.
Daily Perspective
The daily market profile indicates a potential recovery phase following significant liquidation. Buyers seem to be regrouping to establish a solid base, while sellers are actively defending against upside pressures. This dynamic often results in pronounced intra-day fluctuations but tends to exhibit limited follow-through absent a triggering catalyst.
4-Hour Analysis
Recent trading patterns align with a classic sequence: an initial impulse downward followed by a corrective consolidation. In such market conditions, rallies hitting resistance levels are often mere tests rather than true breakouts until prices can convincingly maintain levels above key ceilings.
On an intraday basis, the market is currently in a tight range above the Volume Weighted Average Price (VWAP), frequently encountering resistance at the same overhead levels. This setup typically leads to one of two outcomes: either a pop-and-fail at resistance which presents a clear short opportunity or a flush-and-reclaim at support offering a viable entry for longs.
Investors should remain alert for market responses to the upcoming economic data, as this will likely set the tone for price movements in the days ahead.
Risk Pricing Analysis: Current Market Sentiment
As we assess the current market landscape, it's clear that we are not in a state of panic; however, there are signs that market participants are pricing for potential tail risks.
The VIX spot index stands at 15.74 as of December 12, indicating a moderate level of volatility expectations. Similarly, the MOVE index, which measures the volatility of interest rates, is at 69.25 on the same date, reflecting some instability in that realm.
In credit markets, we see a High Yield Option-Adjusted Spread (OAS) of 2.88 on December 11, suggesting that conditions remain orderly despite the slight increase in risk premiums. Notably, the SKEW index is currently at 153.59, indicating that crash insurance is priced considerably rich compared to historical norms, signaling investor concerns about downside risk.
The put/call ratio is at 0.91 with a 10-day moving average of 0.86, which does not indicate extreme levels of fear among traders. Additionally, market breadth reflects a somewhat subdued environment, with 221 advancing stocks versus 280 declining stocks on December 12. While this does not signify outright capitulation, it suggests that overall market strength is lacking.
In summary, the prevailing market conditions appear to favor sharp reactions to new catalysts, with the expectation of mean-reversion unless volatility in credit and rates begins to escalate.
The catalyst calendar that can flip the trend
Tuesday Dec 16 - 08:30 ET
US Employment Situation for November is scheduled for release.
Thursday Dec 18 - 08:30 ET
US CPI for November is scheduled for release, plus Real Earnings.
Important nuance for this CPI
Because of the 2025 lapse in appropriations, the CPI release has documented limitations (missing October data prevents some 1-month changes from being published). That can widen the interpretation range and produce bigger price swings than a normal CPI day.
Thursday Dec 18 (global central banks)
• BoE is widely expected to cut 25 bp to 3.75%.
• ECB is expected to hold the deposit rate at 2% next week.
BOJ Dec 18-19
Baseline expectation is a 25 bp hike from 0.50% to 0.75%, with guidance as the bigger lever.
**Why the Bank of Japan Influences U.S. Stocks: An Analytical Perspective**
The Bank of Japan (BOJ) functions as a global “funding thermostat.” When its monetary policy is anchored near zero, it indirectly fosters a stable environment for risk assets globally, as funding remains inexpensive and reliable. Conversely, tightening measures from the BOJ can ripple through financial markets, impacting not only Japan but also the broader global financial system.
Here’s a breakdown of how BOJ actions affect U.S. stock indices:
1. Yen Channel (Risk Appetite):
A rate hike or hawkish signals from the BOJ typically strengthen the Japanese yen. A stronger yen can compel investors to trim risk exposure in their portfolios, especially in positions sensitive to foreign exchange fluctuations and funding costs. This de-risking effect often hits high-beta equities first, leading to notable adjustments in U.S. markets.
2. Global Discount-Rate Channel (Valuations):
As Japanese yields rise and global term premiums stabilize, the discount rate applied to U.S. equities tends to increase. This scenario generally poses challenges for long-duration equities, particularly growth-oriented stocks. A decline in this growth-heavy leadership can drag down the overall index, even amid a stable economic backdrop.
3. Cross-Border Flow and Hedging Channel (Subtle Pressure):
Japan is a significant investor in foreign assets (especially US). Changes in domestic yields can alter the appeal of these foreign investments and the associated hedging costs. It’s not necessary to witness a dramatic repatriation for market movements to occur; even modest reallocations, coupled with adjustments in hedging strategies, can tighten financial conditions incrementally.
4. Timing Channel (Gaps):
The BOJ typically makes its announcements during U.S. off-hours, heightening the likelihood of gaps in futures trading (like the E-mini S&P 500). Such gaps can disrupt typical intraday trading patterns, forcing traders to navigate wider risk parameters as they react to fresh information.
Practical Implications:
A surprise hawkish stance from the BOJ increases the odds of the E-mini S&P 500 testing lower support levels initially (S2 followed by S3/S4). Conversely, if the BOJ’s communication aligns with market expectations and is accompanied by a calm demeanor, the resultant market reaction may function as a temporary impetus, quickly yielding the spotlight back to upcoming U.S. jobs data and CPI readings.
Geopolitics and Inflation: Key Insights for the Week Ahead
This week, energy risk has resurfaced on the market’s radar. The U.S. seizure of the Venezuelan oil tanker M/T Skipper, accompanied by intensified enforcement actions, has disrupted Venezuelan export flows and sparked increased discussions about potential supply disruptions. These developments are crucial, as headlines related to oil tend to boost inflation expectations, particularly just before the Consumer Price Index (CPI) release.
The situation in the Middle East remains precarious, with ongoing developments regarding the stability of a ceasefire in Gaza heightening sensitivity to geopolitical headlines. This uncertainty adds an additional layer of complexity to market dynamics.
Meanwhile, the normalization of shipping routes is unfolding at a sluggish pace. A return to operations in the Suez/Red Sea lanes is expected to be a gradual process, with estimates suggesting a 60-90 day transition period once it officially commences.
On the economic front, the tone surrounding China’s growth appears to be softening. Recent figures show November industrial output rising by 4.8% year-over-year and retail sales increasing by just 1.3% year-over-year, indicating a weakening momentum in demand.
Analysts will be closely monitoring these developments, as they could significantly influence market trends and inflation forecasts in the near term.
Navigating NY Sessions with Precision
In analyzing the upcoming New York trading sessions, it’s crucial to establish a clear scenario map that demarcates potential trading paths based on market behavior around key data releases.
The most probable trading scenario is expected to involve two-way trades within established price shelves, characterized by potentially sharp price movements during the Tuesday and Thursday 08:30 data releases. Historically, such movements have a tendency to mean-revert towards the Volume-Weighted Average Price (VWAP) and Point of Control (POC) unless the incoming data significantly deviates from market expectations.
For traders anticipating a bearish extension, key triggers include sustained price acceptance below 6828.50, the Yearly Point of Control (Y-POC), followed by failure to reclaim 6810.50 (Yearly Value Area Low). Acceptance below 6805.00 the previous day’s low would solidify this bearish outlook. In this scenario, any rallies are likely to be viewed as opportunities to “sell the bounce” until a market reclaim signifies strength.
Conversely, a bullish surprise may unfold if prices hold above 6850.00, particularly post-data release. A reclaim of the 6889.50 to 6896.25 range, establishing it as a support floor, could trigger a short squeeze, pushing prices towards 6903.00 and subsequently 6915.50. This bullish path would be contingent on genuine acceptance above these levels.
Trading Execution Strategy
To navigate these scenarios effectively, traders should focus on optimal execution windows during the New York AM session from 09:30 to 11:00, and in the PM session from 13:30 to 16:00. It’s advisable to treat the Tuesday and Thursday 08:30 data releases as distinct trading regimes; traders should observe initial market impulses before seeking to capitalize on subsequent moves from established price shelves.
Risk management is paramount. A pass-fail gate is established whereby the first take profit (TP1) should be positioned at a minimum of 2.0 times the risk from the predefined stop, ideally anchored to a 15-minute candle wick or market structure. Limit trading attempts to two per level per session, implementing daily guardrails to exit positions at a loss of -2R and securing profits at +3R.
Good Luck !!!
