ETHBTC - Upward Movement Using this curved channel to show a target
This works well with the horizontal line at prior peaks
ETHBTC could move up to 0.08 - 0.10 as we head into a very strong alt season
The RSI also shows itself within a downward channel but support will be found at the middle line of the channel, allowing further movement up. Top of the channel being hit on the RSI is likely.
Very bullish on ETH.
ETH-D

ETHUSD - Resistance Now SupportA major resistance that has pushed price down many times has been broken out from
The dotted line is the last line of defense for resistance
I doubt this dotted line will hodl and a further breakout will occur
This is the Weekly chart
Bullish

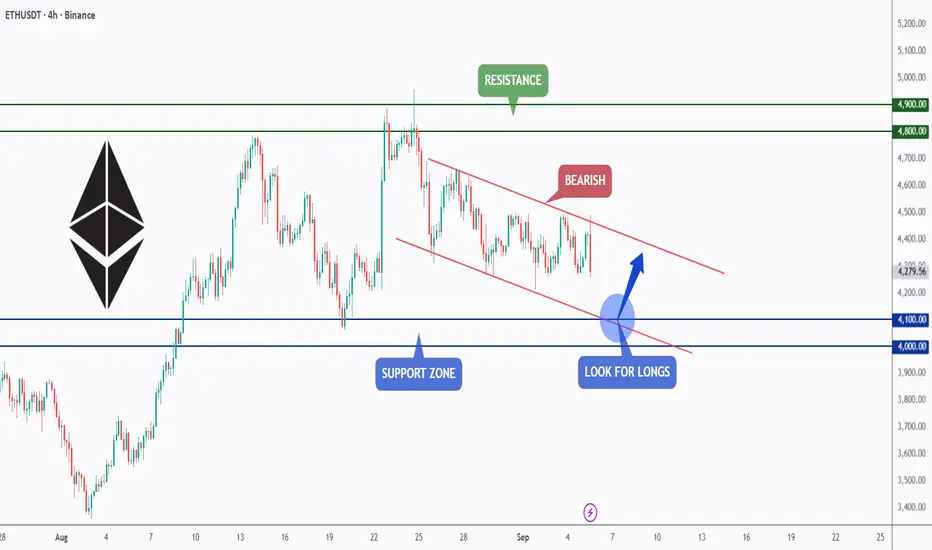
Ethereum (ETHUSD) – Eyeing Next Leg Higher After Consolidation📌 Overview
Despite the vast number of cryptocurrencies in circulation, the majority lack real long-term utility. Ethereum (ETH) stands out as a foundational asset in the evolving digital infrastructure—powering smart contracts, DeFi, and Web3 development.
📈 Technical Outlook
We’ve been tracking Ethereum closely for months and have actively participated in the ongoing rally. ETH is currently:
Holding above key support in the $4,000–$4,200 range (former resistance now turned support)
Consolidating within the $4,800–$5,000 resistance zone, near its previous all-time highs
We’re now observing the development of a symmetrical triangle pattern, which often precedes a continuation move.
🚀 Bullish Setup
Breakout above the upper triangle resistance could target the $5,700–$5,800 zone in the near term.
Our medium- to long-term target remains $7,000–$8,000, depending on market liquidity and macro conditions.
A confirmed breakout with strong volume could validate the next leg higher.
🔔 Key Levels to Watch
Support: $4,000 – $4,200
Resistance: $4,800 – $5,000
Short-term target: $5,700 – $5,800
Long-term target: $7,000 – $8,000

ETHUSD BUY NOW 4287🟢 ETHUSD – Bullish Setup at 4287 Long Opportunity
Ethereum is holding strong above key support at 4280–4290, showing signs of bullish continuation. Price action confirms buyer strength, with momentum indicators aligning for a potential breakout toward higher resistance zones.
🔹 Trade Idea: BUY ETHUSD @ 4287
- Entry: 4287
- Stop Loss: 4215 (below recent structure)
- Take Profit: 4450 / 4600
- Risk/Reward: ~2:1
📊 Technical Confluence:
- Bullish engulfing candle on 1H
- MACD crossover and RSI above 50
- Price respecting ascending channel
- Volume spike confirming accumulation
💬 Narrative:
ETH continues to attract institutional interest, with inflows rising and sentiment shifting bullish. A clean break above 4350 could accelerate toward 4600, especially if BTC maintains strength.

ETH 1H Analysis - Key Triggers Ahead | Day 16💀 Hey , how's it going ? Come over here — Satoshi got something for you!
⏰ We’re analyzing ETH on the 1-Hour timeframe.
🔭 On the 1H timeframe for Ethereum, we can see that ETH has broken through its resistance zone at $4332. A pullback and consolidation above this level could give us strong trading opportunities. From a multi-timeframe pattern perspective, ETH is still trading inside a larger box, with significant distance remaining to the box’s upper boundary. If ETH confirms this breakout, the next resistance level sits around $4480, and a break above that could push ETH outside of its current range.
⛏ The key RSI zones are 70 and 37. If momentum crosses above 70 into Overbought territory, ETH could continue its current bullish trend.
💰 The size and volume of recent green candles on ETH have been increasing, supported by strong buying. The compressed range structure built during the weekend has now been broken with higher buying volume and the clearing of sell orders. As long as open interest remains strong, ETH has room to move higher.
🪙 Looking at the ETH/BTC pair on the 1H timeframe, it faked out below the marked support level and is now pushing upward. The key resistance here is at 0.03883, and a confirmed breakout above this level could fuel further upside for ETH against USDT.
💡 Currently, Ethereum is sitting in a crucial zone. Multi-timeframe confirmation above this level could give us a clean long setup. The immediate resistance zone is $4332, while further resistance levels can be mapped out with a Fibonacci retracement.
❤️ Disclaimer : This analysis is purely based on my personal opinion and I only trade if the stated triggers are activated .

Ethereum - long at 4050 (range low)Ethereum - long at 4050 (range low)
Global trned on ETH is still UP
i think for some time price could stay in a range
that's why range low is a premium area for taking LONG trade

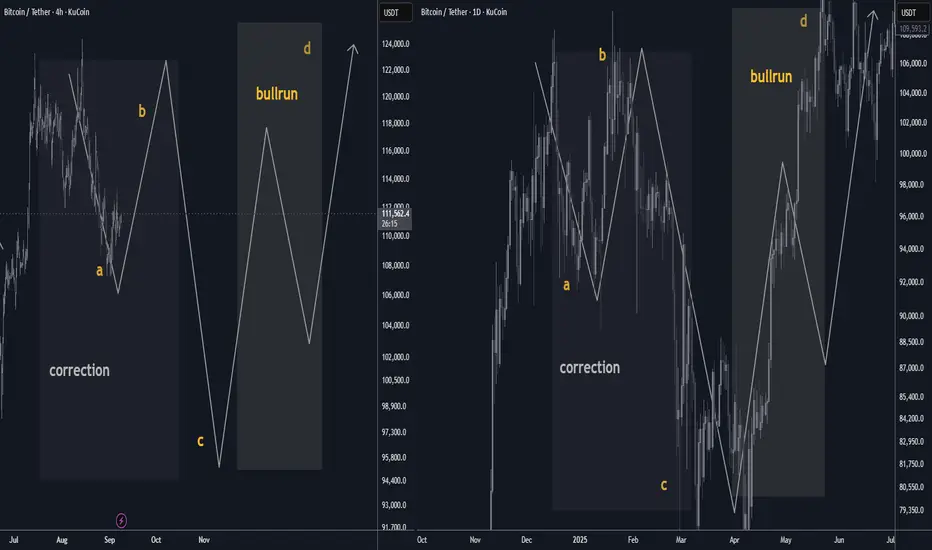
Bitcoin September 2025 Outlook: a/b/c price fractal structureBTC enters September post-ATH with a seasonal headwind. Base case: a ~10% A-leg dip toward $108k, a B-bounce into ~$122k, then a C-flush near ~$94k—echoing April’s ABC rhythm. Once complete, the uptrend should re-assert into year-end. 📉🔁📈 #Bitcoin #Seasonality #Crypto
🟠 Bitcoin September Outlook: Seasonality vs. Structure
After a fresh ATH, September’s historical bias skews mildly red. Base case is a ~10% A-leg dip that develops into an A/B/C correction before trend continuation. Think controlled pullback → consolidation → next markup. 📉➡️🔁➡️📈
________________________________________
🗓️ Seasonality Snapshot (2015–2024)
• Mean (10-yr): −2.55% · Median: −4.52%
• Red months: 6/10
• Worst September: 2019 (−13.88%)
• Best September: 2024 (+7.39%)
• Last 3 yrs avg: +2.8% (2024 +7.39%, 2023 +3.99%, 2022 −3.09%)
• Last 5 yrs avg (2020–2024): −1.3%
Read: September has tended to be weak, but the last two years printed green. Seasonality is a headwind—not a handbrake. 🌬️
________________________________________
🧩 Structure Thesis (Fractal Analog)
You’re looking for a repeat of April 2025’s A/B/C rhythm—scaled up:
• April 2025 reference: A ≈ $92k → B ≈ $106k → C ≈ $80k
• Now (projected):
o A ≈ $108k (≈ 10% pullback from recent highs) 📉
o B ≈ $122k (relief rally / lower high) 🔁
o C ≈ $94k (final flush into demand, completing the correction) 🧱
Interpretation: A measured September fade aligns with the A-leg. A reflexive B-bounce can follow as funding resets and late longs get cleaned up, with a C-leg completing the pattern before the next expansion. 🚀
________________________________________
📊 How Seasonality Supports the Call
• Typical drag: Median −4.5% and multiple red Septembers justify a down-bias.
• Volatility window: The historical 21-point spread (best +7.39% vs worst −13.88%) means a 10% dip sits well within normal bounds.
• Cycle context: With a new ATH just printed, a shallow corrective phase is constructive—not bearish regime change.
________________________________________
🧭 Levels & Triggers
• Bias line: Momentum cools into $108k → watch for seller absorption and open interest reset.
• Relief cap: $122k acts as B-rally resistance; sustained closes above $122k would invalidate the ABC idea and argue for immediate continuation. ✅
• Completion zone: $94k (C) is the buy-the-dip completion area; clean breaks below raise risk of a deeper time correction rather than a swift V-reversal. ⚠️
________________________________________
🧪 What to Monitor (Confirmation/Invalidation)
• Liquidity & OI: De-leveraging into A, controlled OI rebuild into B, washout into C.
• Spot-ETF flows / stablecoin issuance: Weakening into A, stabilizing by late month supports B→C rhythm.
• Funding/basis: Overheated → normalize during A; negative spikes near C often mark capitulation.
• Breadth (alts): Underperform into A/C; broad risk-on breadth usually returns post-C.
________________________________________
📝 Base Case Path (Textbook)
September: drift to $108k (A) → bounce toward $122k (B) → final tag of ~$94k (C) → reset + markup into Q4.
(If price reclaims and holds above $122k early, treat that as trend continuation—not a correction.)
________________________________________
🔒 Risk Notes
• Seasonality is a tendency, not a rule. Macro catalysts (CPI, policy, liquidity) can dominate calendar effects.
• This is market commentary, not financial advice. Manage risk and invalidation levels. 🛡️
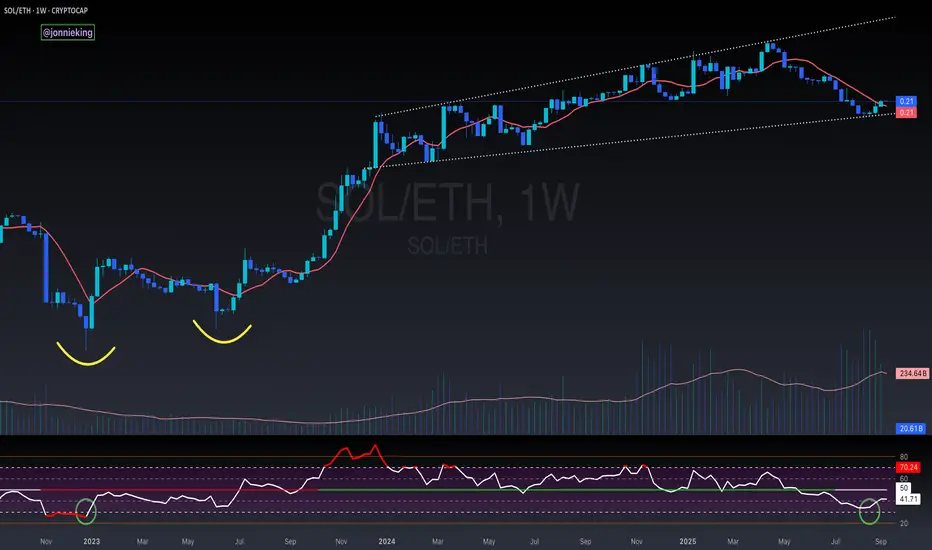
$SOL / $ETH REVERSAL * ALT SEASON *🚨 The CRYPTOCAP:SOL / CRYPTOCAP:ETH REVERSAL has officially been confirmed.
✅ 3 White Solders
✅ Weekly close above 9WMA
✅ Broadening Wedge
Money is moving down risk, which brings outsized returns.
BRIEFING Week #36 : Oil Prices Diverge from RealityHere's your weekly update ! Brought to you each weekend with years of track-record history..
Don't forget to hit the like/follow button if you feel like this post deserves it ;)
That's the best way to support me and help pushing this content to other users.
Kindly,
Phil

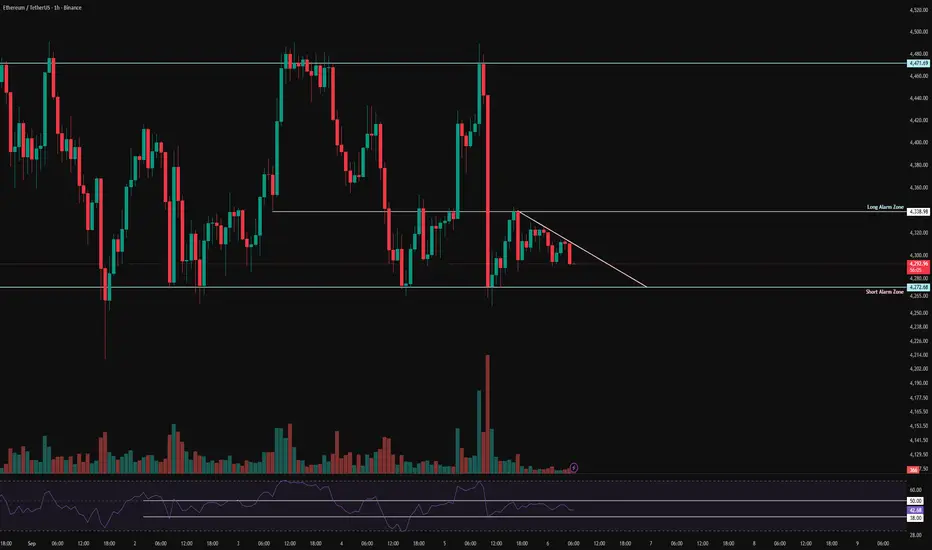
ETH 4H Analysis - Key Triggers Ahead | Day 15💀 Hey , how's it going ? Come over here — Satoshi got something for you !
⏰ We’re analyzing ETH on the 4-Hour timeframe .
🔭 On the 4-hour timeframe for Ethereum, we can see that ETH is currently moving inside a very strong box and is preparing for this week’s upcoming news. The resistance (ceiling) of this box sits at $4,471, while the support (floor) is around $4,254. Once either of these levels is broken, Ethereum could make a strong move after this long consolidation phase. There’s also an early trigger zone at $4,332; if ETH breaks and stabilizes above this level, we can consider entering a position toward the top of the box.
⛏ Key RSI levels for Ethereum are at 58 and 40. Breaking these ranges could signal the start of a strong move. With increased volatility, ETH could even push toward the overbought (OB) or oversold (OS) zones.
💰 Currently, the size and volume of candles have dropped significantly — something we often see during holiday sessions. But with the start of the new week and upcoming economic reports, Ethereum could generate bigger candles and stronger momentum once it breaks out of this box.
🪙 Looking at the ETHBTC pair on the 4-hour timeframe, the chart still looks bearish with decreasing volume. The current zone is considered a maker-buyer area, and we’ll need to watch how the whales react here. If this level is lost, Ethereum could face a deeper correction and move toward its lower support levels.
💡 Ethereum currently has 3 alarm zones:
A short alarm zone at the bottom of the box — if broken, it could trigger stronger selling pressure.
A long alarm zone #1 at $4,332, acting as an early trigger for a potential breakout toward the top.
A long alarm zone #2 at $4,471 — breaking and holding above this level could lead to a solid upward move.
❤️ Disclaimer : This analysis is purely based on my personal opinion and I only trade if the stated triggers are activated .

Ethereum (ETH/USDT) – Neowave UpdateEthereum continues to move inside a short-term descending channel. Based on the Neowave count, the current structure can be interpreted as wave G of a Diametric pattern.
🔑 Main Scenario:
• If ETH manages to hold above 4315, buyers could regain control.
• In that case, a move toward the channel’s upper boundary around 4410 is likely, completing wave G of the Diametric.
⚠️ Alternative Scenario:
• Failure to sustain above 4315 will keep the bearish tone intact.
• In this case, ETH may retest the lower boundary of the channel, with possible extensions toward 4200–4150.
📌 Conclusion:
Ethereum is at a decision point. A confirmed breakout above 4315 opens room for a rally to 4410, while rejection from this level could extend the corrective phase lower.

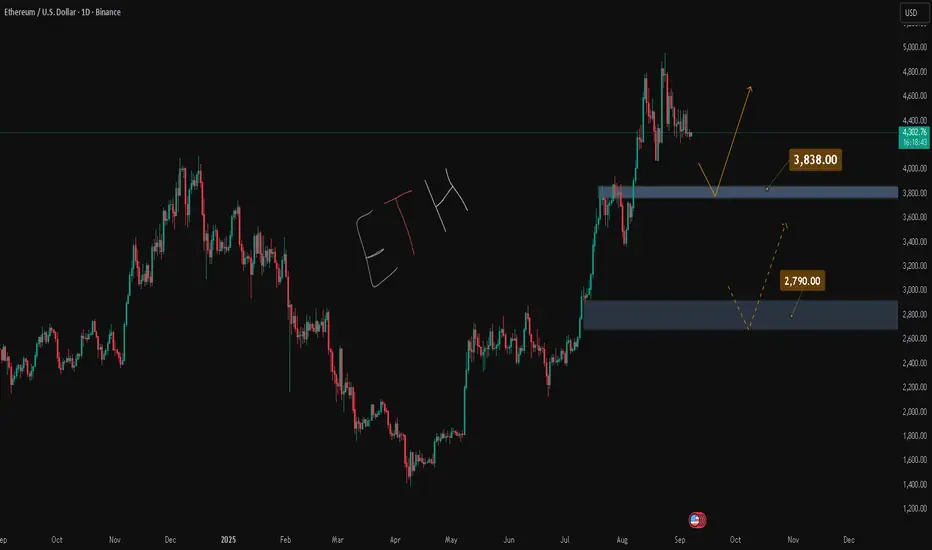
ETH - Good support levelsWell, about Ethereum , I should say:
The price could drop sharply,
but upon reaching the specified support levels, it recovers and moves upward.
Understanding Consolidation & Trading itWhat Consolidation Is
Consolidation is a market phase where price moves sideways within a defined range, showing indecision or balance between buyers (bulls) and sellers (bears).
Characterized by low volatility, overlapping candles, and no clear trend direction.
Often occurs after strong moves (as the market pauses) or before breakouts (accumulation/distribution).
Impact on Bulls & Bears
Bulls: View consolidation near highs as accumulation (buyers building positions before a breakout upward).
Bears: View consolidation near lows as distribution (sellers unloading before a breakdown).
Both sides place stop orders outside the range → creating liquidity pools that smart money hunts.
How Traders Can Take Advantage
Range Trading – Buy near support of the range, sell near resistance, until breakout occurs.
Liquidity Strategy – Wait for fakeouts beyond consolidation, then trade in the opposite direction (stop hunt setup).
Consolidation Across Timeframes
Lower Timeframes (1m–15m):
Looks like noise but is often where scalpers range trade.
Breakouts can give small but quick moves.
Mid Timeframes (1H–4H):
Shows clear accumulation/distribution phases.
Useful for intraday & swing traders.
Higher Timeframes (Daily–Weekly):
Represents major market indecision.
Breakouts from these zones often fuel massive trend moves.
✅ Summary:
Consolidation = sideways range = balance of bulls & bears.
Inside range → fade the extremes.
Outside range → trade support & resistance or liquidity sweep.
On different timeframes → the same consolidation can be noise on 5M, but a critical accumulation on the Daily chart.

TradeCity Pro | Ethereum Consolidates in Descending Triangle👋 Welcome to TradeCity Pro!
In this analysis I want to review Ethereum for you. Ethereum is by far the most popular altcoin in the market and with a market cap of 520 billion dollars it is ranked 2nd on CoinMarketCap.
⏳ 4-Hour Timeframe
After the bullish leg that started from the bottom of 3380, Ethereum broke 3890 and reached the top of 4806, managing to register a new all-time high.
✨ Currently, the price is in a corrective and ranging phase and has corrected down to the 0.382 Fibonacci level, forming a Maker Buyer zone near this area.
⚡️ A descending trendline has also formed, where the price has tested it multiple times, creating a descending triangle between this trendline and the Maker Buyer zone.
📈 With a breakout of this trendline, we can open a long position. The trendline trigger is at 4488, and this position can be taken as a pre-breakout entry before 4806, with the main trigger being the breakout of 4806 itself.
🔽 On the other hand, if the triangle breaks to the downside, the price will move towards lower Fibonacci levels and can correct down to 3890.
💫 In my opinion, as long as Ethereum is above the 3890 level, its trend remains fully bullish, and if it is supported in this current zone, the next leg up will start even stronger.
💥 The first confirmation of a trend reversal will be if the price stabilizes below 3890, but currently, the price is still far from this level, and as long as it is above it, opening short positions is not logical.
📝 Final Thoughts
Stay calm, trade wisely, and let's capture the market's best opportunities!
This analysis reflects our opinions and is not financial advice.
Share your thoughts in the comments, and don’t forget to share this analysis with your friends! ❤️

ETH 1H Analysis - Key Triggers Ahead | Day 14💀 Hey, how's it going ? Come over here — Satoshi got something for you!
⏰ We’re analyzing ETH on the 1-hour timeframe timeframe.
🔭 On the 1H timeframe for Ethereum, we can see that after yesterday’s news, ETH pushed upward toward the top of its range but failed to break out. From that resistance, it faced a heavy rejection, and this drop happened within just two 1H candles! At the moment, ETH is in a consolidation zone, and breaking out of this compression could provide us with an entry.
⛏ The key RSI oscillator levels are at 38 and 50. Once RSI breaks above or below these zones, Ethereum could start its next move following the effects of yesterday’s NFP news.
💰 The size and volume of red candles have increased sharply, showing strong selling pressure. The corrective bounce happened step by step, but then another fairly large red 1H candle was printed. With continued selling pressure, Ethereum may test lower price levels.
🪙 On the 1H timeframe for the ETHBTC pair, we can see it is moving inside a multi-timeframe range. Each time it reaches the bottom of the box, volume increases and the price reacts with zig-zag moves. Note that the bottom of this box is at 0.03864, which has already been tested twice. This area should be considered as a short alert zone for ETHBTC.
💡 The alert zones for Ethereum itself are at 4,272$ and 4,338$. If either of these levels is broken, ETH could start a strong move, especially considering the momentum after yesterday’s NFP News.
❤️ Disclaimer : This analysis is purely based on my personal opinion and I only trade if the stated triggers are activated .
ETHUSD - ATH An idea showing a curved resistance trend line that I think could be hit as a high for price
this would put price at nearly 10K which is crazy
I suspect the white line is support due to previous breakthrough and it no longer being resistance as before.
Aim for the dotted line up.
Daily chart

ETHUSD 4Hr - Strong Horizontal SupportETH has been hodling this horizontal support line quite well with one recent dip then sudden recovery below it
This drop below can be shown with a trend line with dotted line
I think price will hodl the horizontal and break out as predicted by the two prior breakouts along this line.
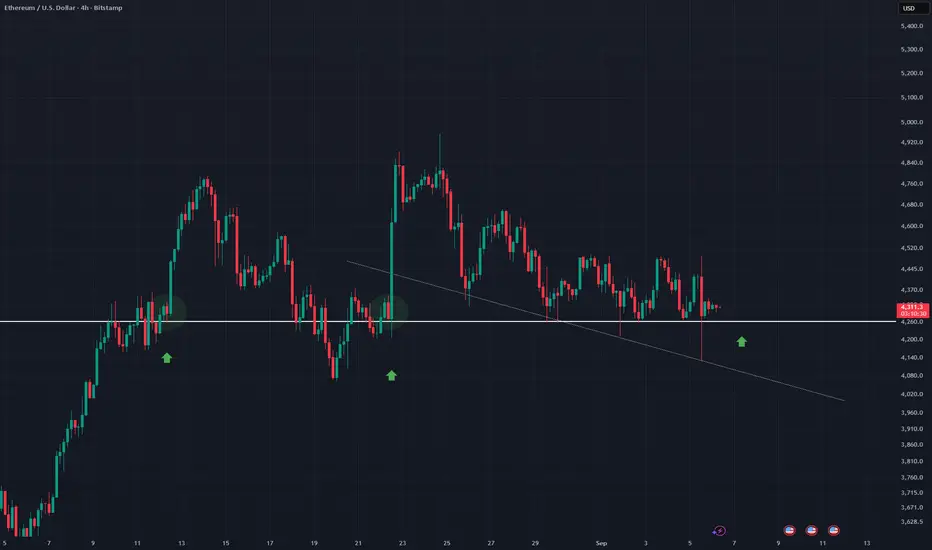
ETH – Watching the Falling Channel!Ethereum is currently trading within a falling channel on the 4H timeframe, showing short-term bearish pressure.
Price is approaching the support zone around the $4,000–$4,100 area, which also aligns with the lower boundary of the channel.
As long as this zone holds, it could act as a springboard for bullish momentum, offering a potential long setup.
A breakout from the channel would further confirm buyer strength and open the way toward the resistance zone near $4,800–$4,900.
⚠️ Disclaimer: This is not financial advice. Always do your own research and manage risk properly.
📚 Always follow your trading plan regarding entry, risk management, and trade management.
Good luck!
All Strategies Are Good; If Managed Properly!
~Richard Nasr
ETH 1H Analysis - Key Triggers Ahead | Day 13💀 Hey , how's it going ? Come over here — Satoshi got something for you !
⏰ We’re analyzing ETH on the 1-hour timeframe timeframe .
🔭 On the 1H timeframe of Ethereum, we can see that ETH has had a solid upward move and is now facing resistance at $4416. If this level breaks, price could move toward the next resistance at $4481. A early trigger for a long position is right at the current level, which I’ve already used to open a trade. I’ve also set a low-risk order around $4481, which is the top of ETH’s box structure on the multi-timeframe view.
⛏ The key RSI zones for ETH are around 50 and 70. Breaking out of these levels could trigger a strong leg. With news coming, volatility is expected to increase sharply. ETH is currently trading below 70 but above 50, which suggests long setups have more momentum.
📊 The size and volume of ETH’s green candles are increasing, showing clear buying strength. If today’s NFP news comes out positive, ETH could make a very strong upward leg.
💸 On the 1H ETHBTC chart, the pair is inside a descending channel, and within this channel, it has formed a tight box-like consolidation. The box top is at 0.03999, while the bottom sits at 0.0387. With higher volume and volatility, ETHBTC could break out, leading to either a pump or a dump in Ethereum.
💡 The alarm zones for Ethereum are set at $4416 and $4481. Breaking and holding above these levels can provide strong trading opportunities. Personally, I’ve already opened a position on the $4416 breakout, and I plan to add more size if the $4481 zone is taken out. The NFP release could bring momentum similar to last time, with sharp and powerful moves.
❤️ Disclaimer : This analysis is purely based on my personal opinion and I only trade if the stated triggers are activated .

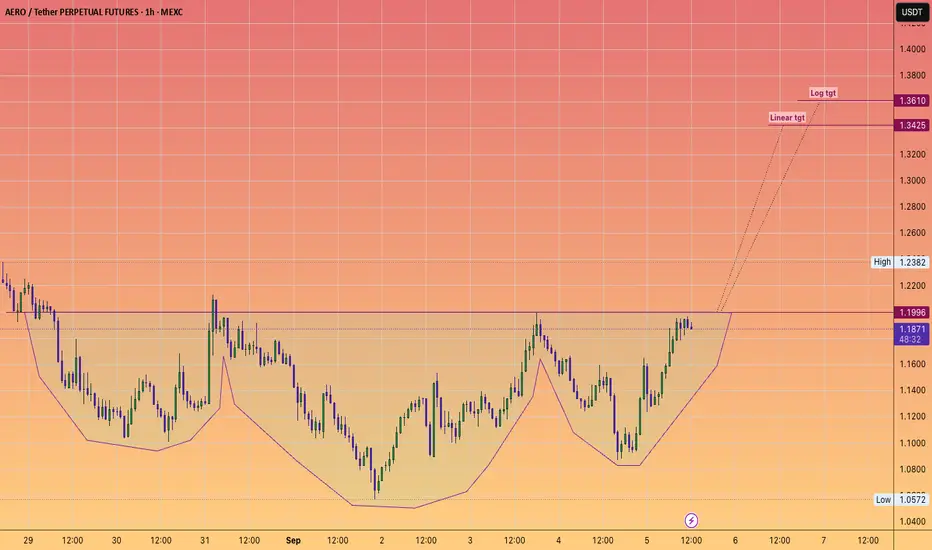
*Trade IDEA* Aerodrome to $1.35Inverse Head and shoulder is about to trigger.
"How Aerodrome Integrates with Coinbase Base DEX
Aerodrome's integration with Coinbase's Base DEX has been a game-changer for the platform. This partnership has created a powerful liquidity flywheel, with approximately 44% of Base's GDP flowing through Aerodrome. Post-integration, the platform experienced a 30% surge in trading volume and achieved a staggering $1.17 billion in 24-hour trading volume. By leveraging Coinbase's robust infrastructure, Aerodrome has simplified DeFi access for millions of users, making it a pivotal player in the Base ecosystem.
AERO Tokenomics: A Model for Sustainable Growth
Aerodrome's native token, AERO, is at the heart of its ecosystem. The platform employs dynamic emission throttling, reducing token inflation to just 1%. This ensures sustainable yields for liquidity providers while preserving the token's long-term value. Additionally, Aerodrome's ve(3,3)-style governance model incentivizes liquidity growth and rewards token holders with swap fees and staking benefits. This innovative approach has driven an 80% price surge for AERO, solidifying its appeal among investors and users alike."
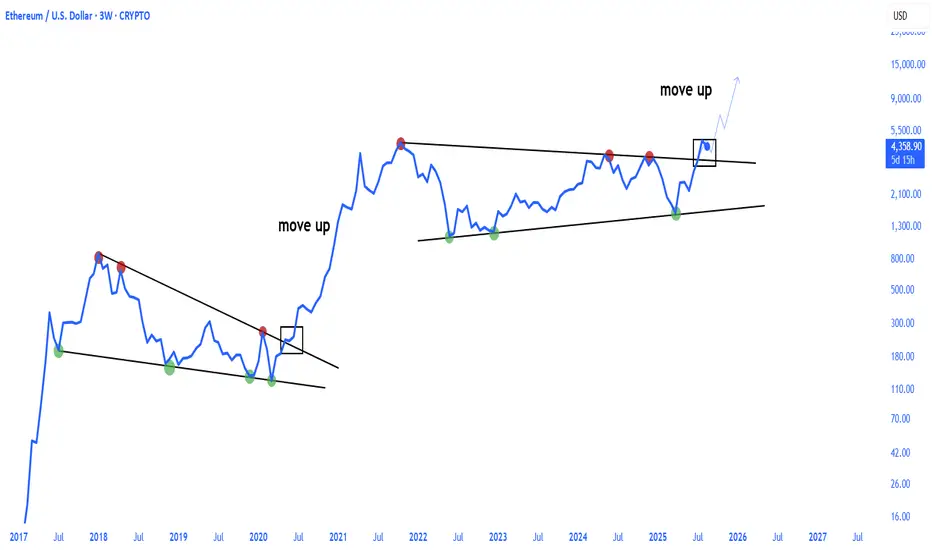
Don't sleep on Ethereum!Ethereum is following the pattern seen before the 2021 bull run of Bitcoin, and we are now in the final stages before the parabolic run for Ethereum.
CRYPTOCAP:BTC 2017\2021 vs. CRYPTOCAP:ETH 2021\2025

Up to 100%+ on PIVXTo date, sales in the altcoin market continue within the framework of seasonal dynamics, which are likely to last at least until the middle of the month. Binance continues to exert pressure by delaying the announcement of the assignment of the monitoring tag to new coins, under the threat of which investors are wary of further purchases. The first week of the month ends today and once again there is no announcement. The probability has increased that the tag will not be assigned this month. In this regard, I am trying to take into account the most oversold coins relative to the current market position, which can break through against seasonal sales.
Pivx looks the most interesting, which has already made a profit several times this year. The July momentum broke through one of the downtrend lines, starting a smooth trend change from strong long-term support at 0.125. This month opened above the level, as did the quarter, which could lead to a powerful growth momentum before the end of the quarter with an attempt to consolidate above 0.21-25 and profit up to 100%+. Due to the likely absence of the assignment of the monitoring tag this month, growth may begin as early as tomorrow. In this case, the trend can be quite stable. If the breakdown occurs on working days and against the background of a general drawdown of the market, then there is a high probability of a rebound from 0.21-25 with a stable trend from the second half of the month. In the new week, it is worth keeping short stops in the morning, as binance may deviate from its own rules and assign a monitoring tag in the second week of the month.
Also, fantokens are still safe this month, without entering the delisting and monitoring announcement. However, seasonal sales had a strong impact on them in the summer, and they are likely to smooth out the dynamics now. In this regard, I'm trying to take only the most oversold atm and acm.
Due to the lack of a monitoring announcement, waves of growth up to 30-40% above current levels may also result from fio chess cos, however, if seasonal sales accelerate in the new week, there is a possibility of an additional drop in prices to 20-25%.
Against the background of the general market decline, highly oversold but also dangerous coins with the bsw fis voxel bifi flm rei monitoring tag with possible growth impulses of up to 50% may be interesting for speculators. However, it should be borne in mind that if there is no growth, they may be delisted in the new month.
