$ETH - Ping-Pong ZoneCRYPTOCAP:ETH is sitting under this diagonal resistance. Could see a technical bounce around 2.9k (ltf support) , but if we can’t clear 3.1k, we could see it retesting 2.8k to 2.7k
Bottoms don’t form overnight, so Ethereum will probably keep ping-ponging in this 2.6k–3.1k range for a bit before the next move.
ETH

ETHUSDT — Bearish Flow Targeting 2,956ETH is still trading below the key intraday resistance at 3032–3045, keeping the bearish structure intact.
As long as price fails to break and hold above this zone, downside pressure is expected to continue.
The current Fibonacci sequence supports a continuation lower, with price showing repeated rejections around the 0.333 / 0.236 levels.
This keeps the market biased toward the next liquidity pocket.
📉 Main bearish target: 2,956
This level aligns with the Fib 1.0 extension, making it the next high-probability destination if bearish momentum persists.
A break above 3045 would invalidate this scenario; otherwise, ETH remains on track toward 2,956.

ETHUSD - Monthly RSI ViewMy view on the Monthly RSI for ETH, expecting another extension upward on the RSI towards the green circle. This creates a huge W pattern and allows another bull run.
Vertical lines show the middle of the previous and current bull run.
Good time to enter into ETHUSD on this Monthly timeframe.

ETHBTC - Flipped from Bearish to BullishETH can be seen to have extreme resistance in the past with this 200MA
However now price has broken above it and is using it now as support on this daily timeframe.
I expect ETH to rally hard with this resistance to support flip.

ETHUSD - Inverted H&S An inverted H&S pattern forming with only the right shoulder yet to complete.
I expect following the right shoulder upward movement to come, not sure how much but it will be there.
Chart pattern analysis on this daily timeframe.
Alt season?

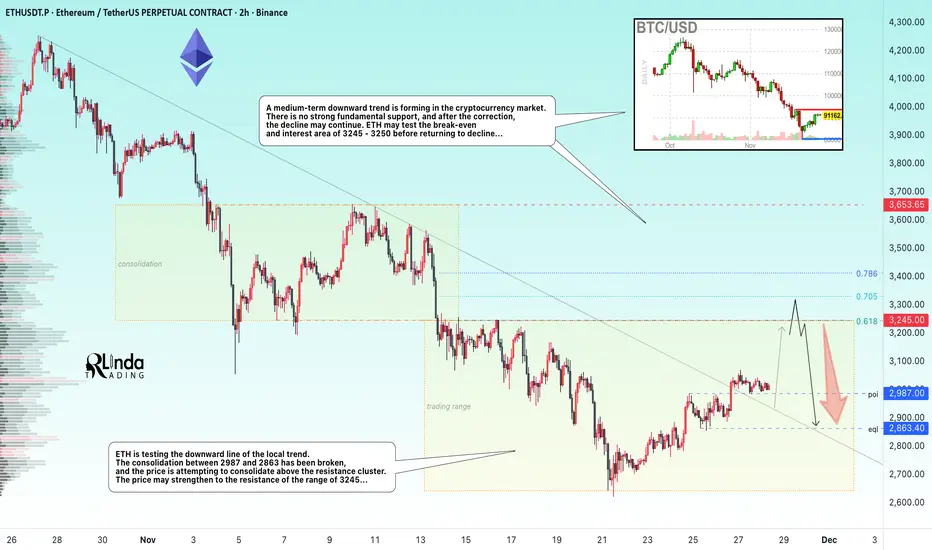
ETHEREUM → Countertrend correction. The hunt for liquidity BINANCE:ETHUSDT is testing the downward trend line and attempting to break through the resistance conglomerate. Overall, against the backdrop of low liquidity, the market has the opportunity to test 3245...
Against the backdrop of low liquidity and without the presence of the American side in trading, ETH is testing the downward line of the local trend. A medium-term downtrend is forming in the cryptocurrency market. There is no strong fundamental support, and after the correction, the decline may continue. Any attempts at growth at this point can be seen as an opportunity to sell profitably...
A breakout is forming and an attempt is being made to keep the price in the long zone. If the bulls keep the price above 2897 after retesting support, the price is likely to strengthen to the resistance range of 3245... However, a false breakout (liquidity capture) of key resistance may remind the market of the relevance of the downward trend...
Resistance levels: 3000, 3245
Support levels: 2987, 2863
I expect two movements. If the price stays above 2987 (after retesting), then Ethereum will be able to retest the resistance of the range. A false breakout of the resistance range could trigger a price decline within the global downtrend that has been developing for 3 months...
Best regards, R. Linda!
ETH — Scaling Mastery Trendlines: Strat!This ETH setup combines three Scaling Mastery setups—the 1/10, 1/4, and 1/3 structures—stacked inside the same region. That alone makes this a high-value educational chart, because seeing all three appear together is rare.
1️⃣ Scaling Mastery Trendlines (1/10 • 1/4 • 1/3 Sets)
This chart uses the official Scaling Mastery Trendline System, where each trendline ratio tells you a different part of market behavior:
🟧 1/10 Trendline
Shows micro-reaction structure
Helps detect early shifts in momentum
Usually breaks first and gives the initial signal
ETH already broke this one cleanly.
🟦 1/4 Trendline
Shows medium-level structure
Confirms trend bias and filters false moves
ETH is currently retesting/reclaiming this region.
🟩 1/3 Trendline
The strongest diagonal structure
When this breaks, major HTF direction usually follows
ETH is attempting to push into this breakout zone now.
Having all three ratios interacting inside the same price zone is extremely valuable because:
➡️ It shows a stacked confluence of momentum
➡️ It forms a “ladder” of breakout confirmations
➡️ It gives a clean model for trend reversal and expansion
2️⃣ Bullish + Bearish Trendlines Forming a Hidden Channel
When you overlay:
The bearish red channel (recent downtrend)
The bullish turquoise macro expansion trendlines
…you actually get a dual-channel structure.
This means ETH is breaking both:
✔ The bearish downtrend channel
✔ Into the bullish expansion channel
At the same time.
This is a classic Scaling Mastery visual where bearish and bullish diagonals overlap and create a “channel breakout zone.” ETH is currently reacting inside that zone.
3️⃣ Expected Behavior if Breakout Holds
If ETH continues to hold above the 1/10 → 1/4 → 1/3 progression:
🎯 Target 1: $3,941
Mid-channel expansion target.
🎯 Target 2: $4,729 – $4,800
Full expansion to the upper turquoise trendline.
This aligns with standard Scaling Mastery expansion rules.
4️⃣ Structure Summary
1/10 broken ✔
1/4 reclaim attempt ✔
1/3 test incoming ✔
Bearish + Bullish diagonal confluence ✔
Dual-channel breakout structure ✔
Clear expansion targets to the upside ✔
This is a clean educational example of multi-trendline alignment, a signature technique of the Scaling Mastery system.
⚠️ Educational Disclaimer
This idea is for educational purposes only. It is not financial advice or a trade signal. Always analyze your own charts and manage your own risk.

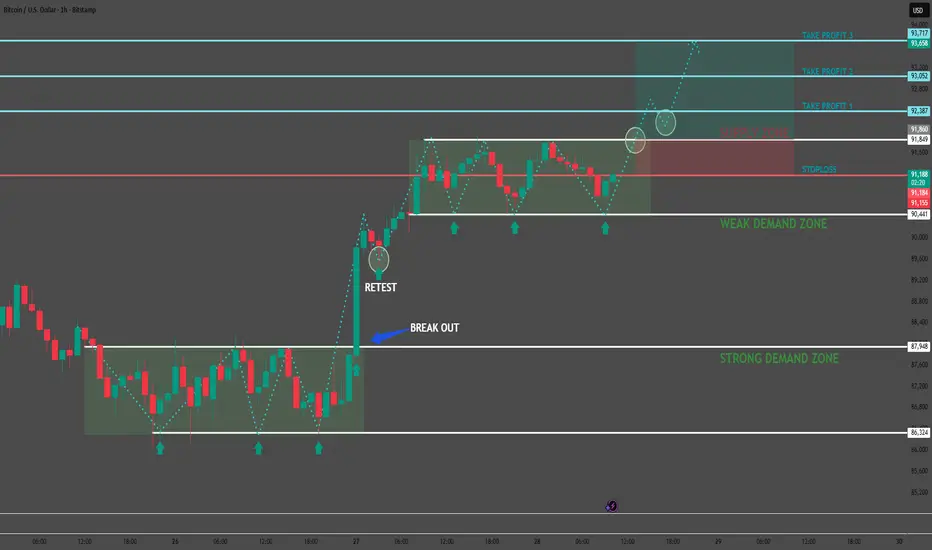
Bitcoin Loading a Breakout Continuation 📌 TECHNICAL ANALYSIS — BTC/USD (1H)
The market continues to maintain a clear bullish structure, with a consistent sequence of higher lows (HL) forming directly inside the Weak Demand Zone. After breaking out of the previous consolidation range, price delivered a clean retest, followed by a strong impulsive move upward confirming solid buy-side absorption.
🎯 PRIMARY SCENARIO — Continuation to the Upside
- As long as price holds above 90,850, the bullish structure remains intact.
- The Weak Demand Zone continues acting as a launchpad for bullish continuation.
- A decisive break above 92,387 will likely accelerate momentum and open the door for extended upside targets.
📈 TRADE SETUP (Precision Levels)
- Buy Entry: 91,250 – 91,350
(A pullback into equilibrium before continuation)
- Stop Loss: 90,850
(Protected below demand + previous swing low to avoid noise)
- Take Profit Levels:
TP1: 92,387
TP2: 93,052
TP3: 93,717
📌 TRADE RATIONALE
- The market is printing a textbook Higher High – Higher Low structure.
- Breakout followed by a clean retest confirms trend continuation.
- Demand zones show strong absorption — no lower lows created.
- Clear liquidity void above → high probability for price expansion into higher targets.
- The supply structure above is thin, increasing the likelihood of a breakout.
🔍 SUMMARY
BTC is currently behaving exactly as expected within a bullish continuation model.
As long as 90,850 holds, upside projection toward 92,387 → 93,717 remains the highest-probability scenario.
Stay disciplined — every candle tells a story, but only a patient trader profits from the ending.
Share your thoughts in the comments — what’s your bias on the next move?
ETH/USD 1D chart review1️⃣ Trend and general context
• ETH is trading after a sharp decline from its local high of ~4,000+.
• The price rebounded from a quite strong support zone around ~2,750–2,800.
• Current price: ~USD 3,034 → the market is testing the first local resistance.
Short-term trend: down, but a rebound and the first signs of reversal are visible.
Long-term trend: still upwards (HL/HH on large intervals).
⸻
2️⃣ Key Levels (from your chart)
🟩 Resistances
• USD 3,475 – key resistance + SMA (blue)
👉 if ETH breaks this level and closes 1D above → strong bullish signal.
• USD 4,061 – major resistance from previous highs.
🟥 Support
• USD 2,757 – the nearest strong support after breaking the trendline.
• USD 2,126 – very key macro support (bottom of consolidation).
⸻
3️⃣ Medium SMA
From your chart:
• Red SMA #1 – price is just above it → first positive signal.
• Blue SMA #5 – Acts as resistance and is currently being tested from below.
• Green SMA #2 – higher, acts as resistance at ~USD 3.475.
➡ The price must return above the blue and green SMA to confirm the return of the upward trend.
⸻
4️⃣ MACD
• The MACD at the bottom of the chart begins to curl upwards.
• The histogram decreases towards zero → the downward momentum weakens.
• Bullish cross is still missing, but it's getting closer.
Conclusion: Early signal of trend reversal, but not confirmed.
⸻
5️⃣ RSI
• RSI is in the zone around 40 → quite low, but not extremely.
• Slight divergence: the price made a lower low, the RSI made a higher one.
👉 This is a bullish signal, but only in combination with a resistance breakout.
⸻
6️⃣ Price Action
You can see:
• A long rising candle after a bounce from below.
• We are approaching the first important resistance at ~3.100–3.150.
To confirm continuation, you need:
✔ Closing of the 1D candle above ~3.150–3.200.
⸻
🎯 What might happen next?
Bull scenario (more likely if BTC also increases)
1. Breakout 3,150–3,200 → retest → move to:
• USD 3,475 (major resistance + SMA)
• then 3,800+
2. MACD makes a bullish cross → momentum is growing.
Probability: ~60%, but confirmation only after the breakout.
⸻
The Bears Scenario
1. Rejection from SMA (blue) and return below 3,000
2. Down to 2,750-2,800 again
3. If this breaks → move towards $2.126
Probability: ~40% at this point.

ETH 4H – Trendline Rejecting, But Does Price Sweep $2,629?ETH tapped into the 0.5–0.786 Fib retracement zone, directly under the macro downtrend line, creating a strong cluster of resistance. Price rejected both the 50 EMA (yellow) and 100 EMA (purple) on the retest, confirming continuation of the 4H downtrend.
The key downside target is the $2,629 liquidity level, where previous wicks, volume clusters, and demand reactions formed. With Stoch RSI fully overbought and rolling over, momentum supports a move lower unless ETH can reclaim the 50/100 EMAs with a strong impulsive candle.
A break above the trendline would invalidate the short-term bearish structure and reopen targets toward $3,140 – $3,260 (0.5 and 0.618 retraces).
Until then, the path of least resistance remains toward liquidity below.

ETH/USDT | Ethereum Breaks 3000 and Momentum Still Points HigherCRYPTOCAP:ETH pushed all the way to 3000 and the bullish view is still fully intact. From the 2600 rebound to here the move has delivered more than 17 percent already and the structure still supports continuation. As long as ETH holds above the 2500 to 2700 demand zone the upside targets remain 3200, 3500, and 4000 in the next major leg. On the supply side the important zones sit at 3200 to 3300 and then 3500 to 3600 where price may slow down before the next breakout. For now momentum belongs to buyers.
Please support me with your likes and comments to motivate me to share more analysis with you and share your opinion about the possible trend of this chart with me !
Best Regards , Arman Shaban

ETH hit my downside target now what?Wave 1 appears to have completed a leading diagonal with a poke above all-time high- what we expect from wave 1. Wave 2 is underway, testing the weekly 200EMA so far, and an expected reversal point- also the 0.382 Fibonacci retracement.
The retracement has been shallow, but ETH was beaten down and undervalued, making a shallow pullback expected. The 0.5 Fibonacci retracement is the next downside target at the S1 pivot.
🎯 Terminal target for the business cycle could see prices as high as $9000
📈 Weekly RSI was oversold with bearish divergence and has now reset below the channel EQ.
👉 Analysis is invalidated only if we get below the wave (4) bottom $1365
Safe trading

ETHUSD H4 | Bearish Reversal Off Pullback ResistanceMomentum: Bearish
Price is rising toward the sell entry, which sits slightly above the 50% Fibonacci retracement and remains below the Ichimoku Cloud — maintaining a bearish bias.
Sell Entry: 3,208.29
Pullback resistance
Slightly above the 50% Fibonacci retracement
Stop Loss: 3,402.89
Pullback resistance
Aligning with the 50% Fibonacci retracement
Take Profit: 2,786.67
Pullback support
High Risk Investment Warning
Stratos Markets Limited (tradu.com), Stratos Europe Ltd (tradu.com ):
CFDs are complex instruments and come with a high risk of losing money rapidly due to leverage. 70% of retail investor accounts lose money when trading CFDs with this provider. You should consider whether you understand how CFDs work and whether you can afford to take the high risk of losing your money.
Stratos Global LLC (tradu.com): Losses can exceed deposits.
Please be advised that the information presented on TradingView is provided to Tradu (‘Company’, ‘we’) by a third-party provider (‘TFA Global Pte Ltd’). Please be reminded that you are solely responsible for the trading decisions on your account. Any information and/or content is intended entirely for research, educational and informational purposes only and does not constitute investment or consultation advice or investment strategy. The information is not tailored to the investment needs of any specific person and therefore does not involve a consideration of any of the investment objectives, financial situation or needs of any viewer that may receive it. Past performance is not a reliable indicator of future results. Actual results may differ materially from those anticipated in forward-looking or past performance statements. We assume no liability as to the accuracy or completeness of any of the information and/or content provided herein and the Company cannot be held responsible for any omission, mistake nor for any loss or damage including without limitation to any loss of profit which may arise from reliance on any information supplied by TFA Global Pte Ltd.

Bullish bounce?Ethereum (ETH/USD) is falling towards the pivot and could bounce to the 1st resistance, which aligns with the 61.8% Fibonacci retracement.
Pivot: 2,994.49
1st Support: 2,878.88
1st Resistance: 3,233.25
Disclaimer:
The opinions given above constitute general market commentary and do not constitute the opinion or advice of IC Markets or any form of personal or investment advice.
Any opinions, news, research, analyses, prices, other information, or links to third-party sites contained on this website are provided on an "as-is" basis, are intended to be informative only, and are not advice, a recommendation, research, a record of our trading prices, an offer of, or solicitation for, a transaction in any financial instrument and thus should not be treated as such. The information provided does not involve any specific investment objectives, financial situation, or needs of any specific person who may receive it. Please be aware that past performance is not a reliable indicator of future performance and/or results. Past performance or forward-looking scenarios based upon the reasonable beliefs of the third-party provider are not a guarantee of future performance. Actual results may differ materially from those anticipated in forward-looking or past performance statements. IC Markets makes no representation or warranty and assumes no liability as to the accuracy or completeness of the information provided, nor any loss arising from any investment based on a recommendation, forecast, or any information supplied by any third party.

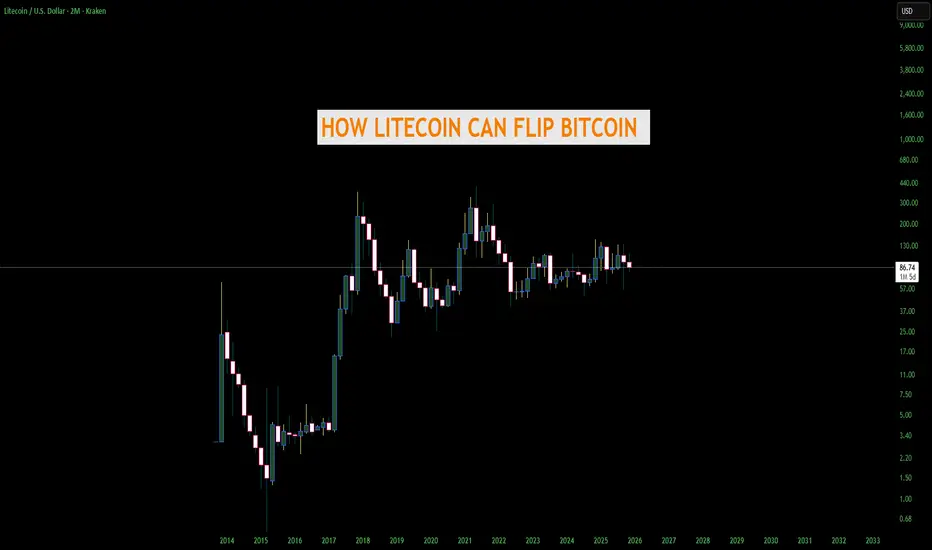
THE DAY LITECOIN FLIPS BITCOIN AND BECOMES #1 - AND HOWGrok helped me with this but regardless this is a great read. Not financial advice
1. Bitcoin fees explode again (> $50–$200 per transaction)
LTC stays under 5¢ and 4× faster → merchants & users flee to “digital silver” for actual payments
-Historical precedent: May 2017 & Dec 2017 fee madness → LTC pumped from $4 → $375 in weeks; repeated in May 2021 → $410 ATH
2. Bitcoin blocks stay full for months (Ordinals / Runes / BRC-20/ and now unlimited SPAM clog the chain again)
People rediscover Litecoin as the cheap, fast, on-chain alternative that actually works for daily spending
-Historical precedent: 2023–2024 Ordinals era → LTC quietly 3×–4× while BTC was practically unusable for small amounts
3. Major nation/state bans or heavily restricts Bitcoin mining or self-custody
LTC is smaller, less of a political target → miners add Scrypt rigs, capital rotates
-Historical precedent: China 2021 mining ban → Litecoin hashrate and price both spiked hard in the following months
4. A confirmed 51% attack or large double-spend actually happens on Bitcoin
Trust in BTC’s immutability shatters overnight → Litecoin (merged-mined with Dogecoin) suddenly has higher combined attack cost and looks safer
-Historical near-miss: 2018–2019 51% attack fears on smaller chains sent LTC up +150% in pure rotation plays
5. Credible quantum-break announcement or real progress scare (2026–2030 timeline moves up)
Litecoin’s MWEB addresses are already quantum-resistant + dev team can soft-fork faster than Bitcoin’s politics allow
-Historical precedent: 2023–2024 quantum FUD alone gave privacy coins and quantum-ready projects 3–10× pumps
6. Litecoin ETF (e.g., Canary Capital's) faces post-launch outflows or SEC-mandated tweaks due to BTC ETF dominance, while Bitcoin ETFs pull in record inflows
BTC ETFs become the unchallenged "institutional safe bet," capping BTC's retail upside → sidelined investors, retail traders, and altcoin funds rotate into the now-proven LTC ETF as the "next logical step" for legacy alts (with Canary/Grayscale already live and showing strong early volume)
-Historical precedent: ETH ETFs in 2024 saw initial outflows vs. BTC's inflows → ETH still 2–3×'ed on rotation; SOL's 2025 ETF launch pumped despite similar early teething issues
7. Lightning Network suffers major centralization scandals, hub failures, or routing collapses
People remember Charlie Lee’s original pitch: simple, fast, cheap, on-chain money with no layer-2 headaches
-Historical precedent: 2023–2025 Lightning UX complaints repeatedly drove spikes in LTC daily transaction volume and price
8. Bitcoin loses the “first-mover narrative” to a new nation-state adoption
Example: a major country (Brazil, Argentina, Indonesia, etc.) announces it will use Litecoin instead of Bitcoin for remittances or reserves because LTC is 4× faster and 100× cheaper.
-Precedent: El Salvador 2021 BTC adoption pumped Bitcoin; a “Litecoin country” would do the same or more for LTC.
9. PayPal, Venmo, Cash App, or Stripe re-activates Litecoin for instant zero-fee withdrawals/deposits
They all supported LTC years ago and dropped it only because of 2018 bear market. One click to flip it back on → instant 50–100 million new users.
-Precedent: PayPal adding BTC in 2020 → +300 % pump in weeks; LTC would explode harder because it’s actually usable on their rails.
10. Dogecoin merges fully with Litecoin (merged-mining → full auxiliary chain)
-Precedent: DOGE pumps in 2021 dragged LTC up 4–6× every single time. A real technical merger would be 10× stronger.
11. Major exchange or custodian loses billions in Bitcoin (think FTX 2.0 but only BTC exposed)
Users rush to self-custody the one big coin that still has sub-$0.01 fees and 2.5-minute confirmations → Litecoin.
-Precedent: FTX collapse 2022 → LTC was one of the only coins people could actually withdraw fast and cheap.
12. SEC or European regulator classifies Bitcoin as a “security” or “commodity with special rules” but explicitly says Litecoin is a commodity/currency
Institutions that were forced to sell BTC rotate the exact same thesis into LTC overnight.
-Precedent: XRP SEC case resolution in 2023 caused instant 3× pump; same mechanics.
13. Bitcoin Core development stalls or splits again (Blocksize Wars 2.0)
Big-blockers and users frustrated with ossification move money and hashrate to the chain that kept Charlie Lee’s original “faster, lighter” vision alive.
-Precedent: 2017 Bitcoin Cash hard fork → LTC price went parabolic as the “peaceful middle ground.”
14. Global remittance giants (Western Union, MoneyGram, Wise) quietly switch backend rails to Litecoin
They already tested LTC in 2017–2019. A single press release announcing “instant global transfers for pennies” using Litecoin would add billions in real volume.
-Precedent: Ripple/XRP partnerships in 2018 caused 10× pumps even when adoption was tiny. Real adoption would be insane for LTC.
Downside protected, upside unprotected — BTC to 500kThere's a ton of intriguing action unfolding with Bitcoin right now. Several cycle low indicators I track have started firing off around the $80K mark—pretty wild if you ask me. Let's break them down step by step.
1. 2-Week RSI Signal
It's a straightforward fact: the two-week RSI is sitting at 42, a level that has consistently marked cycle lows in the past. So, at $80K, we've got our first major cycle low signal.
2. Fear & Greed Index
Historically, after a cycle top, the first wave down has driven the Fear & Greed Index to a reading of 10 in the last two cycles.
The rest of the time? It's signalled cycle lows or major bottoms ahead of massive rallies.
#### What This Means: History Rhyming (Again)
This setup screams repetition—Bitcoin has now topped out after exactly 1,064 days, mirroring the last two cycles. On this first corrective wave, Fear & Greed has already plunged to 10. But here's where it gets really telling: layer in the Sharpe ratio for some nuance.
As the chart shows, the Sharpe ratio has dipped into negative territory—a rare event that *only* occurs during true cycle lows.
Invalidation & Bear Market Confirmation
The chart makes it crystal clear: Bitcoin is primed to echo the last cycle's playbook, with a full rejection at the 0.382 Fibonacci retracement. In the prior two cycles, after the initial drop from the cycle high, any subsequent rally completely fizzled out right there at 0.382.
If Bitcoin fails to rally and close decisively above that level by mid-January 2026, the odds skyrocket for a full-blown bear market. Keep an eye on it—this could be the pivot that defines the next leg.
What do you think then?
500k or 67k by October 2026?
Still fully on the upside boat. Risk is heavily skewed to the top side, not down

$ETH - Under $1400 in 2026You may not believe this I don't either, but this is my Scenario number 1 right now.

Ethereum Outlook: Downtrend Nearing Exhaustion?The crypto market continues to slide, with Ethereum struggling to regain footing. While the short-term trend remains bearish, we may be closer to the end of this decline than the start. Still, wide price swings are likely, and traders should remain cautious.
🔻 Key Breakdown
Ethereum has lost the critical $3,300–$3,400 support, which now flips to resistance. This zone had been a strong base, and its loss introduces technical headwinds that could limit near-term upside.
📉 Next Support to Watch
The $2,600–$2,800 range is the next major support. A test of this zone could offer clues about trend exhaustion or continuation.
🔮 2026 Outlook Still Bullish
Despite the short-term weakness, the macro view hasn’t changed. We expect Ethereum to revisit all-time highs by 2026, with the potential to test the $6,000 area.
📌 Stay focused on key levels and watch for signs of reversal before assuming a bottom is in.

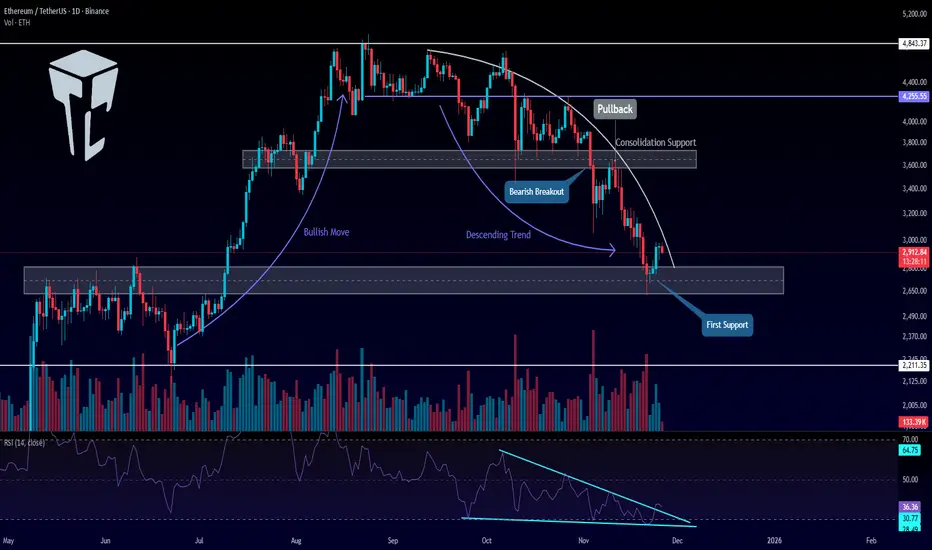
TradeCityPro | Ethereum Eyes Key Levels for Trend Reversal👋 Welcome to TradeCityPro!
Let’s dive into the Ethereum analysis, the queen of the market, ranked 2nd on CoinMarketCap with a $351 billion market cap, right after Bitcoin.
📅 Daily Timeframe
On the daily timeframe, after the upward movement Ethereum made, it reached the 4,843 resistance zone and then entered a consolidation phase.
✅ The bottom of this range was at 3,700, and the middle of the box was at 4,255, which the price reacted to.
🔔 After breaking the lower boundary of the box, the bullish trend Ethereum had came to an end, and a bearish trend with a curved trendline began.
⚖️ After a pullback to the 3,700 zone, a downward move took place, reaching the next support zone at 2,700, and now the price is reacting to the 2,700 zone.
💥 The RSI oscillator formed a descending triangle during this move, which contributed to the increasing bearish momentum in the market.
💡 Now, with the price reaching 2,700, the triangle has broken to the upside, and the bearish momentum has slowed down for now.
🎲 The confirmation of the new bullish momentum will come after breaking the curved trendline and forming a higher high and higher low above the 2,700 level.
📈 The main trigger for Ethereum's bullish trend will be stabilization above 3,700.
⚡️ If the 2,700 level breaks, the next support zone will be at 2,211.
💫 Personally, I’ll try to open a short position on Ethereum if the 2,700 level breaks.
🔼 For a long position, triggers can be found on lower timeframes, but for the main positions, we should wait for the price to form a higher high and higher low.
📝 Final Thoughts
Stay calm, trade wisely, and let's capture the market's best opportunities!
This analysis reflects our opinions and is not financial advice.
Share your thoughts in the comments, and don’t forget to share this analysis with your friends! ❤️
Bullish bounce off?Ethereum (ETH/USD) has bounced off the pivot, which has been identified as an overlap support, and could rise to the pullback resistance.
Pivot: 2,868.29
1st Support: 2,781.04
1st Resistance: 3,049.57
Disclaimer:
The opinions given above constitute general market commentary and do not constitute the opinion or advice of IC Markets or any form of personal or investment advice.
Any opinions, news, research, analyses, prices, other information, or links to third-party sites contained on this website are provided on an "as-is" basis, are intended to be informative only, and are not advice, a recommendation, research, a record of our trading prices, an offer of, or solicitation for, a transaction in any financial instrument and thus should not be treated as such. The information provided does not involve any specific investment objectives, financial situation, or needs of any specific person who may receive it. Please be aware that past performance is not a reliable indicator of future performance and/or results. Past performance or forward-looking scenarios based upon the reasonable beliefs of the third-party provider are not a guarantee of future performance. Actual results may differ materially from those anticipated in forward-looking or past performance statements. IC Markets makes no representation or warranty and assumes no liability as to the accuracy or completeness of the information provided, nor any loss arising from any investment based on a recommendation, forecast, or any information supplied by any third party.

BTC Cup and Handle Still Not CompleteAs you can see the SPX broke out of the cup and handle and completed the measured move. It then corrected back down to the top of the handle and resumed its uptrend. This is what is coming for Bitcoin. Bitcoin has only half way completed the cup and handle. Measured move to around 300k before correcting back down to 70k and then back off to the races. Hold onto your hats. That would be the most epic move of all time a straight shot from here to 300k no pullback then slam back down to 70k and then back up to 500k. Could happen fast dont underestimate Bitcoin.
Just my opinion not financial advice.

Litecoin LTC/USD Buy The Fear Sell The EuphoriaI haven't made a Litecoin chart in a while. We've been sideways and uneventful, figured I would wait till something eventful happens. Well here it is folks , the moment before we actually move up everyone is selling except for a few smart hands. This fractal says it all in my opinion. fractals are usually very similar but not exact. Where we are now in price for Litecoin around 83 is really close to the bottom of this pullback. It washed out and cleaned up all the leverage, a very common occurrence in this market before large moves up. The move will be absolutely explosive and probably no meaningful pullback until we break the all time high. I see a pullback to retest the high before the next massive leg up.
Right now in my opinion is the worst place to sell. I know this "bear market" is not a real bear market because of how many people are saying it is. The whole world says its a bear market right now, every youtube grifter has pivoted to bear market recently with this drop, every news channel is saying it is. Thats why its not, most have sold already and now the price I believe will rebound so fast it'll shock everyone and the ones who sold will be in denial waiting for the "next low". When that low doesn't come and we break the highs they will all pile back in.
Everyone says oh this moving average, or this indicator, or this RSI. Look its all helpful stuff but its also all imaginary lines. Who says that we MUST be in a bear market because we broke a 200 day moving average. Who says because RSI is overbought we must go down. RSI has infinite different adjustments so whos to say that the 14 length is correct? These indicators will begin to fail over time as more and more people look at them. Right now there is more traders and wanna be traders in the world than ever before so if everyone is looking at the same thing all the time then most likely those will start to fail. Oh its happened every time before , I know , I know. Come on at the end of the day Bitcoin is still in its infancy. I dont buy the four year cycle, or seasonality crap, its foolish and betting your portfolio on those factors alone is a recipe for BROKE! I still stand by my previous long term predictions. Obviously its taking much longer than I expected but timing these things is nearly impossible on the long term time frame. While all the youtube grifters flip flop weekly I listen to the Billonaires and people who MAKE the markets. Saylor said three days ago the pullback is almost over and hes buying. Blackrocks Robbie Mitchnick says this is a good buying area and thats just a couple theres dozens of big wigs saying the same thing.
So to wrap this up I believe we are at the point of rocket ship. Look at economic factors, liquidity worldwide is expanding, stimulus is coming, tightening is ending, rates are coming down. Fiat currencies worldwide are about to go into hyperinflation and certain cryptos will reap the benefit of that. Bitcoin and Litecoin being the top gainers in this next phase of hyperinflation in my opinion. This is just my opinion and not financial advice. Thank you

ETHUSD H4 | Bullish ReversalMomentum: Bearish
The price is falling towards the buy entry, which aligns with the 38.2% Fibonacci retracement.
Buy entry: 2,872.04
Pullback support
38.2% Fibonacci retracement
Stop loss: 2,635.89
Pullback support
Take profit: 3,201.19
Overlap resistance
Slightly above the 50% Fibonacci retracement
High Risk Investment Warning
Stratos Markets Limited (tradu.com ), Stratos Europe Ltd (tradu.com ):
CFDs are complex instruments and come with a high risk of losing money rapidly due to leverage. 70% of retail investor accounts lose money when trading CFDs with this provider. You should consider whether you understand how CFDs work and whether you can afford to take the high risk of losing your money.
Stratos Global LLC (tradu.com ): Losses can exceed deposits.
Please be advised that the information presented on TradingView is provided to Tradu (‘Company’, ‘we’) by a third-party provider (‘TFA Global Pte Ltd’). Please be reminded that you are solely responsible for the trading decisions on your account. Any information and/or content is intended entirely for research, educational and informational purposes only and does not constitute investment or consultation advice or investment strategy. The information is not tailored to the investment needs of any specific person and therefore does not involve a consideration of any of the investment objectives, financial situation or needs of any viewer that may receive it. Past performance is not a reliable indicator of future results. Actual results may differ materially from those anticipated in forward-looking or past performance statements. We assume no liability as to the accuracy or completeness of any of the information and/or content provided herein and the Company cannot be held responsible for any omission, mistake nor for any loss or damage including without limitation to any loss of profit which may arise from reliance on any information supplied by TFA Global Pte Ltd.
