ETHUSD H4 | Bearish Reversal Off Overlap ResistanceMomentum: Bearish
The price has rejected off the sell entry, which aligns with the 50% Fib retracement, adding significant strength to this level.
Sell entry: 3,079.09
Strong overlap resistance
50% Fibonacci retracement
Stop loss: 3,293.66
Pullback resistance
Take profit: 2,732.98
Pullback support
High Risk Investment Warning
Stratos Markets Limited (tradu.com ), Stratos Europe Ltd (tradu.com ):
CFDs are complex instruments and come with a high risk of losing money rapidly due to leverage. 70% of retail investor accounts lose money when trading CFDs with this provider. You should consider whether you understand how CFDs work and whether you can afford to take the high risk of losing your money.
Stratos Global LLC (tradu.com ): Losses can exceed deposits.
Please be advised that the information presented on TradingView is provided to Tradu (‘Company’, ‘we’) by a third-party provider (‘TFA Global Pte Ltd’). Please be reminded that you are solely responsible for the trading decisions on your account. Any information and/or content is intended entirely for research, educational and informational purposes only and does not constitute investment or consultation advice or investment strategy. The information is not tailored to the investment needs of any specific person and therefore does not involve a consideration of any of the investment objectives, financial situation or needs of any viewer that may receive it. Past performance is not a reliable indicator of future results. Actual results may differ materially from those anticipated in forward-looking or past performance statements. We assume no liability as to the accuracy or completeness of any of the information and/or content provided herein and the Company cannot be held responsible for any omission, mistake nor for any loss or damage including without limitation to any loss of profit which may arise from reliance on any information supplied by TFA Global Pte Ltd.
ETH

ETH - 5.6RR idea.BINANCE:ETHUSDT.P
It's a logical idea. We get a short reaction from a short four-hour imbalance. Then, we take all the excess liquidity and move upward.

ETH - Conservative plan.6.6 RR idea. The plan is quite logical and clear.
BINANCE:ETHUSDT.P
According to the RSI, it's oversold. We'll remove excess long liquidity and bounce back.

ETHUSDT – 4H Outlook long IdeaETH is still holding above key support after a market structure shift (MSS).
Price rejected from resistance and is now pulling back into a demand zone.
Bias
As long as support holds, we can see a bounce and continuation higher.
A clean reaction from demand could offer a high RR long setup.
Invalidation
Loss of the demand zone = bullish idea invalid.
Already long from CMP, looking to add at the EP on this setup.
Patience here — let price come to you.
What are you watching next: bounce from support or deeper pullback? 👀📊

ETH/USD is on the Edge...🔹 MARKET BRIEFING – ETH/USD (1H)
Market State:
– Ethereum is currently trading within a descending channel, with price testing the lower boundary of the demand zone. There’s a clear structure setting up for a potential downside move toward the lower targets.
Key Levels:
– Supply Zone: ~3,170 – 3,180
– Demand Zone (Support): ~3,060 – 3,070
– Target 1 (TP1): ~3,014
– Target 2 (TP2): ~2,913
Next Move:
– A rejection at the supply zone may trigger a strong downside move toward the demand zone, with targets set for 3,014 and 2,913. If the demand zone holds, ETH/USD could rebound to test the upper boundary of the descending channel.

ETHUSDT – 4H Chart ETHUSDT – 4H Chart
Structure: Falling channel intact
Trend: Range-bound with mild bearish pressure
Ichimoku: Price inside/below cloud → trend still weak
MA: Price is struggling around the moving average
Support: 2,880 – 2,900
Major Support: 2,780 – 2,800
Resistance: 3,050 – 3,120 zone
A clear break & hold above 3,120 can open upside toward 3,300+.
Below 2,900, downside retest of 2,800 remains possible.
⚠️ Wait for confirmation — ETH is still consolidating. Manage risk.

this ETH Structure Usually Breaks Higher — Most Traders Miss ItETH/USD – H1 |
Technical Structure
ETH is holding firmly above the key support zone and both EMA 34 & EMA 89, confirming trend control by buyers.
Recent pullbacks are shallow and corrective, forming higher lows → classic bullish continuation behavior.
Price is compressing below the next resistance around 3,100, indicating energy build-up rather than distribution.
As long as support holds, the structure favors step-by-step expansion, not reversal.
EMA 34 & EMA 89 remain below price, acting as dynamic support.
Macro Context
Risk appetite remains supported as markets price in softer USD conditions and future Fed easing.
ETH benefits from capital rotation into majors, especially when BTC stabilizes.
No major macro headwinds at the moment → momentum stays with trend-following buyers.
Outlook
Primary scenario: Hold above support → consolidation → push toward 3,100+.
Invalidation: Only a clean breakdown below the support zone would delay the bullish continuation.
Bottom Line
ETH is not overextended it’s absorbing liquidity above support.
This structure typically resolves higher, not sideways or lower.

ETH Is Compressing — Breakout or Another Trap?ETH/USD – H1 Analysis
Market Structure:
ETH is moving sideways after a strong recovery from the lower support zone. Price is now compressing just below a key resistance band, signaling indecision and liquidity build-up.
Key Levels:
Resistance: The upper red zone is the main barrier. Multiple rejections here confirm heavy supply.
Support: The green support zone below remains intact and continues to attract buyers on pullbacks.
Price Action Insight:
Sideways movement under resistance = accumulation, not weakness.
Higher lows are forming, showing buyers are gradually gaining control.
This structure often precedes a sharp expansion move.
Primary Scenario:
A clean break and hold above resistance opens the path toward the higher resistance zone above.
Alternative Scenario:
Failure to break may trigger a pullback toward support to reset momentum before the next attempt.
Conclusion:
ETH is in a decision zone. Stay patient wait for confirmation. The next move is likely to be fast and directional.

ETH Is Holding the Line —Consolidation Before the Expansion MoveETHUSD (H1) — MARKET ANALYSIS
1. Market Structure
Ethereum has successfully reversed the previous downtrend after breaking the descending trendline and reclaiming structure above the key support zone (~2,760–2,800). Since that breakout, price has transitioned into a range-to-accumulation structure, forming higher lows and holding above the mid-range equilibrium.
This is no longer a corrective bounce it is trend repair in progress.
2. Price Action & Behavior
Strong impulsive leg from the support zone confirms aggressive demand entry.
Current price is consolidating around 3,000–3,040, showing acceptance rather than rejection.
Pullbacks are shallow and controlled → no panic selling, supply is being absorbed.
This type of sideways price action after an impulse typically precedes continuation, not reversal.
3. Key Zones
Major Support Zone: 2,760 – 2,800
→ Structural base; as long as price holds above, bullish bias remains valid.
Mid-Range Acceptance: 2,980 – 3,020
→ Holding above this zone keeps momentum intact.
Resistance Zone: 3,150 – 3,170
→ Liquidity target and decision zone for the next expansion.
Invalidation: Clean H1 close back below 2,900.
4. Primary Scenario (Preferred)
Short-term pullback / consolidation above 3,000
Higher low formation
Expansion toward 3,100 → 3,160 resistance zone
If resistance is absorbed, continuation toward higher highs follows.
The projected path on the chart reflects this logic: pullback → continuation → breakout attempt.
5. Alternative Scenario (Lower Probability)
Failure to hold 3,000
Deeper pullback toward 2,920–2,950
Still considered re-accumulation, unless support is decisively broken.
Conclusion
ETH is not topping it is building energy above reclaimed structure. The market is respecting support, absorbing supply, and compressing volatility beneath resistance. This behavior strongly favors an upside continuation, not a reversal.
Patience here is key the move is being prepared, not rushed.

ETHEREUM/BITCOIN riseETH/BTC has broken above the trendline, closed the weekly candle above it, and backtested it. Now it's time for Ethereum to outperform. This is interesting for altcoins.

Ethereum (ETHUSDT): Short-Term Recovery Attempt Hi guys!
ETH is still trading inside a well-defined descending channel, keeping the broader short-term structure bearish. The previous upside breakout attempt near the upper boundary resulted in a clear fakeout, confirming strong supply pressure at higher levels. Following that rejection, price experienced a sharp sell-off and formed a notable double bottom structure around the 2,800–2,850 zone, indicating demand absorption and short-term stabilization.
Currently, price is consolidating below a key supply zone around 3,000–3,020, which acts as a pivotal decision area. This zone aligns with prior intraday resistance and must be reclaimed to confirm further upside. A sustained breakout and acceptance above this area would open the path toward the upper channel resistance near 3,125–3,130, which is the next major technical target.
On the downside, failure to hold above the current support zone would invalidate the recovery structure and could lead to another retest of the recent lows.

ETHEREUM Buy/Long Signl (3H)After clearing the higher ranges on the chart, Ethereum is now pulling back to the move origins that eliminated the supply zones above.
Near these two origins, we can look for buy/long positions.
I have marked two entry points on the chart. Enter positions using DCA at each level.
Targets are marked on the chart—take partial profits at the first target and then move the stop loss to breakeven.
Do not enter the position without capital management and stop setting
Comment if you have any questions
thank you

ETHUSD - Symmetrical TriangleA symmetrical triangle pattern on ETHUSD, considered a bullish pattern
Support should be found above the upper line then breakout
Hopefully heading into an alt season
Daily chart

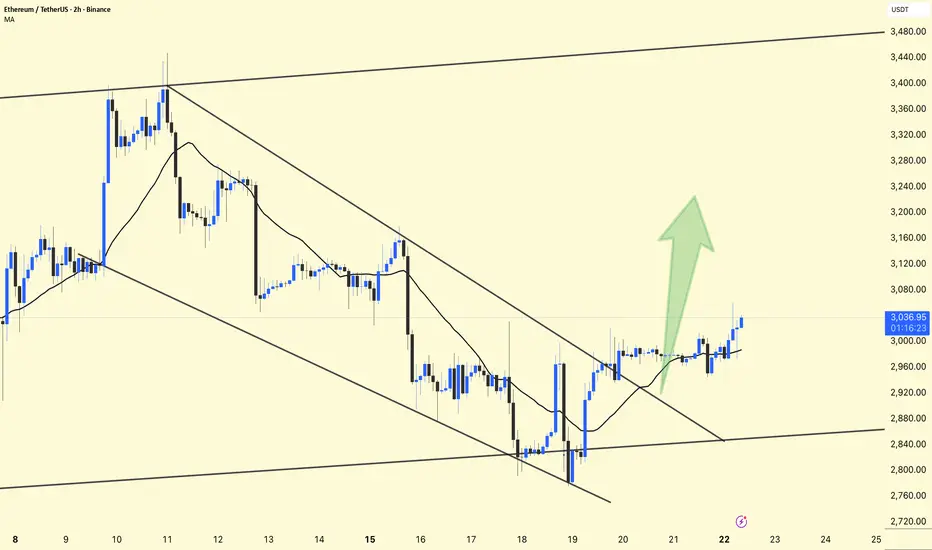
ETHUSDT – Chart Update ETHUSDT – Chart Update
ETH was moving inside a descending channel, now showing signs of reversal.
Price has broken the channel trendline and is holding above the short-term MA.
Momentum is slowly shifting bullish.
Support: 2,980 – 2,950
Major Support: 2,880
Resistance / Targets: 3,120 → 3,200 → 3,280
Bullish above 2,980 with confirmation.
⚠️ A pullback retest is healthy; avoid chasing.
Not financial advice. Trade with risk management.
Ethereum Is Resetting — Not Breaking DownEthereum on the daily timeframe is still trading within a broader corrective structure, with price rotating between a clearly defined support zone around the mid-2,700s and a heavy resistance area overhead. The recent pullback into support shows slowing downside momentum, suggesting that selling pressure is being absorbed rather than aggressively expanded. This zone has historically attracted demand, making the current move more consistent with a technical reset than a continuation of the broader downtrend.
From a structural perspective, ETH is attempting to stabilize after a prolonged decline, and the reaction from support will be critical. As long as this demand zone holds, the downside remains corrective in nature, opening the door for a recovery move back toward the upper resistance zone. A sustained push higher would signal that buyers are regaining control and could initiate a larger mean-reversion rally within the higher-timeframe range.
From a macro standpoint, Ethereum’s behavior aligns with the broader crypto market environment, where risk assets remain sensitive to liquidity conditions and expectations around U.S. monetary policy. With no decisive tightening shock and ETF-related narratives still providing long-term support to the crypto space, deep downside continuation lacks strong macro confirmation. However, the absence of aggressive liquidity expansion also explains why upside remains corrective rather than impulsive at this stage.
In this context, ETH is in a decision zone. Holding support keeps the recovery scenario valid and favors a move back toward resistance, while a clean breakdown would reopen downside risk. Until price leaves this range with conviction, patience remains the edge the trade appears only when structure and macro align with clear intent.

GBP/USD Is Range-Bound — Macro Pressure Favors RotationMarket Structure (H1)
GBP/USD is currently trading inside a well-defined moving range, capped by a firm resistance zone near 1.3450 and supported by demand around 1.3315. Price action within this box is overlapping and corrective, confirming a non-trending environment. The sharp rejection from resistance followed by weak follow-through on rebounds shows that buyers lack conviction, while sellers have not yet forced a decisive breakdown.
The latest impulsive move into the range was quickly absorbed, and price is now rotating back toward the mid-to-lower portion of the structure. As long as the pair remains below resistance, upside attempts are mean-reverting, not trend-defining.
Liquidity & Price Behavior
This range is acting as a liquidity container. Repeated tests of both extremes suggest ongoing stop-hunting rather than accumulation for a breakout. The projected path toward the lower boundary aligns with how price typically behaves in balanced conditions — rotating until liquidity is fully cleared.
Macro & Policy Context
From a macro perspective, conditions currently weigh on GBP:
The U.S. dollar remains supported by relatively higher yields and a still-restrictive Federal Reserve stance.
Markets continue to price rate cuts cautiously, keeping USD demand elevated during periods of uncertainty.
In contrast, the UK outlook remains softer, with slower growth expectations limiting GBP upside.
This macro divergence explains why GBP/USD struggles to accept above resistance and why rallies are being sold into rather than extended.
Conclusion
GBP/USD is not setting up for a breakout it is rotating within a macro-constrained range.
Failure at resistance favors continuation toward the support zone.
Only a clean acceptance above 1.3450 would shift the structure bullish.
Until then, patience remains key. The edge lies in reacting to range extremes, not anticipating trend continuation.

ETH/USDT 4H Chart Review🔎 Market Structure
Medium-term trend: downward
The price is moving within a descending channel (orange lines).
Each upward breakout has been corrected lower so far.
Current: consolidation after a strong rebound from the low.
📉 Key Levels
🔴 Support
2925 USDT – very important local support (currently being tested).
2756 USDT – strong support from the previous reaction.
2600 USDT – last line of defense (structural low).
🟢 Resistance
3057 USDT – key resistance + near the moving average (SMA).
3225 USDT – strong supply reaction level.
3346 USDT – upper range of the structure, very strong resistance.
📐 Moving Average (green)
Price below the SMA → market still under supply control.
Until the 4-hour period closes clearly above ~3057, any upward move is a correction, not a trend change.
📊 Stochastic RSI
There was an overheating (80+), now a downward turn.
This is a cooling signal, possible:
a sideways correction,
or another decline to support.
🧠 Scenarios
🐻 Baseline scenario (more likely)
Rejection from the downward channel.
Retest of 2925 → if it breaks:
2756
and in an extreme case, 2600.
🐂 Alternative scenario (bullish)
Breakout of 3057 + close of the 4-hour candle above.
Targets:
3225
3346
Condition: Breakout from a descending channel (not just a wick).

Eth Key LevelsThese are Eth Key Levels
2798.41
2809.00
2819.61
2830.24
2840.89
2851.56
2862.25
2872.96
2883.69
2894.44
2905.21
2916.00
2926.81
2937.64
2948.49
2959.36
2970.25
2981.16
2992.09
3003.04
3014.01
3025.00
3036.01
3047.04
3058.09

TOTAL Crypto Market Cap - Double Head & Shoulders?Market: CRYPTOCAP:TOTAL Crypto Market Cap
Assets referenced: COINBASE:BTCUSD , COINBASE:ETHUSD , COINBASE:SOLUSD , CRYPTO:BNBUSD , COINBASE:XRPUSD , COINBASE:ADAUSD , COINBASE:AVAXUSD , COINBASE:DOTUSD , COINBASE:LINKUSD , CRYPTO:MATICUSD
The TOTAL crypto market remains in a long-term bullish structure, supported by sustained adoption across major assets like Bitcoin, Ethereum, and Solana, alongside continued development in ecosystems such as BNB Chain, Avalanche, Polygon, and Polkadot.
That said, markets do not move in straight lines.
Historical cycle behavior
In previous crypto cycles (2017 and 2020–2021), periods of strong expansion across BTC, ETH, and large-cap altcoins were followed by:
Broad market pullbacks of ~20–40%
Corrections that held above prior cycle highs
Multi-month consolidations before continuation
These pullbacks ultimately offered the best long-term entries for Bitcoin, Ethereum, and quality altcoins like LINK, ADA, AVAX, and MATIC.
Current market structure
TOTAL market cap remains above key long-term support
Momentum has cooled without structural breakdown
Price action resembles a macro decision zone, not a trend reversal
A pullback toward prior resistance-turned-support would align with:
Historical crypto market cycles
Rising long-term trendlines
Past accumulation zones for BTC and ETH
This would represent a higher low on a multi-year timeframe, consistent with healthy bull markets.
Institutional context
This cycle differs from previous ones due to institutional participation:
Spot Bitcoin ETF flows
Growing Ethereum ETF exposure
Increased corporate and custodial adoption of digital assets
Sustained institutional demand could:
Limit downside volatility
Turn deeper corrections into sideways consolidation
Support continued strength across BTC, ETH, SOL, and large-cap altcoins
Conclusion
The long-term thesis for crypto remains intact.
Bitcoin and Ethereum continue to act as macro anchors, while ecosystems like Solana, Avalanche, Polygon, and Chainlink reflect ongoing innovation beneath the surface.
A pullback would not be bearish - it would be structurally healthy and potentially offer high-quality long-term entries.
Bullish long-term. Patient near-term.
Watching structure across the TOTAL market, not short-term noise.

ETH Holds Support - Bulls Still in Play!?📈ETH has been trading within a rising broadening wedge pattern.
⚔️This week, price rejected the lower boundary of the structure.
🏹As long as the wedge remains intact, and ETH holds above the last major low at $2,750, a bullish continuation toward the upper boundary of the wedge remains the favored scenario.
⚠️ Disclaimer: This is not financial advice. Always do your own research and manage risk properly.
📚 Stick to your trading plan regarding entries, risk, and management.
Good luck! 🍀
All Strategies Are Good; If Managed Properly!
~Richard Nasr

SOLUSD at long-term linear-regression supportSOLUSD has had a rough year in 2025 with major drawdowns and new highs as well. Neither bulls nor bears have had a painless path.
Will 2026 be different? A lot depends on the Fed, liquidity, inflation prints, and more.
But SOL found a bottom today at the -2 standard deviation line on a log-scale linear regression going back to the all-time low in December 2022. This is a convenient tool developed by @Forza that is an open-source script that "slightly modifies TradingView's built-in linear regression script" which allows it to be plotted on log-scale charts. I've thought recently that it may be worth taking a shot at SOL long, with risk limited to the -2 standard deviation line on a log scale chart.
The AVWAP from the inception of the chart (shown weekly above and dates back to June 2021 for this particular exchange's chart), lies around $96-$97.
No certainties exist in trading or investing, and a flush in 1Q would bring further pain to bullish SOL traders and long-term SOL investors. But if SOL continues its bullish path since late 2022, it could reach new all-time highs in 2026-2027. Maybe it's an investment worth considering. As always, do your own research!

ETHEREUM BITCOIN (BEST-CASE)CRYPTOCAP:ETH is the main platform for thousands of apps and blockchains, all powered by the Ethereum protocol.
This vibrant ecosystem fuels innovation and a wide range of decentralized apps and services.
Free and global Ethereum accounts
Pseudo-private, no personal information needed
Without restrictions anyone can participate
No company owns Ethereum or decides its future

BTC – Weak Rebound Below EMAs, Bias Still Toward CorrectionHello everyone, Domic here.
Looking at BTC on the H4 timeframe right now, the overall feeling is not panic — but there is certainly nothing reassuring either. Price is trading around 85,700 USD, sitting firmly below both the EMA34 and EMA89, and that alone already says a lot about the current market condition.
Since mid-month, a lower high – lower low structure has become fairly clear. The rebound we are seeing at the moment is essentially just a technical pullback after the prior sharp sell-off, as price attempts to climb back up and retest resistance. However, BTC has still failed to reclaim the EMA34, which shows that buying pressure is not strong enough to regain short-term control. At this stage, EMA34 acts as an overhead pressure ceiling, while EMA89 remains the key boundary defining the H4 trend. As long as price stays below both of these moving averages, the market should still be viewed from a defensive perspective.
On the macro and news side, BTC is not being driven by any crypto-specific shock, but rather by broader macro conditions and the risk-on / risk-off environment. The Fed continues to signal higher rates for longer, making it difficult for risk assets to attract fresh inflows. US Treasury yields remain elevated, pushing short-term capital toward the USD and bonds instead of crypto. US equities are undergoing a mild correction, and BTC, at this stage, is still moving quite in sync with the broader risk asset complex. In addition, inflows into spot Bitcoin ETFs have cooled significantly compared to the earlier surge, further weakening the price support.
From my perspective, as long as BTC remains below the EMA34, any upward move should still be treated as a rebound into resistance. And while price stays below the EMA89, the H4 trend remains in a corrective state.
