Coinranger|ETHUSDT. Uncertainty after the fall🔥News
🔹The International Economic Forum continues. Trump's speech is at 16:30 (UTC+3)
🔥ETH
🔹Ethereum has made two full sets down in a couple of days. According to the forecast. What's next:
1️⃣ 3115 above. A dynamic level, it will continue to slide lower. Preliminary.
2️⃣ 2950 and 2910 are possible moves down below. But we can immediately start moving higher without reaching them.
A pullback is the priority; a movement lower is possible, but not necessary.
Ether

Coinranger|ETHUSDT. Pullback to 3250 and back down again🔥News
🔹The International Economic Forum in Davos begins today and will continue all week. America is closed for M. Luther King Day. No other significant news.
🔥ETH
🔹Also fell overnight following Bitcoin. Due to a slight rise before the fall, the levels at the bottom shifted slightly, but a full set of downward waves was ended. New levels:
1️⃣ Above there are pullback levels on the H1 timeframe: 3286 and 3250
2️⃣ The previous wave set expansion targets are still actual: 3120 and 3060
Priority is given to a pullback, likely to 3250. Then down to 3120.
-------------------
Share your opinion in the comments.

Ethereum - can it be?Setup
Bearish - potential bullish reversal
Inverse H&S bottom pattern
Rebounded off 50% retracement of 2025 rally
Above 20/50 SMA
Below 200 SMA
RSI moved into bullish range
Commentary
NOTE: The setup is similar to Bitcoin and both will likely move in the same direction so be careful not to double up on a correlated trade.
The Bullish case for Ethereum is a bit more convincing with an inverse H&S pattern - but it could also turn into a triangle pattern breakdown.
Strategy
Buy touch of broken neckline
Wait and buy on break above last peak at 3,300.
But - as always - that’s just how the team and I are seeing things, what do you think?
Share your ideas OR send us a request!
Cheers,
Jasper
Disclaimer:
The communication does not constitute investment or trading advice, nor does it include any recommendations. Additionally, it does not serve as an offer or solicitation to engage in transactions involving financial instruments. WeTrade does not take responsibility for any actions taken based on the information provided, nor for any outcomes that may occur as a result of the actions taken.

Coinranger|ETHUSDT. Will it grows yet?🔥News
🔹No important news today. Potentially, Trump could start doing something in Iran. And, as we remember, in such cases, crypto can go down rapidly.
🔥ETH
🔹Stays within yesterday's forecast:
1️⃣ Levels above: 3373 and 3460.
2️⃣ Levels below with the minor changes: 3264, 3230, and 3160.
We'll be following Bitcoin. For now, the priority is to go lower. The minimum target at the bottom is 3264. An upward move is fragile, but not impossible.

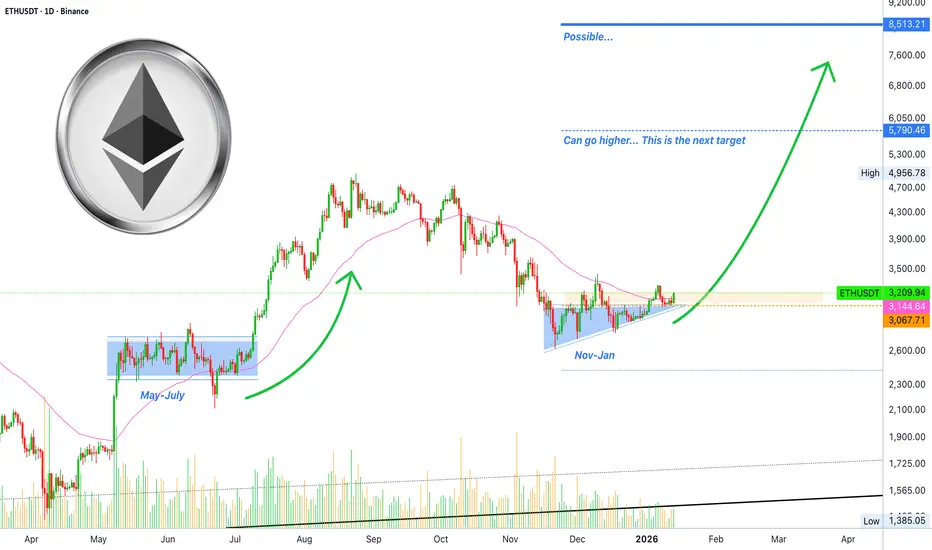
Ethereum · Can Ether produce a new all-time high in early 2026?Let me ask you a question, do you think Ethereum will peak below the last high around $5,000, or will it move higher? Tough question right?
Can we ask the chart and market?
Let's do some speculative technical analysis.
Bitcoin, Ethereum and a group of the big projects tend to move together, it tends to happen. As the market evolves, we are seeing how easily things change.
Bitcoin went on to produce a very strong all-time high compared to 2021, twice as high. Just to recap, back in 2021 Bitcoin peaked around $69,000. Bitcoin went on to produce a new all-time high in 2024 and then again in 2025 with a maximum price of $126,000. Ethereum didn't follow.
Ethereum peaked 2021 around $4,800 and recently, August 2025, Ethereum reached $4,957, a technical double-top. This is our context. Bitcoin did awesome. Ethereum also did good but not great.
Ethereum is now moving daily above EMA55. This signal, once confirmed, opens up bullish momentum for 1-3 months—mid-term. Seeing the lack of a new all-time high in 2024, and how we got a shy all-time high in 2025, it is possible to see Ethereum break beyond this barrier.
Ethereum challenged the $4,800 - $5,000 resistance zone twice already. Right now we have a very strong higher low compared to the start of the current move in April 2025. The drop from August to November was also a mild one when comparing to a full blown bear market as in 2022. So there is a strong possibility that the last resistance will not hold.
If we think about Bitcoin and say, "But, Bitcoin is likely to produce a lower high. How can Ethereum produce a higher high while Bitcoin produces a lower high?"
It is possible just as it happened in reverse. Bitcoin moved to hit a new all-time high while Ethereum was trading within the 2021 ATH range. This dynamic can alternate. Say, while Bitcoin is weak, the market flocks to Ethereum and this pushes prices higher up.
Bitcoin's market cap is huge. Bitcoin is way too loaded with institutions, banks and such buying billions all at once. While Ethereum right now is small compared to Bitcoin. A strong injection of capital can make Ether grow really strong. Specially if the world knows Bitcoin is going down. Or, if some of the huge whale start selling Bitcoin and buy some Ether, this alone can support a bullish run.
In truth, we cannot act based on assumptions. This chart allows for a new all-time high in the coming months. How this will be possible please don't ask. I looked at the MACD and RSI on the monthly timeframe and they are not the same as Bitcoin, both show room avaialble for plenty of growth.
A new all-time high is possible. The main targets are $5,800 and $8,500. Monero is already trading at a new all-time high and Zcash did it long ago. It is a big market now. The altcoins market will have its bull run.
Namaste.
LOOK OUT FOR ETHERUM HIGH PROBABILITY LONG SETUP SOON!!!🚨ETHER HIGH PROBABILITY BUY SETUP 🚨
* Here We Can See Clearly The Next Potential Moves For ETHUSD Coming Hours/Days.
* Keep Your Eyes Close On Your Trading Positions.
* Happy PIP Hunting Traders.
FXKILLA.

CATCH ON ETHERUM HIGH PROBABILITY LONG SETUP SOON!!!🚨ETHER HIGH PROBABILITY BUY SETUP 🚨
* Here We Can See Clearly The Next Potential Moves For ETCUSD Coming Hours/Days.
* Keep Your Eyes Close On Your Trading Positions.
* Happy PIP Hunting Traders.
FXKILLA.

Ethereum Price Prediction: Can New Holders Fill the LTH Gap?Ethereum is trading at $2,805 at the time of writing, reflecting a 6% daily decline. The asset is sitting just below the $2,814 resistance level after its latest failed attempt to break through $3,000.
Based on current sentiment and market structure, ETH could stabilize and attempt a rebound, but a strong recovery will require consistent investor support. In the near term, Ethereum will likely fluctuate between $2,814 and $3,000 as it searches for direction.
If bullish momentum strengthens and fresh demand remains steady, Ethereum could finally break above the $3,000 barrier. A successful breach would pave the way for a move toward $3,131 and potentially $3,287, invalidating the short-term bearish thesis.

ETHEREUM HIGH PROBABILITY LONG SETUP SOON!!!🚨 ETHER HIGH PROBABILITY BUY SETUP 🚨
* Here We Can See Clearly The Next Potential Moves For ETHUSD Coming Hours/Days.
* Keep Your Eyes Close On Your Trading Positions.
* Happy PIP Hunting Traders.
FXKILLA.

3 Altcoins To Watch In The First Week Of December 2025Ethereum is a key altcoin to monitor this week as it approaches the Fusaka upgrade, scheduled to go live on December 3. This marks its second major upgrade of the year following Pectra and aims to strengthen the network’s long-term scalability.
Fusaka is designed to help Ethereum support high transaction throughput from layer-2 chains by implementing 12 Ethereum Improvement Proposals. The upgrade could lift ETH from its $2,814 support level toward $3,000. Reclaiming that level is essential for a push toward $3,131 and a broader recovery.
If bearish momentum continues and Ethereum reacts negatively to the ongoing Death Cross indicated by its EMAs, ETH may lose support. A fall below $2,814 could send the price toward $2,681, invalidating the bullish thesis and signaling deeper downside risk.
Ethereum Faces Death Cross After 9 Months After $4 Billion SellEthereum is currently priced at $2,921, sitting just under the crucial $3,000 resistance level. Losing this psychological threshold triggered the wave of $4 billion in selling and reinforced bearish sentiment.
In the near term, ETH will likely consolidate under $3,000 and attempt to hold above support at $2,814 or $2,681. If market conditions worsen or investors continue to sell, Ethereum could break below $2,681 and slide toward $2,606 or lower.
If broader conditions stabilize, ETH could regain bullish momentum. A decisive reclaim of $3,000 would open the path toward $3,131 and potentially $3,287. This would helping Ethereum invalidate the bearish thesis and rebuild confidence among holders.

Ethereum — Swing Low Locked In - 60% ahead!
ETH has established its swing low, and now it’s all about watching for the next impulse.
Against BTC, the chart is clean. ETH is actively reclaiming the pivotal zone, and as long as it holds above 0.03, this setup screams continuation.
Nothing overly complex here — structure is intact, momentum is stabilizing, and the path of least resistance is up.

EthereumETHUSD
- Bullish Channel as an corrective pattern in Short Time Frame
- Break of Structure
- RSI - Divergence
- Order Block
- S / R Level

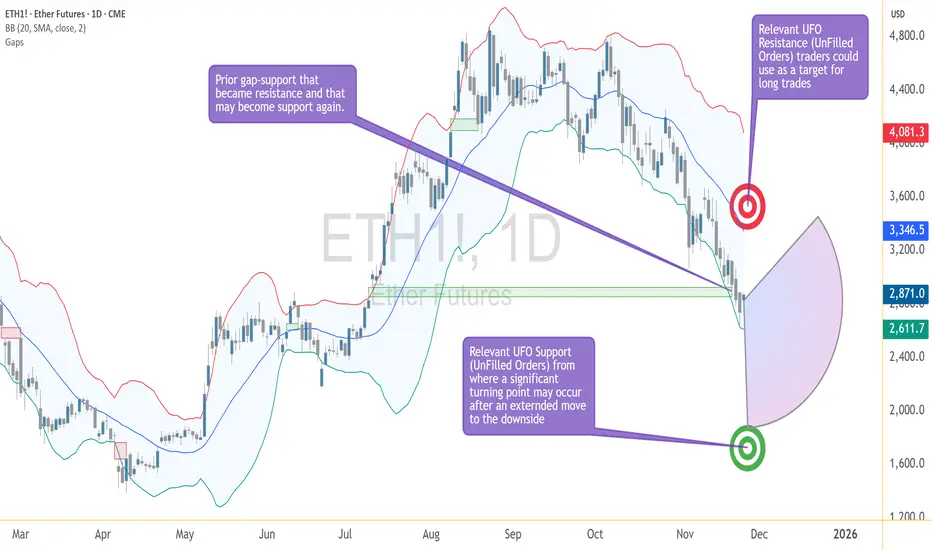
Crypto Walking the Edge: Will the Band Snap or Stretch Lower?Ether Futures (ETH) continue to tell a story of controlled pressure — one that traders have seen before across many markets, but rarely with this level of composure. The selling has been persistent, yet measured, and despite the depth of the decline, Ether has remained remarkably disciplined within its volatility structure. In short, price is walking the lower Bollinger Band — and doing it with intent.
The Market’s Controlled Descent
When an asset walks the lower Bollinger Band, it signals a market under steady directional momentum. The band represents volatility boundaries built around a moving average; hugging its lower edge reflects consistent downside force without capitulation. In Ether’s case, the message is clear — bears are in charge, but not panicking.
This pattern of orderly decline can be deceptive. It often convinces traders that “it can’t go lower” simply because volatility seems contained. Yet, in technical behavior, containment isn’t comfort — it’s momentum management. Until the market detaches from the band and closes above the midline, downside potential remains valid.
The Downside Magnet — UFO Support at 1883.0
Beneath the current price structure lies a level of particular interest: 1883.0. This is not just another number on the chart; it marks a UFO (UnFilled Orders) zone — an area where unexecuted buy orders from prior trading sessions may still be sitting.
Such levels often act as demand magnets. Price gravitates toward them as liquidity seeks to rebalance. If ETH continues its gradual descent, 1883.0 could act as a “final test” of demand strength. Traders currently short may view this area as a logical place to take profits or reduce exposure, while contrarian participants might monitor it for early signs of stabilization.
Walking the Edge — Bollinger Band Dynamics
The Bollinger Band is more than a volatility envelope; it’s a behavioral tool. Price hugging the lower band isn’t a reversal signal on its own. It shows persistent imbalance — sellers are comfortable pressing until they meet true counterflow demand.
The key observation isn’t where Ether trades, but how it interacts with the band:
If the band widens while Ether stays glued to its edge, volatility expansion favors continuation.
If the band narrows and Ether starts oscillating away from it, compression signals the potential for reversal.
At present, Ether remains on the outer lane — still walking the edge, with no confirmed volatility squeeze yet in play.
The Reversal Trigger — The Gap Between 2853.5–2769.0
Ether’s chart carries memory — and that memory is marked by the closure of a previously open gap between 2853.5 and 2769.0. Gaps represent unbalanced zones where the market skipped transactions, often leaving behind psychological resistance.
As long as ETH remains below 2769.0, bearish pressure dominates. A decisive close through the 2853.5 boundary would, however, suggest sellers have lost control. That event could flip the zone from resistance to support — the technical definition of a reversal confirmation.
Until that happens, Ether continues to operate in a bearish environment within its Bollinger framework, respecting lower boundaries and testing demand without capitulation.
The Upside Magnet — UFO Resistance at 3376.5
If the market does achieve a confirmed reversal through the gap zone, the next structural target stands near 3376.5. This region contains a UFO resistance cluster, where unfilled sell orders may wait to re-engage.
This becomes the “upside magnet” in the event of a bullish shift. Not as a forecast, but as a conditional marker — if price proves it can break through 2853.5, the 3376.5 zone becomes the next logical test for momentum sustainability.
Case Study: Risk Structure and Trade Framing
The beauty of futures markets lies in flexibility. Traders can define clear structural zones, build conditional scenarios, and design reward-to-risk ratios before any entry occurs. Ether’s chart currently offers two educational case studies:
Scenario 1 — Continuation Setup
If ETH continues trading below 2769.0, the bearish structure remains intact. Traders could study how price behaves as it approaches 1883.0 to understand profit-taking dynamics or potential trend exhaustion.
Scenario 2 — Reversal Setup
If ETH breaks and closes above 2853.5, the tone changes. It implies the market has absorbed overhead supply, opening the path toward 3376.5. In this case, risk would typically be defined below the reclaimed gap zone, maintaining a controlled risk ratio.
Whichever scenario unfolds, the discipline lies not in prediction but in preparation — in defining “if this, then that” logic.
Contract Specifications
To understand how traders express these views, it helps to revisit how Ether Futures work on CME.
Ether Futures (ETH)
Contract size: 50 Ether with a minimum tick: 0.25 per Ether = $25 per contract
Trading hours: Nearly 24 hours a day, Sunday to Friday, on CME Globex
Margin requirement: approximately $44,000 per contract (subject to changes)
For traders seeking smaller capital exposure, CME also lists Micro Ether Futures (MET) — 1/500th the size of the standard contract. This smaller format offers precision for testing setups, scaling positions, or managing margin during high volatility periods. Importantly, both ETH and MET track the same underlying price behavior, allowing consistent technical interpretation across sizes.
Managing Risk — Beyond Price Targets
Regardless of contract size, effective futures trading is a balance between conviction and constraint. Every trade requires three coordinates before execution:
Entry — based on objective price structure or confirmation.
Exit — determined by invalidation, not emotion.
Size — calibrated to volatility and margin.
A well-structured plan incorporates all three. For instance, a trader eyeing ETH’s move toward 1883.0 should define exit conditions before entry — not after volatility spikes. The same logic applies if Ether were to reclaim 2853.5 and aim higher; stop placement must be systematic, not spontaneous.
Ether Futures in Market Context
Ether’s futures market has become one of the clearest barometers of institutional sentiment in crypto. It reflects not retail enthusiasm but structured positioning, hedging, and liquidity management. The current price behavior — a slow, calculated descent — signals strategic repositioning rather than panic liquidation.
This distinction matters. Markets driven by liquidation collapse violently and rebound sharply. Markets driven by reallocation, like the current Ether environment, tend to evolve gradually — a series of tests, pauses, and measured reactions. Recognizing this tempo helps traders align their strategies with the rhythm of institutional order flow.
Summary — The Market Still Walking the Edge
Ether’s structure can be summarized in three key technical zones:
1883.0: Demand magnet and potential exhaustion level.
2853.5–2769.0: The gap resistance band — critical reversal gate.
3376.5: Major resistance cluster and next test if reversal unfolds.
As long as Ether remains below the gap zone, momentum remains under bearish control. If it trades through and holds above, a structural shift may begin. Until then, the market keeps “walking the edge” — respecting volatility, testing support, and waiting for conviction.
When charting futures, the data provided could be delayed. Traders working with the ticker symbols discussed in this idea may prefer to use CME Group real-time data plan on TradingView: www.tradingview.com - This consideration is particularly important for shorter-term traders, whereas it may be less critical for those focused on longer-term trading strategies.
General Disclaimer:
The trade ideas presented herein are solely for illustrative purposes forming a part of a case study intended to demonstrate key principles in risk management within the context of the specific market scenarios discussed. These ideas are not to be interpreted as investment recommendations or financial advice. They do not endorse or promote any specific trading strategies, financial products, or services. The information provided is based on data believed to be reliable; however, its accuracy or completeness cannot be guaranteed. Trading in financial markets involves risks, including the potential loss of principal. Each individual should conduct their own research and consult with professional financial advisors before making any investment decisions. The author or publisher of this content bears no responsibility for any actions taken based on the information provided or for any resultant financial or other losses.
This Is How Ethereum Price Can Avoid A Crash Below $3,000Ethereum trades at $3,094, holding above the critical $3,000 support level after its sharp decline. This marks the first time in two months the asset has fallen this low. Maintaining support will be essential in preventing deeper losses and setting the stage for a potential recovery.
ETH is currently positioned below the $3,131 resistance level and is waiting for a catalyst to move higher. The supportive on-chain signals suggest that a push toward $3,287 is likely. If momentum strengthens, Ethereum could extend the rise and target $3,489 in the coming sessions.
If bearish pressure increases, Ethereum could break below $3,000 and invalidate the current bullish outlook. A fall through support may expose ETH to a decline toward $2,814 as selling intensifies. This scenario would reflect broader weakness and delay any major recovery attempt.
Ethereum's Updated Map: Giant Flat Correction Corrections can be complex and massive in size
On Ethereum, we have been in a major corrective structure since the strong move up of 2018-2021 completed
The structure shows two large red legs down with a green zigzag joint connecting them
The first large red leg down defines the boundaries of this Giant Flat Correction
ranging between $4,868 and $882
The current move down may mirror the structure of that first leg
potentially bouncing within the $2,500 to $3,500 zone before heading lower
This decline could revisit the $882 low or extend into a full retrace toward $82
After this completes, the second large blue leg up could begin

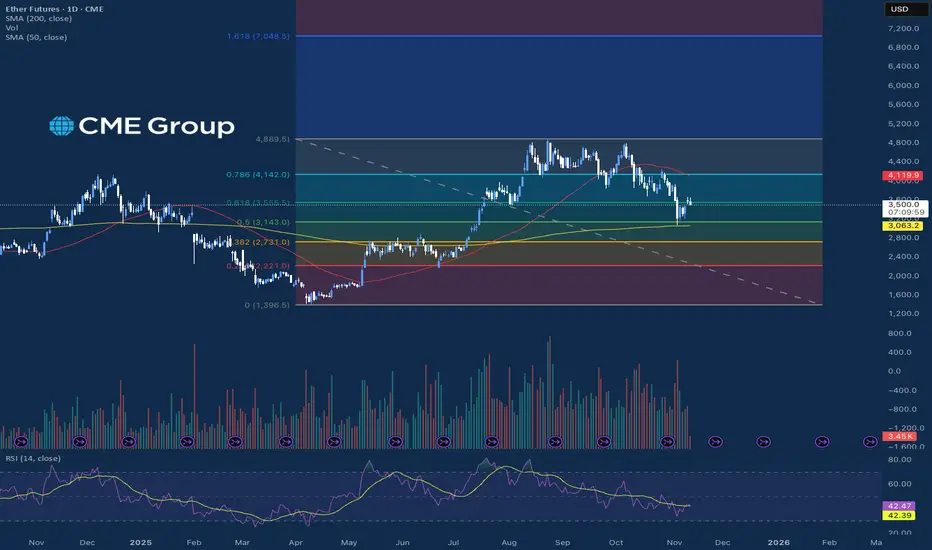
Ether Futures On The MoveEther futures experienced a highly volatile start to November, characterized by a sharp mid-month sell-off that erased strong gains made in late October. After peaking above the $4,700 level, the price quickly reversed, plunging toward 3,800 as global market risk sentiment deteriorated following cautious guidance from the U.S. Federal Reserve. The correlation with major tech indices remained a significant factor, leading to amplified selling when the broader equity market pulled back. Despite this volatility, Ether futures stabilized near the $4,000, suggesting that fundamental institutional support prevented a full trend collapse.
Ether futures selling pressure This sustained institutional presence remains the most critical factor in the market. Ether futures volume saw massive growth in October, showing increasing demand from professional and retail traders for regulated products. As shown in the chart, the 50% retracement level and the 200-day moving average are very close to each other and have acted as a support pocket since the breakout above the 200-day moving average in July.
*CME Group futures are not suitable for all investors and involve the risk of loss. Copyright © 2023 CME Group Inc.
**All examples in this report are hypothetical interpretations of situations and are used for explanation purposes only. The views in this report reflect solely those of the author and not necessarily those of CME Group or its affiliated institutions. This report and the information herein should not be considered investment advice or the results of actual market experience.
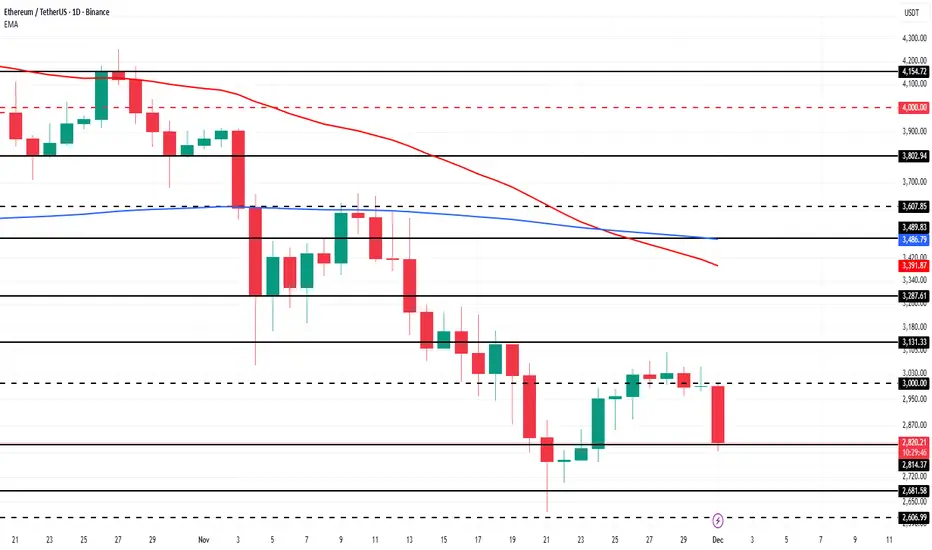
Can Ethereum Holders Help Price Break Its Month-Long Downtrend?Ethereum’s price stands at $3,604 at the time of writing, hovering just below the critical $3,607 resistance mark. The altcoin king has been struggling against its descending trendline for over a month, making this level a key breakout point.
If Ethereum can flip $3,607 into support, the next target would be $3,802, followed by a potential move toward $3,950. Sustained support from LTHs and rising sentiment could fuel this upward trajectory, allowing ETH to escape its bearish grip.
However, if investors begin taking profits, Ethereum could slip below the $3,489 support level. A further decline toward $3,287 would invalidate the bullish thesis. This would signaling renewed selling pressure and extending the ongoing downtrend.

ETHEREUM HIGH PROBABILITY SETUP SOON!!!🚨 ETHER HIGH PROBABILITY SELL/BUY SETUP 🚨
* Here We Can See Clearly The Next Potential Moves For ETHUSD Coming Hours/Days.
* Keep Your Eyes Close On Your Trading Positions.
* Happy PIP Hunting Traders.
FXKILLA.

Can Short-Term Holders Rescue Ethereum From a Drop to $3,500?At the time of writing, Ethereum is trading at $3,846, holding just above the $3,802 support level. The altcoin king is likely to remain rangebound as market conditions show limited volatility.
Ethereum’s price currently fluctuates between $4,154 and $3,802. This consolidation range could persist in the coming sessions, with ETH possibly retesting resistance if short-term momentum returns.
However, if bearish conditions intensify and Ethereum loses the $3,802 support, a further drop could follow. A breakdown below this level may send the price under $3,742 and toward $3,500, invalidating the bullish thesis and signaling deeper market weakness ahead.

Eth Short :: ETF Outflows / DAT RiskETH is in a descending triangle on the 4 hour chart which is a bearish pattern.
A few other factors outside of price action that suggest a possible correction:
Net weekly ETF outflows. -63k ETH last week.
Potential multi-year double top playing out but that won't be invalidated until price falls below $1,000ish which is highly unlikely.
ETH validator exit queue at record high level of 43 days with roughly 25 million ETH queued to exit staking. Not all is likely to be sold, but the record exodus can't be bullish. www.validatorqueue.com
Proliferation of Digital Asset Treasuries (DATs) that add very little value to the ecosystem to justify a premium over readily available ETFs. Given the recent decline in ETH price, many are now trading at a discount to NAV. This creates the potential for a negative spiral by forcing sales of assets which adds further pressure to others. Tom Lee who has a vested interest in DAT success said the DAT bubble has started to pop (DAT bubble..not specifically ETH). This by far is the biggest risk to the space. It may take some time to materialize but if it does, I suspect that it will be unwind rapidly.
There are many incredibly bullish counterarguments that could easily take this back up quickly, so this idea will be invalidated when the upper trend line is broken on volume.
My long-term view is bullish but there is a lot of hype and excess in the space that periodically needs to be cleared out. If the descending triangle plays out, we could see another ~20% drop to the $3,000 range.
I am already short but the more cautious approach is to wait until the lower support is broken on volume.
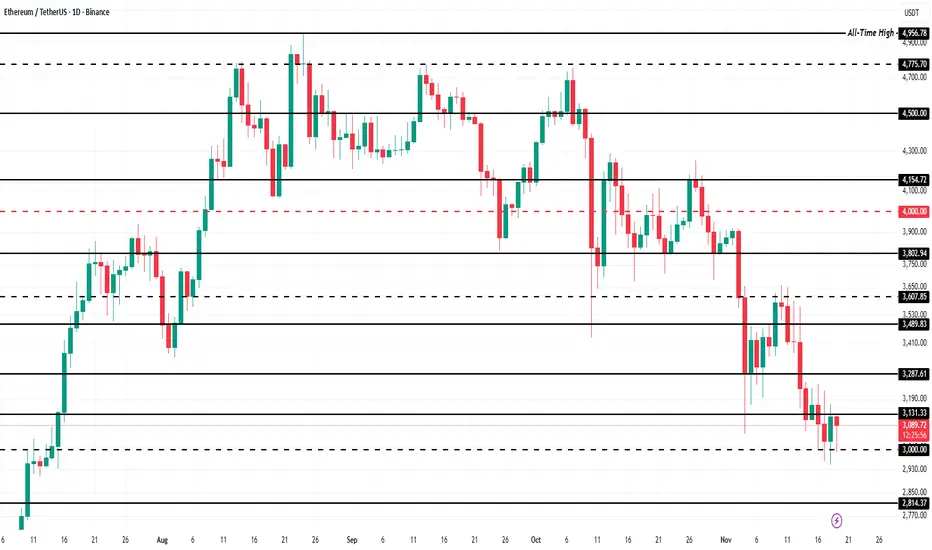
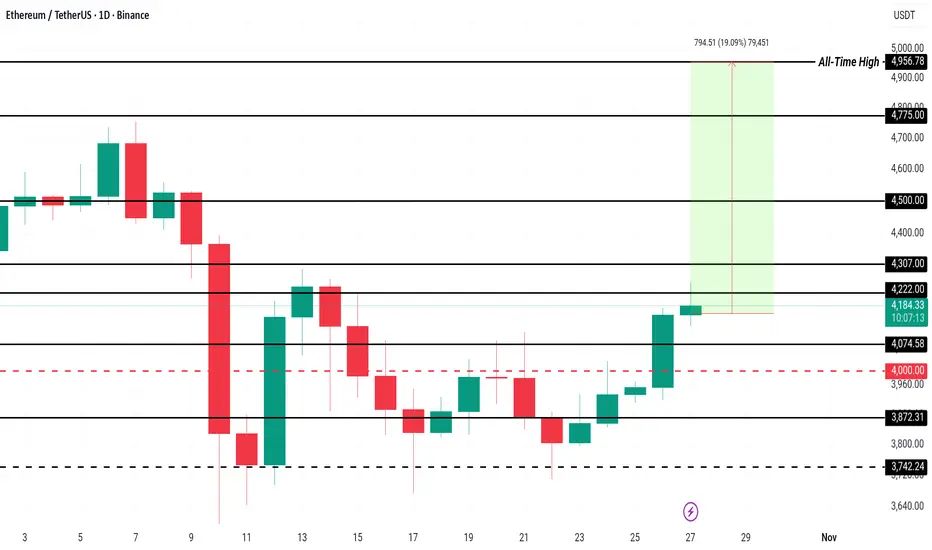
3 Altcoins That Could Hit All-Time Highs In November 2025Ethereum is trading at $4,156, holding firmly above the $4,000 support while facing resistance at $4,221. The altcoin king's recent consolidation reflects cautious optimism among traders.
To reach its all-time high of $4,956, Ethereum needs a 19% price increase. This requires breaking through resistances at $4,221 and $4,500. The Relative Strength Index (RSI) indicates strengthening bullish momentum, suggesting buyers are regaining control and could drive ETH higher.
However, if selling pressure intensifies, Ethereum could fall below $4,000 and target $3,872 or even $3,742. Such a decline would signal weakening demand and invalidate the bullish outlook.
Ethereum Sees Major Sell-Off as Price Fails to Break $4,000Ethereum’s price sits at $3,950 at the time of writing, stuck below the critical $4,000 resistance. The altcoin has been oscillating near $3,872, showing no clear directional bias.
The current indicators suggest that this consolidation phase above $3,742 support is likely to persist. However, if market conditions worsen and ETH slips below $3,742, a further decline toward $3,489 could follow. Such a move would confirm a bearish continuation pattern.
Conversely, if buying activity strengthens and overall sentiment improves, Ethereum could breach the $4,000 resistance level. A successful breakout would open the path toward $4,221, invalidating the bearish outlook and signaling renewed investor confidence.
