ETH 4H Trade ideaHere is an idea on how you can plan your trade in advance.
CRYPTOCAP:ETH key buying level with SL & TPs are given. RR is excellent of 2.2.
NFA DYOR.
Ethereum (Cryptocurrency)

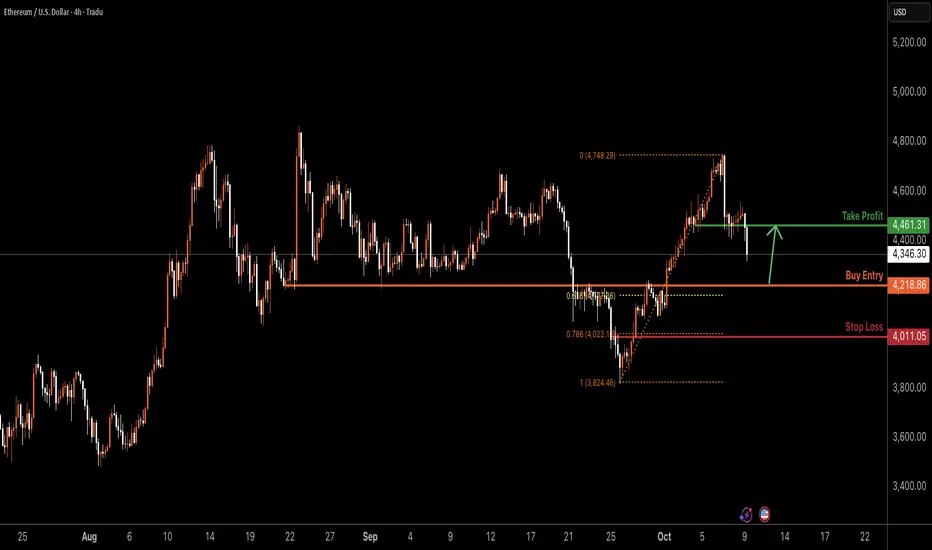
ETHUSD H4 | Bullish Reversal at Key SupportETH/USD is falling towards the buy entry at 4,218.86, which is an overlap support that is slightly above the 61.8% Fibonacci retracement and could bounce from this level ot the upside.
Stop loss is at 4,011.05, which is a pullback support that aligns with the 78.6% Fibonacci retracement.
Take profit is at 4,461.31, which is a pullback resistance.
High Risk Investment Warning
Trading Forex/CFDs on margin carries a high level of risk and may not be suitable for all investors. Leverage can work against you.
Stratos Markets Limited (tradu.com ):
CFDs are complex instruments and come with a high risk of losing money rapidly due to leverage. 65% of retail investor accounts lose money when trading CFDs with this provider. You should consider whether you understand how CFDs work and whether you can afford to take the high risk of losing your money.
Stratos Europe Ltd (tradu.com ):
CFDs are complex instruments and come with a high risk of losing money rapidly due to leverage. 66% of retail investor accounts lose money when trading CFDs with this provider. You should consider whether you understand how CFDs work and whether you can afford to take the high risk of losing your money.
Stratos Global LLC (tradu.com ):
Losses can exceed deposits.
Please be advised that the information presented on TradingView is provided to Tradu (‘Company’, ‘we’) by a third-party provider (‘TFA Global Pte Ltd’). Please be reminded that you are solely responsible for the trading decisions on your account. There is a very high degree of risk involved in trading. Any information and/or content is intended entirely for research, educational and informational purposes only and does not constitute investment or consultation advice or investment strategy. The information is not tailored to the investment needs of any specific person and therefore does not involve a consideration of any of the investment objectives, financial situation or needs of any viewer that may receive it. Kindly also note that past performance is not a reliable indicator of future results. Actual results may differ materially from those anticipated in forward-looking or past performance statements. We assume no liability as to the accuracy or completeness of any of the information and/or content provided herein and the Company cannot be held responsible for any omission, mistake nor for any loss or damage including without limitation to any loss of profit which may arise from reliance on any information supplied by TFA Global Pte Ltd.
The speaker(s) is neither an employee, agent nor representative of Tradu and is therefore acting independently. The opinions given are their own, constitute general market commentary, and do not constitute the opinion or advice of Tradu or any form of personal or investment advice. Tradu neither endorses nor guarantees offerings of third-party speakers, nor is Tradu responsible for the content, veracity or opinions of third-party speakers, presenters or participants.
ETHEREUM will holdEthereum has 2 supports in 4H timeframe with bullish divergence on RSI, and I think it will bounce from those areas

ETHEREUM Free Signal! Buy!
Hello,Traders!
ETHEREUM rebounds from the horizontal demand area, confirming Smart Money accumulation within discount territory. Liquidity has been swept below recent lows, opening the way for expansion toward 4,659$ as inefficiency gets filled.
-------------------
Stop Loss: 4,406$
Take Profit: 4,659$
Entry: 4,531$
Time Frame: 4H
-------------------
Buy!
Comment and subscribe to help us grow!
Check out other forecasts below too!
Disclosure: I am part of Trade Nation's Influencer program and receive a monthly fee for using their TradingView charts in my analysis.

Quantum Computing and the Future of Blockchain Security
Many modern blockchains, including those using ECDSA signatures such as BITSTAMP:BTCUSD and COINBASE:ETHUSD , rely on cryptography that could one day be challenged by advances in quantum computing. While practical quantum attacks remain theoretical today, the discussion about post-quantum security is becoming more relevant as research accelerates.
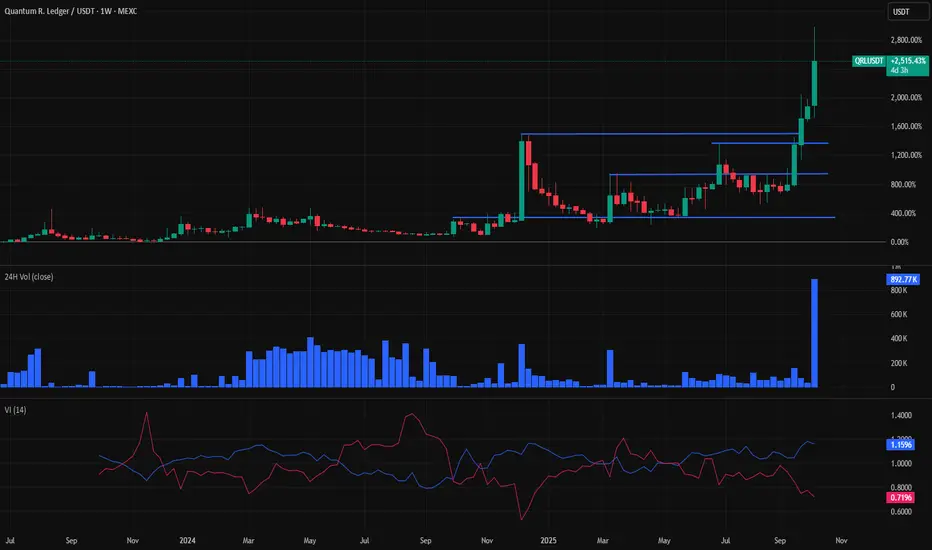
Quantum Resistant Ledger ( MEXC:QRLUSDT ) is an example of a project that was designed from the beginning with quantum security in mind. Launched in 2018, it implements a different signature scheme (XMSS) that aims to remain secure against quantum-based attacks. Attached is the daily chart for MEXC:QRLUSDT , showing a rise in volatility as quantum computing news gained attention.
Recently, growing awareness of quantum computing’s potential impact on digital assets has coincided with higher volatility in quantum-security-related tokens. Traders are increasingly paying attention to how the “quantum threat” narrative may influence long-term blockchain evolution and investor sentiment.
From a broader perspective, the topic raises important questions for the crypto industry:
- How fast will quantum computing capabilities advance?
- What kinds of post-quantum algorithms are being tested by major networks?
- Which projects are best positioned to adapt to these changes?
As always, it’s important to approach the subject analytically. The quantum-security discussion may not affect market prices in the short term, but it could shape future developments across the blockchain landscape.
Breaking Resistance: Gold Eyes $4,500 by Year-EndLooking at this weekly chart of Gold (XAU/USD), we can clearly see the explosive price action that has been building up. The price has been climbing steadily, with the 33-period EMA providing strong support along the way. The breakout above the resistance zone is a strong signal that the bullish momentum is gaining strength.
However, the price is now approaching a key resistance level around $4,049, which could act as a significant hurdle. If this level holds, we might see some consolidation or a potential pullback before the next move up.
Keep an eye on how the price interacts with the resistance — a break above could signal further upside, while failure to break could lead to a retest of lower support levels. It’s a crucial moment for Gold, and any confirmation above this zone could trigger a strong continuation of the uptrend.

ETHUSD – 1H | Bullish Reversal from Demand ZoneBITSTAMP:ETHUSD
Structure | Trend | Key Reaction Zones
Market retested the 4,440–4,465 strong demand zone, respecting structure after a deep liquidity sweep.
Overall structure remains bullish, with previous accumulation and breakout zones aligning with channel support.
Market Overview
ETH completed a sharp correction after facing rejection near 4,758 resistance, tapping into the demand base where buyers previously stepped in. With liquidity cleared and demand reaction visible, a bullish continuation is likely if price holds above 4,465.
Key Scenarios
✅ Bullish Case 🚀 →
🎯 Target 1: 4,535
🎯 Target 2: 4,621
🎯 Target 3: 4,672 (major resistance retest)
❌ Bearish Case 📉 →
Invalidation below 4,413 (break of demand zone).
Current Levels to Watch
Resistance 🔴: 4,621 / 4,672
Support 🟢: 4,465 / 4,413
⚠️ Disclaimer: This analysis is for educational purposes only. Not financial advice.

QRL is Riding the Quantum Wave
ECDSA encryption, used by most blockchains such as BITSTAMP:BTCUSD and COINBASE:ETHUSD , will be broken by quantum computers within the next few years. This means that most blockchains will eventually need to upgrade to post-quantum security. That will be an enormous and complex task.
Quantum Resistant Ledger ( MEXC:QRLUSDT ), launched in 2018, was built for quantum resistance from its very first block. A truly visionary double audited project ahead of its time, it remains one of the few genuinely quantum-secure cryptocurrencies.
Lately, quantum computing news seems to be raising awareness and driving QRL’s price higher. Today’s volatility was the highest since it was listed on MEXC. A BitMart listing is expected soon, and the team has been working for years on a major upgrade that will make QRL similar to Ethereum but quantum-resistant.
The community is extremely active on the official QRL Discord, where highly skilled professionals answer every question patiently. Marketing efforts are also ramping up as the community spreads awareness and encourages everyone to do their own research.
Personally, I see asymmetric potential here, a bit like Bitcoin in its early days. No one can say how high the valuation could go, but it is clear that there is a growing need for this kind of asset. At the TOKEN2049 event in Singapore, Charles Edwards suggested that Bitcoin and Ethereum holders should hedge their risk by allocating 5%, 10%, or whatever they feel comfortable with, to quantum-secure assets. QRL seems like a strong candidate for that role.

HERE ARE THE NEXT TARGETS OF BITCOIN AND ETHEREUM (warning) Yello Paradisers! Enjoy the video!
And Paradisers! Keep in mind to trade only with a proper professional trading strategy. Wait for confirmations. Play with tactics. This is the only way you can be long-term profitable.
Remember, don’t trade without confirmations. Wait for them before creating a trade. Be disciplined, patient, and emotionally controlled. Only trade the highest probability setups with the greatest risk to reward ratio. This will ensure that you become a long-term profitable professional trader.
Don't be a gambler. Don't try to get rich quick. Make sure that your trading is professionally based on proper strategies and trade tactics.

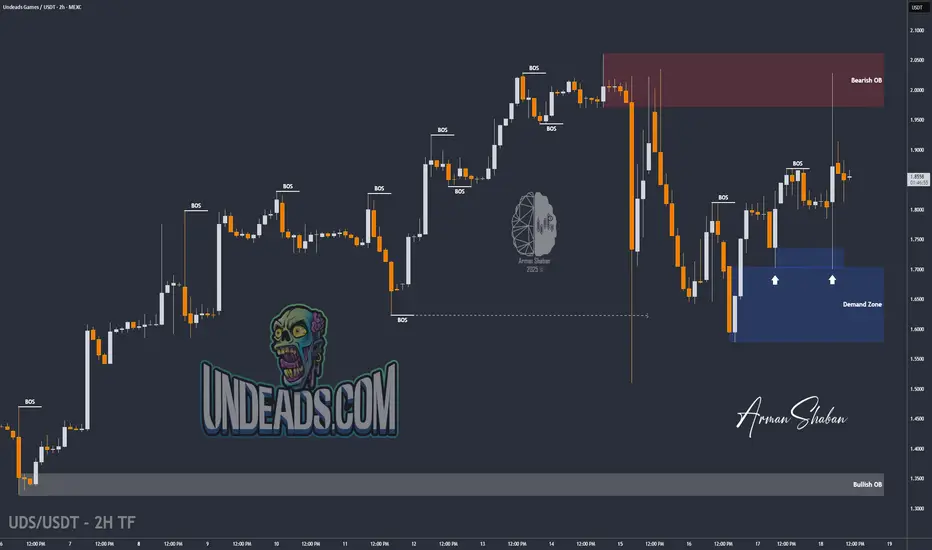
UDS/USDT | GameFi Token UDS Surges – Post-to-Earn Hype ContinuesIn the past two weeks, UDS (Undeads) has gained over 50%! UDS is a GameFi/Web3 project built on a metaverse economy, with staking and NFTs, and it uses a post-to-earn model to boost community engagement.
Looking at the 2-hour chart, we can see that yesterday the price surged by 19%, from $1.70 to $2.02, before correcting again. Right now, UDS is trading around $1.85. If the price can hold above the $1.78–$1.83 demand zone, we can expect more upside.
Keep in mind, this coin is highly volatile, so be cautious if trading it. The next bullish targets, if the rally continues, are $1.88, $1.91, and $1.97. This analysis will be updated again!
Please support me with your likes and comments to motivate me to share more analysis with you and share your opinion about the possible trend of this chart with me !
Best Regards , Arman Shaban
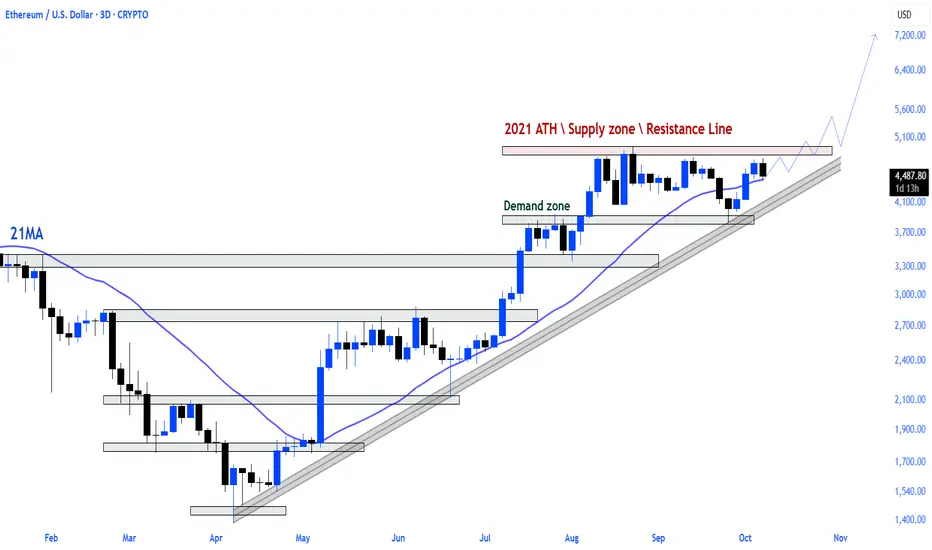
$ETH is pushing the critical threshold.Ethereum maintains its upward trend as it approaches the supply zone and major resistance line from its 2021 peak once again.
The price structure, backed by the 21MA support, shows that momentum remains upward with a strong series of higher lows.
A breakout from this region would mark a transition to a new parabolic phase for ETH.
Ethereum slides below $4,750 Ethereum slides below $4,750
Canary Capital has filed to launch spot ETFs for Litecoin (LTCC) and Hedera (HBR), each carrying a 0.95% management fee. Analysts say the products appear ready for approval, but the ongoing U.S. government shutdown has paused SEC activity, delaying reviews until late October.
The firm’s filings also outline enhanced access controls for users of Bitcoin and Ethereum, signaling broader integration within regulated crypto markets. Experts suggest the move could boost interest in altcoins once operations resume.
Meanwhile, Ethereum faces heavy validator outflows, with over 2.4 million ETH (≈$10B) awaiting withdrawal — the largest on record. Despite this, institutional demand remains strong, and Grayscale’s newly approved Ethereum Trust ETF with staking has been viewed as a bullish development for ETH and the broader crypto market.

ETHUSD Bullish Trend Potential | Break and Retest Trade Plan📹 In this video, we take a closer look at Ethereum (ETH), which has been in a strong bullish trend on the higher time frames 🔥. Recently, ETH has seen a deep pullback, offering potential opportunities if price action confirms a bullish break of market structure on the 30-minute timeframe ⏱️.
💡 I’m watching for a break and retest of the existing range low support, which could signal a continuation of the broader uptrend.
📊 In the video, we cover price action, market structure, trend analysis, and share a trade idea based on these factors 🎯.
⚠️ Disclaimer: This content is for educational purposes only and not financial advice.

#ETH/USDT looking extremely bullish#ETH
The price is moving within a descending channel on the 1-hour frame, adhering well to it, and is heading for a strong breakout and retest.
We have a bearish trend on the RSI indicator that is about to be broken and retested, which supports the upward move.
There is a major support area in green at 4400, which represents a strong support point.
We are heading for consolidation above the 100 moving average.
Entry price: 4455
First target: 4512
Second target: 4573
Third target: 4650
Don't forget a simple matter: capital management.
When you reach the first target, save some money and then change your stop-loss order to an entry order.
For inquiries, please leave a comment.
Thank you.

KOMAUSDT — Trendline Breakout: Structural Reversal or Bull TrapOverview
KOMA/USDT has finally delivered a significant technical signal after months of consolidation within a tight accumulation range.
The latest daily candle successfully broke above a major descending trendline and a key horizontal resistance, signaling the early phase of a potential trend reversal from long-term bearish pressure to renewed bullish momentum.
This breakout could represent a psychological shift in market sentiment — from distribution to accumulation — and may define the next major leg of price expansion if confirmed by volume and structure.
---
Market Structure Insight
Primary Trend: Bearish since early 2025, marked by consistent lower highs and lower lows.
Structural Shift: A clear daily breakout above the descending trendline suggests the start of a higher-high structure formation.
Key Zone (Accumulation Range): The 0.020–0.027 area has acted as a multi-month resistance zone, now potentially flipping into new structural support (S-R Flip).
Momentum Confirmation: A strong breakout candle accompanied by volume expansion hints at growing institutional interest.
---
Technical Pattern Breakdown
The pattern combines two powerful structural elements:
Descending Trendline Breakout → indicates exhaustion of long-term selling pressure.
Range Accumulation Base → acts as the energy build-up phase before a new impulsive move.
If the price performs a successful retest of the breakout zone, this pattern transitions into a trend reversal base, which historically precedes sustained bullish continuation phases.
---
Bullish Scenario (Primary Bias)
1. Validation Conditions:
Daily close above 0.027 with sustained trading above the breakout zone.
Rising volume and RSI holding above the 50 line.
2. Continuation Setup:
A clean retest followed by a higher low formation would confirm structural reversal.
3. Upside Targets:
TP1: 0.0489 — First expansion resistance.
TP2: 0.0633 — Mid-term structural level.
TP3: 0.0935 — Major resistance zone.
Extended targets: 0.128 – 0.169 if momentum persists.
4. Stop-Loss Placement:
Below 0.020 or under the most recent swing low.
5. Risk/Reward Outlook:
Strong R:R potential (>3R) from the breakout base with multi-tier scaling opportunities.
---
Bearish Scenario (Alternative Bias)
1. Invalidation Trigger:
Daily close below 0.020 or a re-entry into the previous range (false breakout).
2. Market Implications:
A bull trap scenario could trigger a deeper correction toward 0.0142, the historical low support.
3. Volume Confirmation:
A drop with rising sell volume would confirm distribution rather than accumulation.
4. Bias Reversal:
If this occurs, the broader bearish structure remains intact and consolidation may resume.
This type of breakout often marks the transition from accumulation to markup phase, particularly if confirmed with a successful retest and sustained buying volume.
KOMA/USDT has just broken through the upper boundary of a long-standing downtrend — a technical milestone that could set the stage for medium-term reversal momentum.
However, confirmation is key. Without a retest that holds, this move could remain a temporary liquidity sweep.
Traders should closely monitor daily closes and reaction around the 0.027 zone to confirm whether this is a true structural reversal or merely a bull trap.
#KOMA #KOMAUSDT #CryptoAnalysis #BreakoutTrading #TechnicalAnalysis #PriceAction #AltcoinWatch #CryptoMarket #TrendReversal #SupportResistance #RiskManagement

ETH/USD 4H SetupETH/USD 4H Setup ⚡️
Price tapped key support near $4,450 and showing early reaction.
Watching for a potential bounce toward $4,750–$4,760 (CRTH Target).
Stay sharp — liquidity sweep might fuel the next move. 🚀
Greetings,
MrYounity

ETHUSD: Where Price Could Go?4h tf
ETHUSD has bounced back strongly from around $3,826 after completing an A-B-C wave pattern. Right now, the price is testing resistance near $4,756. It could drop a little to around $4,440 before moving higher again. If the uptrend continues, the next target levels are $4,955, $5,300, and $5,500.
Stay tuned!
Thank you,
@Money_Dictators

$ETH hit the $4,750 resistance again, just like I said before. CRYPTOCAP:ETH hit the $4,750 resistance again, just like I said before. It went below $4,000 for a short time but closed the week back above it. Now the price is falling again. If it breaks below $4,000, the next targets are $3,500 and $3,000.

ETHEREUM Local Long! Buy!
Hello,Traders!
ETHEREUM reacts perfectly from the horizontal demand area, showing bullish intent as Smart Money rebalances inefficiency. A move toward the 4,560$ target level remains probable as demand continues driving expansion. Time Frame 2H.
Buy!
Comment and subscribe to help us grow!
Check out other forecasts below too!
Disclosure: I am part of Trade Nation's Influencer program and receive a monthly fee for using their TradingView charts in my analysis.

ETHEREUM New Update (12H)The upward retracement has invalidated the previous analysis.
The best area for a strong price rejection is the QM L zone up to the historical high.
If you’re looking to take a short (sell) position, wait for the price to reach the red-marked zone in the coming days.
For risk management, please don't forget stop loss and capital management
When we reach the first target, save some profit and then change the stop to entry
Comment if you have any questions
Thank You

ETHUSD consolidation ahead of another leg higher?The ETHUSD remains in a bullish trend, with recent price action showing signs of a breakout within the broader uptrend.
Support Zone: 4,623 – a key level from previous consolidation. Price is currently testing or approaching this level.
A bullish rebound from 4,623 would confirm ongoing upside momentum, with potential targets at:
4,860 – initial resistance
4,940 – psychological and structural level
5,000 – extended resistance on the longer-term chart
Bearish Scenario:
A confirmed break and daily close below 4,623 would weaken the bullish outlook and suggest deeper downside risk toward:
4,557 – minor support
4,454 – stronger support and potential demand zone
Outlook:
Bullish bias remains intact while the ETHUSD holds above 4,623. A sustained break below this level could shift momentum to the downside in the short term.
This communication is for informational purposes only and should not be viewed as any form of recommendation as to a particular course of action or as investment advice. It is not intended as an offer or solicitation for the purchase or sale of any financial instrument or as an official confirmation of any transaction. Opinions, estimates and assumptions expressed herein are made as of the date of this communication and are subject to change without notice. This communication has been prepared based upon information, including market prices, data and other information, believed to be reliable; however, Trade Nation does not warrant its completeness or accuracy. All market prices and market data contained in or attached to this communication are indicative and subject to change without notice.

The $ETH season is inevitable \ Road to $10k
Ethereum has entered its third major market cycle while maintaining its historical cyclical structure.
Regression lines on the logarithmic chart and the repetition of previous cycles indicate that the $10,000 target is technically feasible.
Momentum is increasing, the structure is being finalized. An Ethereum centered market rotation is approaching.

Eth/Usd - Decision Point At Key Resistance ZoneEthereum is currently approaching a crucial resistance zone around the 4710 level, marked as a major decision point. Price has shown multiple Breaks of Structure (BOS) in the past, confirming active liquidity on both sides. The highlighted zone represents a critical area where market direction could shift based on reaction strength.
If buyers maintain momentum and successfully break above the resistance with solid bullish candle closures, a continuation move toward the upper target zone (around 4780–4800) can be expected. This would confirm a short-term bullish structure and potential sweep of the weak high.
However, a strong rejection from this decision point could trigger a bearish reaction, leading to a downside move toward the lower target zone near 4660–4640. Traders should watch for clear signs of market structure shift (CHoCH) and volume confirmation before entering.
