BTC is losing dominance, Alt season!With the passing of the Genius Act , ETH , ADA , and many other American altcoins gained strong momentum. BTC dominance is bearish, and with the Clarity Act in the process of being passed, I expect lower dominance for BTC in 2025 and 2026. As you can see in the weekly chart, BTC dominance lost its momentum within a key rising parallel channel and dropped into a lower channel. Alt season is coming!
Ethereum (Cryptocurrency)

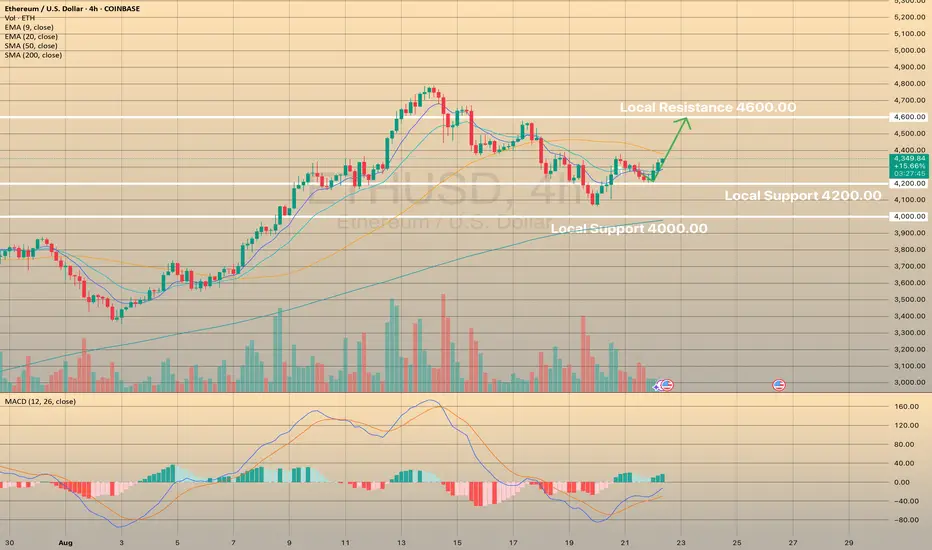
ETHUSD develops new bullish impulseETHUSD develops new bullish impulse
Ethereum is surpassing Bitcoin due to the anticipated approval by the SEC for spot ETFs, the increased adoption by companies, and the positive stance of the SEC regarding liquid staking tokens, which has sparked institutional interest.
Recently the asset managed to hold above the 4,200.00 level. Right now, ethereum is developing a new bullish momentum heading towards 4,600.00 local resistance. MACD has crossed and is in the green zone currently on 4-hour timeframe.
ETHUSDT analysis – 1D OB & Market Structure Scenarios/ AltseasonOn the daily chart, Ethereum is consolidating below the ATH resistance (4859) after a strong rally.
We currently have two major Daily OB demand zones:
First Daily OB around 3200–3600
Second Daily OB around 2400–2800
From here, I see three possible scenarios:
1️⃣ Continuation without deep retracement → Price holds above 4100 and breaks ATH (4859).
2️⃣ Shallow pullback → Price dips into the 3200–3600 OB, then rallies back above ATH.
3️⃣ Deep correction → Price retraces into the 2400–2800 OB before starting a new bullish leg.
⚡ Key point: If any of these three bullish scenarios play out alongside a drop in BTC dominance and a rise in ETH dominance, it could be the real start of an Altseason, with ETH leading the market and altcoins following strongly.
📊 ProfitaminFX | Gold, BTC & EUR/USD
📚 Daily setups & educational trades

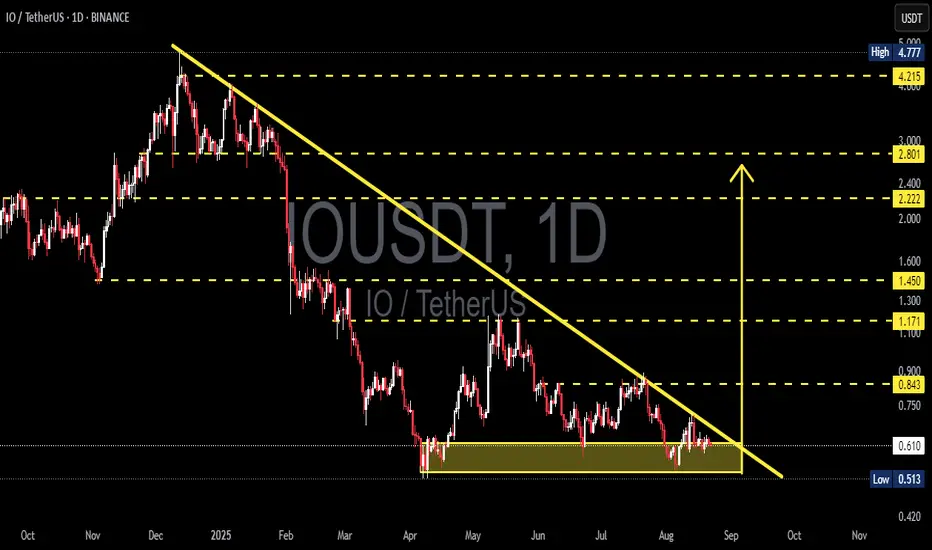
IOUSDT — Descending Triangle at Key Demand Zone!✨ Overview
The IOUSDT chart on the daily timeframe is showing a critical consolidation phase after a prolonged downtrend. Price is currently sitting inside the major demand zone 0.53–0.65, forming a descending triangle pattern — a classic setup that often leads to a decisive breakout move.
The falling trendline (yellow) is pressing down a series of lower highs, while the horizontal support around 0.60 remains intact. This reflects a supply vs demand compression: once this battle ends, the market usually delivers a strong directional move.
---
📈 Bullish Scenario (Breakout Potential)
1. Trendline Breakout
A daily close above the descending trendline would be the first signal that sellers are losing control.
Stronger confirmation comes with a successful reclaim of 0.843 (nearest horizontal resistance).
2. Bullish Targets
If a breakout occurs, price could aim for the following resistances step by step:
0.843 → breakout validation.
1.171 → psychological resistance.
1.450 → prior supply zone.
2.222 – 2.801 → expansion zone.
4.215 → major resistance & mid-term target.
3. Why Buyers May Be Confident
The 0.53–0.65 demand zone has held firmly since April 2025.
Bearish momentum is weakening, as sellers have failed to print significantly lower lows.
---
📉 Bearish Scenario (Breakdown Continuation)
1. Support Breakdown
A daily close below 0.513 would confirm a breakdown from the descending triangle.
The projected measured move points towards 0.37–0.40 as the next major target.
2. Retest Setup
After a breakdown, price may retest the 0.53–0.60 zone as new resistance before continuing lower.
Aggressive traders could look for short opportunities here.
3. Bearish Risk Factor
If a false breakdown occurs and price quickly recovers above 0.53–0.60, sellers may get trapped, potentially triggering a short squeeze rally.
---
🔑 Key Technical Takeaways
Descending Triangle → Typically bearish continuation, but an upside breakout can flip it into a strong bullish reversal signal.
Demand Zone 0.53–0.65 → The make-or-break area for buyers to defend.
Downtrend Line → As long as it remains unbroken, mid-term structure still favors sellers.
---
🎯 Conclusion
IOUSDT is now at a make-or-break junction:
Bullish case: breakout above trendline + reclaim of 0.843 could fuel momentum towards 1.171 and even 2.222.
Bearish case: daily close below 0.513 may unlock further downside into the 0.37 area.
Patience is key — waiting for a confirmed breakout or breakdown will provide clarity for the next strong move.
#IOUSDT #IO #CryptoAnalysis #DescendingTriangle #BreakoutSetup #BearishOrBullish #SupportResistance #PriceAction #TrendlineBreakout #CryptoTrading #TechnicalAnalysis
Ethereum 7 Days Later · Retrace Or Correction?More information is available now that Ethereum has been retracing for seven days, we can start to make some predictions by analyzing how the token is currently behaving, for example; there isn't much on this chart other than high volume the day that ETHUSDT peaked, the other bearish signals are weak.
The drop is not strong. ETHUSDT is trading safely above EMA55. This move resembles what happened 11-June. A retrace.
On 11-June ETHUSDT peaked at $2,879 and started to retrace. 11 days later, 22-June, ETHUSDT bottomed at $2,111 and that's it, that was the retrace. The entire move was a 26.65% drop, I think we can see something similar.
28-July ETHUSDT peaked again but only briefly, there was a six days long retrace totaling -14.89%. The drop happened from $3,941 to $3,354 but then Ethereum just kept on growing as if nothing happened like before; it is possible to see something similar.
The strength of the current drop, after seven days of bearish action, seems weak. It can intensify in a flash and we see a market crash, but the same dynamics that are present with Bitcoin are also present here. A major crash or flush would only result in a prolonged recovery followed by higher prices.
Ether is likely to move lower but not much lower. Ether is likely to consolidate just to move higher. Ether is growing. Keep it simple.
Namaste.

ETHBTC vs BTC.DEthereum / Bitcoin 📈 Bitcoin Dominance 📉
CRYPTOCAP:ETH / CRYPTOCAP:BTC vs. CRYPTOCAP:BTC.D


ETHBTC Opportunity Buy: Major 2025 AltcoinSeason & Bull MarketThis is the big one and the good one. ETHBTC was bearish since December 2021 but this cycle finally came to an end in April this year. After the initial bullish breakout and higher low we can clearly see some bullish action developing; three consecutive weeks green. The bullish bias is now confirmed. It is still early.
We are looking at 200% potential. The "back to baseline" target. This is a price range where ETHBTC traded sideways as part of a distribution phase for more than two years. This is a must-to-be-tested resistance zone and thus opens up a sure 200% profits potential for this newly developing bullish wave.
Ethereum's ETFs are coming, Bitcoin already has its ETFs. This can mean Ethereum outperforming Bitcoin, and many altcoins, in so many ways. This also opens up the potential for a new all-time high on this pair.
The same sequence of 'low-higher low' happened in the last bull market. ETHBTC hit bottom in September 2019 then produced a higher low and this signaled the start of a major, long-term 447% rise. The conditions are similar now but the rise will be faster.
We have two main targets for the all-time high in late 2025 or early 2026.
1) 0.13207. With 442% profits potential from current price.
2) 0.20278. With 733% profits potential.
The entire bullish cycle for this pair can unravel within 4-6 months. If it becomes extended, it can last one year or longer. Both scenarios are possible.
It is 100% certain that ETHBTC will go on a major bullish cycle together with the rest of the altcoins market. Bitcoin will also grow.
Thanks a lot for your continued support.
If you are bullish on Crypto, comment below.
Namaste.

Ethereum price correction will continue to around $4,000.After Ethereum hit the 4800 resistance level, we are witnessing a price correction. I think Ethereum can goes up again when it hit the Support level at around 4000$.
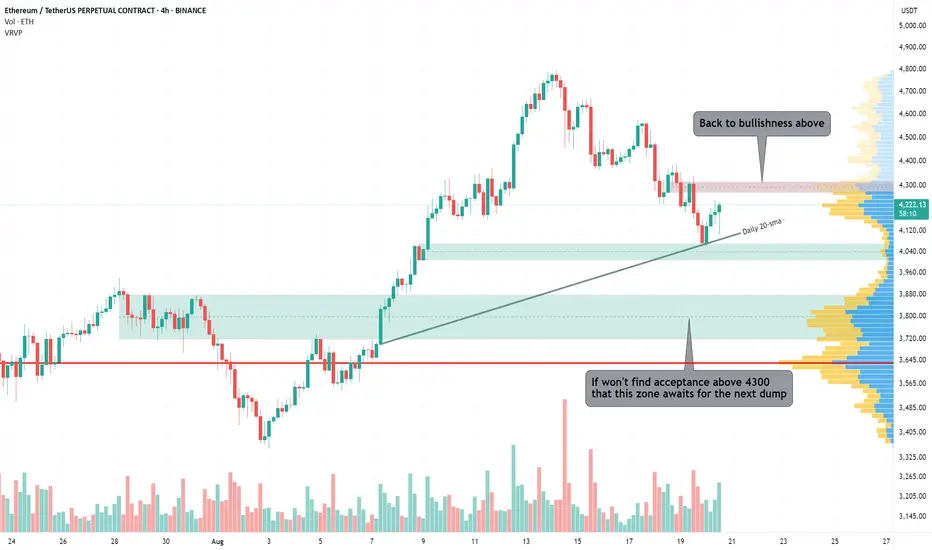
Important level here for ETH🎯 Key Levels to Watch:
• Above: 4240 / 4340 / 4470
• Below: 4090 / 4010 / 3940
🔥 ETH Liquidation Heatmap:
• Above: 4229 / 4275 / 4316
• Below: 4082 / 4040 / 3972
Ethereum just touched Daily 20sma at price ~4066
I bought some there, but frankly, I expected it to fall lower and most of my orders are still there. Unless ETH grows above 4300 and start trading there, chances for another dip to 3940-4010 stay valid.
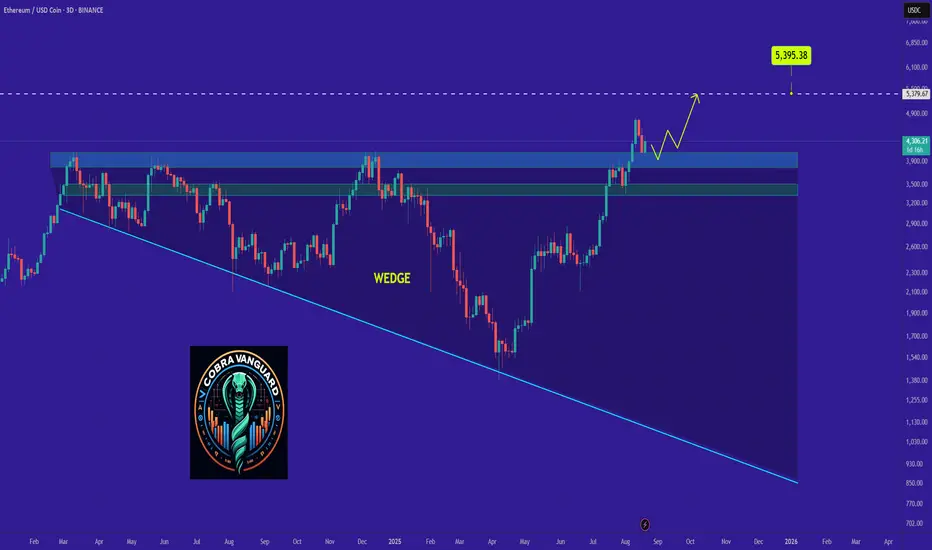
Why ETH Remains Bullish and Its Next Potential Move !It appears that the pullback is nearing its end, which could potentially lead to a price increase of up to $5000.
PREVIOUS ANALYSIS
ETHUSD retreat due to the take-profit pressure, uptrend remainEther recently approached its all-time high from 2021, leading to a period of take-profit pressure. The price is currently retracing towards its 20-day exponential moving average (EMA 20). Trading above the EMAs signifies that the bullish momentum remains strong. Should the price breach below the EMA 20, it could retest the 4059 resistance level. Conversely, if the price holds above the EMA 20, ETHUSD could rebound to test the recent swing high at 4800.
Fundamentally, the cryptocurrency market is now supported by regulation, including the GENIUS Act. Additionally, the new ruling by the US government allowing 401(k) accounts to invest in Crypto provides further support. Meanwhile, HODL waves indicate that more Long-Term Holders (LTHs) are accumulating Ether with a bullish outlook. The long-term perspective for the ether is positive.
By Van Ha Trinh - Financial Market Strategist at Exness

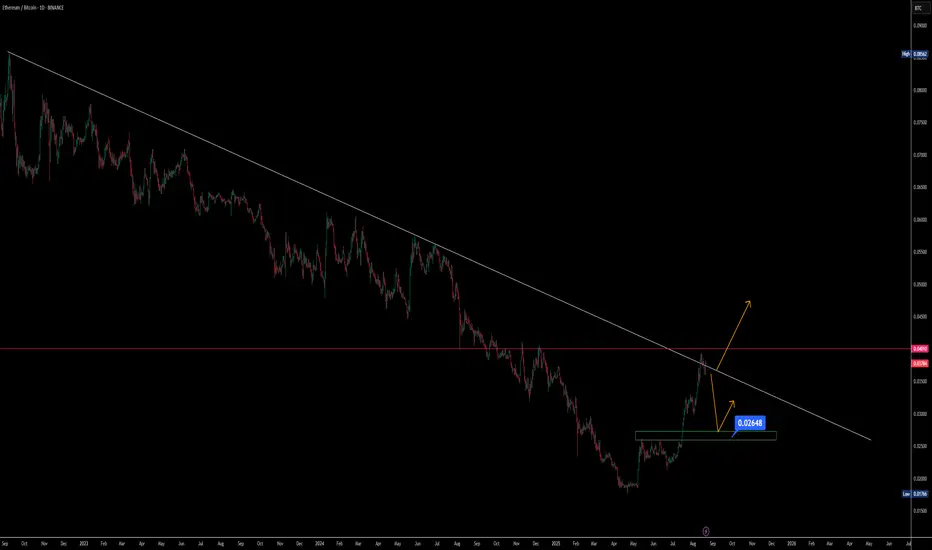
ETHBTC Approaching a Key Decision ZoneSince September 2022, ETHBTC has been in a persistent downtrend as macroeconomic conditions and US interest rate policies favored Bitcoin accumulation over Ethereum. Multiple attempts to break the descending trendline have failed, reflecting limited capital rotation into ETH while BTC remained the dominant asset. The situation began shifting after ETHBTC marked a bottom around April 24, 2025, followed by steady upward movement. This recovery has now brought the pair toward the important resistance region near 0.0378, where price is struggling to break the downtrend line.
If ETHBTC clears both the diagonal and horizontal resistance levels, particularly the 0.04 mark, the pair could see a strong upside continuation driven by renewed momentum. However, recent signals from the FOMC and visible ETF outflows from ETH holdings, alongside fading Bitcoin demand, create uncertainty about immediate bullish continuation. On the downside, if resistance holds, price may revisit the Fibonacci 0.618 retracement zone near 0.02648, often considered a golden pocket that could provide a strong base for the next leg higher.
At present, ETHBTC is in a decisive area where traders should wait for confirmation. A breakout above 0.04 opens the path for bullish momentum, while a correction toward 0.02648 could offer another accumulation opportunity. Until either scenario is confirmed, maintaining patience and avoiding premature entries may be the more prudent approach.
ETHUSD tries to develop another bullish impulseETHUSD tries to develop another bullish impulse
Fed Governor on DeFi: At the Wyoming Blockchain Symposium on August 20, Fed Governor Christopher Waller called DeFi and crypto payments "nothing to be afraid of," pushing for payment infrastructure collaboration. His pro-crypto stance, as a potential Fed chair, gains traction. Lummis on Crypto Bill: Senator Cynthia Lummis said the CLARITY Act, House-approved in July, could reach Trump by year-end with Senate tweaks, aiming for 2026 rollout. China’s Yuan-Backed Stablecoins: China may allow yuan-backed stablecoins to boost global use, reversing its 2021 ban. A late August roadmap review targets cross-border trade, with Hong Kong and Shanghai as hubs, to be discussed at the SCO Summit.
Technically, ETHUSD trades above the EMA20, trying to hold above this moving average. The MACD is in the green zone. The price may pullback towards 4,200.00 with a further bullish impulse towards 4,600.00 level.

ETHEREUM GETTING BULLISH AGAINOn the daily chart, Ethereum holds above the trendline and 20 MA; yesterday's candle is a bullish engulfing. Sub-4k was tested as expected, and Ethereum is ready to take off again to break its all-time high at 4800.

$ETH Bearish Outlook: #Ethereum has retested around the $4,059 CRYPTOCAP:ETH Bearish Outlook:
#Ethereum has retested around the $4,059 is a key support. Losing it could trigger a dump toward $3,500. If ETH fails to reclaim this level and gets rejected below, price could dump toward $3,500. Holding $3,500 may allow a recovery back above $4K, but a breakdown under $3,500 opens the way for deeper downside toward $2,960.
#ETH@CryptoSkullSignal
ETHEREUM - MAKE OR BREAK TIMECRYPTOCAP:ETH Is right at the downtrend line and if it decides to reject then we will most likely be heading down towards $3.8-$4k area.
Weekly WCB formed and the Daily (Top Right) is figuring out what it wants to do.

RAREUSDT — at Critical Accumulation Zone: Breakout or Breakdown?📊 Market Analysis
On the 4D timeframe, RARE/USDT is trading at a crucial pivot zone. The chart structure highlights:
1. Descending Triangle
Clear formation with lower highs pressing price down.
Strong horizontal support between $0.0415 – $0.065 (yellow box).
This pattern often signals bearish continuation, but if accumulation dominates, a bullish reversal can emerge.
2. Major Support Zone
Price has rejected breakdown multiple times in the $0.0415 – $0.050 region, showing active buyers.
This zone acts as the final defense before deeper downside risk.
3. Layered Resistances to the Upside
Key resistance levels if breakout occurs:
$0.0747 → $0.0949 → $0.1349 → $0.1715 → $0.2018 → $0.2208 → $0.2609 → $0.3476 (local high).
---
🚀 Bullish Scenario
For a bullish case, we need:
A confirmed breakout above the descending trendline (yellow).
Strong 4D candle close with volume.
Upside Targets if breakout holds:
🎯 TP1: $0.0747
🎯 TP2: $0.0949
🎯 TP3: $0.1349
🎯 Extended targets: $0.1715 – $0.20
📌 Note: Breakouts from descending triangles often trigger short squeezes → sharp upside moves possible.
---
🐻 Bearish Scenario
If sellers take control and support breaks:
A confirmed breakdown occurs if price closes 4D below $0.0415 with volume.
Downside targets:
🎯 Initial: $0.029 (psychological & historical support).
Lower levels possible if broader crypto sentiment turns bearish.
📌 Note: Descending triangle breakdowns tend to accelerate selling momentum.
---
📌 Pattern & Sentiment
The descending triangle shows sustained selling pressure, but repeated support tests suggest accumulation.
Overall crypto market sentiment (BTC & ETH) will heavily influence the outcome.
In short: RARE is waiting for a major trigger — either breakout or breakdown.
---
🧭 Trading Plan Recap
Bullish if breakout above trendline + close above $0.065–$0.0747 → targets $0.09 / $0.13.
Bearish if close below $0.0415 → target $0.029.
4D timeframe = stronger signals & less noise → better for swing setups.
---
> RARE/USDT 4D — Descending Triangle at Critical Support
RARE is consolidating inside a descending triangle, holding a key support zone at $0.0415 – $0.065.
• Bullish Case → breakout above trendline + volume → targets $0.0747 / $0.0949 / $0.1349 / $0.1715.
• Bearish Case → breakdown below $0.0415 → main target $0.029.
Market structure suggests both accumulation potential and breakdown risk. Wait for confirmation before entering a position.
#RARE #RAREUSDT #Crypto #TechnicalAnalysis #Altcoins #Breakout #SupportResistance #DescendingTriangle

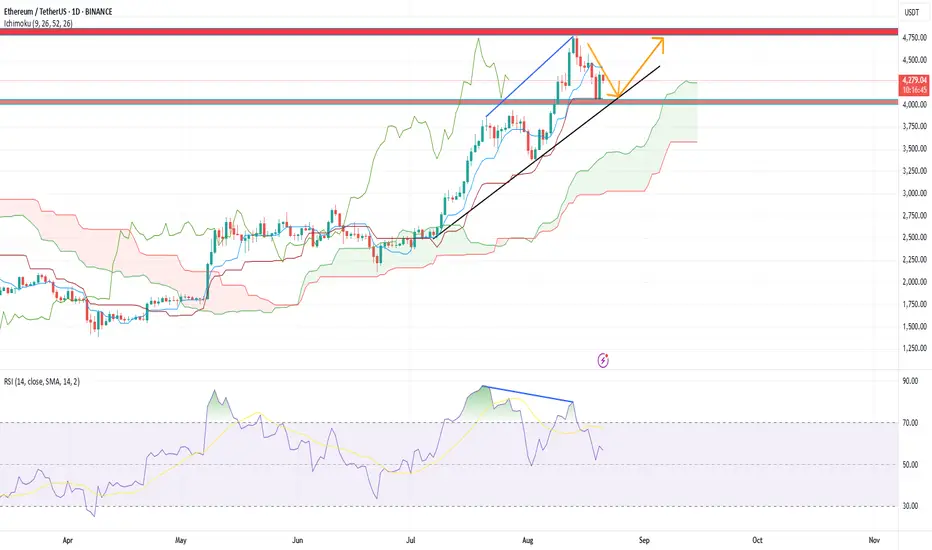
ETH Eyes $4,800–5,000Hello traders,
ETH is currently trading around $4,233 after bouncing from the $4,000 zone. The uptrend remains clear: consecutive higher highs and higher lows, with Fair Value Gaps (FVGs) filled during the upward moves and then expanding further, indicating strong trend-following capital. On the Ichimoku chart, the price stays above the cloud and often rebounds from support zones – a sign that the uptrend has not weakened.
The nearest resistance lies around $4,400–4,500 (August highs). If ETH decisively breaks through, there is ample room for gains toward $4,800–5,000. Key support is at $4,000–3,950, but the uptrend remains dominant as long as this zone holds.
From a news perspective, capital is flowing into altcoins while Bitcoin consolidates, giving ETH an advantage. Market sentiment is also supported by expectations of a potential approval of a spot ETH ETF by year-end – a move that is both symbolic and likely to attract new capital. Fundamentally, Ethereum 2.0 upgrades, Layer 2 ecosystem developments, and fee optimizations continue to enhance user experience, providing a solid foundation for a medium- to long-term bullish trend.
Stay tuned and leave your comments below to share your thoughts on ETH’s next move!

SUI Game Plan - AltcoinSUI Game Plan - Altcoin
📊 Market Sentiment
Overall sentiment remains bullish, supported by expectations of a 0.25% rate cut in the upcoming FOMC meeting. A weakening USD and increasing global risk appetite are creating favorable conditions for further upside in crypto assets.
📈 Technical Analysis
Price was rejected from the broken HTF bullish trendline.
It retraced back to the daily swing demand zone to gather more liquidity.
Price is currently trading below the 0.5 Fibonacci equilibrium level, which I consider a discount zone.
📌 Game Plan
I expect a deeper retracement towards the 4H swing liquidity at $3.45.
Additionally, the 0.75 Fibonacci max discount level aligns with this 4H swing liquidity. Running that liquidity would likely trigger a strong bounce.
🎯 Setup Trigger
I’ll be watching for a 4H break of structure (BOS) to initiate entries.
📋 Trade Management
Stoploss: 4H–1H swing low confirming the BOS
Targets:
TP1: $3.90
TP2: $4.18
TP3: $4.44
💬 Like, follow, and comment if you find this setup valuable!
⚠️ Disclaimer: This content is for informational and educational purposes only and does not constitute financial, investment, or trading advice. Always do your own research before making any financial decisions.

ibit Bitcoin ETF LONG now is a good time to invest. If you go on Google and type in far side Bitcoin and click the link that goes to the farside uk Bitcoin site. You'll see the daily money flows into or out of all of the different Bitcoin ETFs. If you do the same thing but type ethereum instead you'll see all of the different inflows and outflows of money into the ethereum ETF.
This is important because with the Bitcoin ETFs you'll see that there's been hundreds of million dollars in inflows in the past week. Yet both the 19th and the 20th had outflows of money. 1 and 1/2 weeks ago the same thing happened there were two days without flows of money and then it continued with major inflows of money.
In my opinion I believe this is because the large corporations and investors put too much money in to the ETFs in order to manipulate it so that it will gain a higher value.
They also talk to each other and plan these events so that they can profit from them. So let's take five fake companies that we just call 1 2 3 and 4 and 5. These five companies will all talk to each other on the phone and tell each other well we want to put in 200 million over the course of the week well we want to put in 300 million over the course of the week.
Over the course of one week
Company 1 wants to put in 200 million
Company 2 wants to put in 300 million
Company 3 wants to put in 400 million
Company 4 wants to put in 250 million
Company 5 wants to put in 300 million
Total 1.45 billion, they want that money to stay in Bitcoin at their investment.
Like I said they all plan this to manipulate Bitcoin in my opinion.
This is what happens:
Company 2 puts in 600 million
Company 2 puts in 700 million
Company 3 puts in 800 million
Company 4 puts in 450 million
Company 5 puts in 600 million
Total real investment 3.15 billion
Why do they do it?
This is only an example but over the course of one week these companies wanted to put in 1.45 billion but they ended up putting in 3.15 billion.
3.15 billion
1.45 billion -
-------
1.70 billion + surplus
So they put in 1.70 billion dollars over the amount that they were supposed to in order to get a rally going where Bitcoin goes up in value by a lot.
They are also in contact with the stock market listed Bitcoin mining companies so that the Bitcoin mining companies do not sell the Bitcoin. Instead they Bogart the Bitcoin (keep it) so that they can sell at a higher price when the companies get back in touch with them to say it's time to sell.
All of silicon valley is involved as well I believe in my opinion. All the tech companies and private investors with a lot of money and who knows maybe Mr SpaceX and Mr Amazon are also involved.
It's like a cabal. (Private political group) But for cryptocurrency.
So when this rally happens of course other people buy into the ETF like your average Joe. Hoping to profit.
What happens?
The ETF goes higher in value which means Bitcoin goes a lot higher in value. Maybe it will go up to 125,000 this time? Or maybe it will go up to 130,000 this time before going down?
What's the point?
The point is they are going to be selling that 1.7 billion dollar surplus because they only had 1.45 billion that they were going to put in.
That 1.7 billion dollar surplus that got the rally going and when it's time to sell could possibly be worth 7% to 8.5% more. Plus they're all putting in their own money into it because it's like insider trading. When you're putting your money into a stock as an institutional investor of course you're going to put your own money into it too so these people are putting 50 million dollars by themselves, 500 million by themselves. Who knows?
So surplus of 1.7 billion + 7% is now worth 1.819 billion or a gain of 119,000,000 million dollars. So they sell and they make $119 million for their company. Plus how much do they make for themselves and all of their cohorts that they are in contact with?
Insider trading at its finest.
This happens with all companies. Take for instance an airline. Companies know that maybe airlines will go up in the summer. Or they know that it will go up in the travel season for the holidays Thanksgiving and Christmas. So all the different companies they get in touch with each other and they say hey we're going to buy $5 billion of airline one and then the other company tells them okay we're going to buy 2 billion of airline one. Of course again they're all putting in their own money as well.
The Bitcoin rally is not over. We may see as high as 138,000 this rally. Before the bear market hits.
Some say we could see 420,000. I'm not sure about that I wonder if that's for the next rally in 2028 after the halving?
Will you take a leap of faith and do the right thing for humanity and leave a comment under this post with what your opinion is?

ETH, BTC, DXY & USDT.D cross market breakdownEverything explained in the video. Please let me know if there was anything I may have missed!

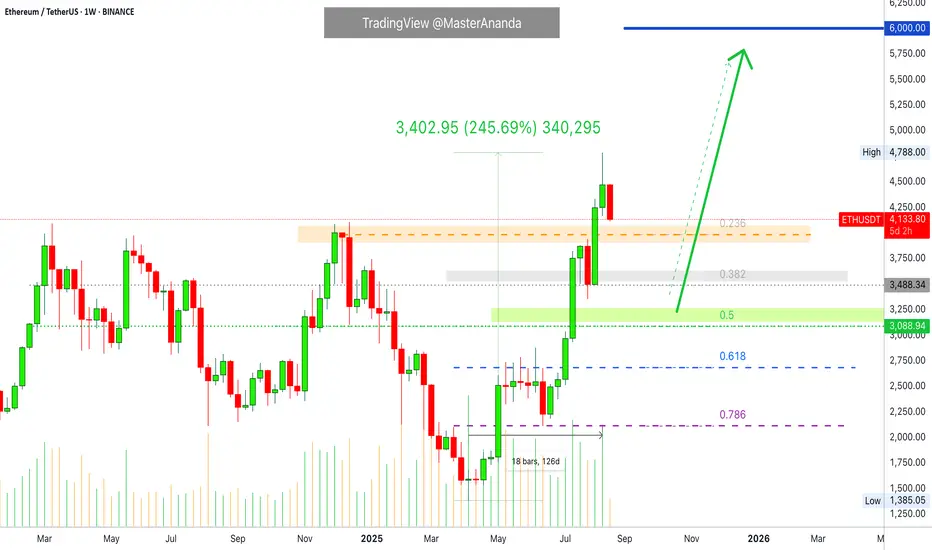
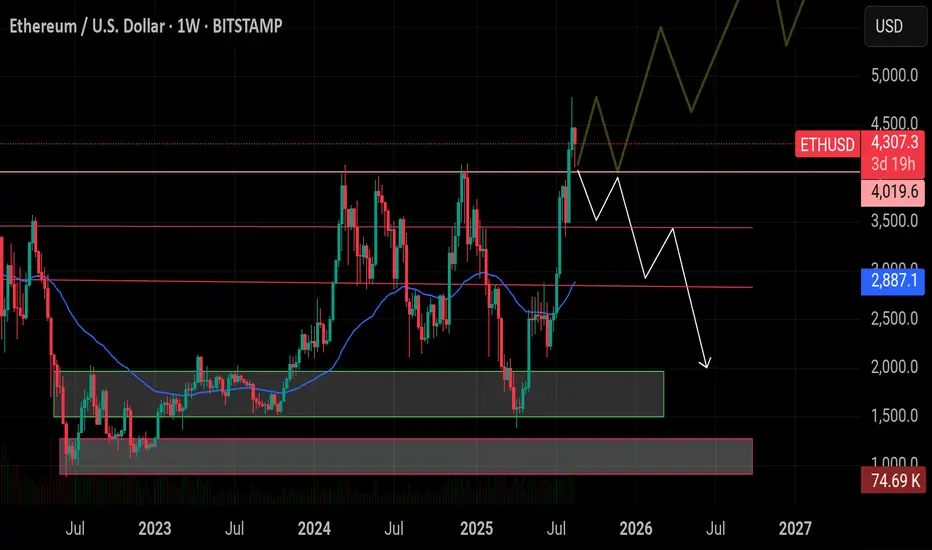
Ethereum: What About Support? $3,000 Next? Watch!Ethereum grew a massive 245% from its 7-April 2025 low and market bottom. The last low pre-2025 bull market. And we are here and this chart is awesome because there is no doubt where we are in this market cycle. We know the market is experiencing growth, Ether is growing, and we know this is only the start.
After strong growth, there is always a correction.
The market tends to seek balance.
ETHUSDT growing straight up for 126 days, four months. 245% total rise.
Where are the support levels?
A strong rise within a bull market is followed by: a mild correction or a strong correction? A long-term multiple months long correction or a two weeks long correction?
Let me help you answer those questions.
Four months will never allow for a correction lasting 3-4 months. This is out of the question. Normally a correction deletes only a portion of the previous move and it tends to last a portion of the previous move.
The equivalent to 0.618 and 0.786 was already consolidated back in May and June. This means that this level does not need to be tested or if it is tested, in an extreme case, then it is likely to hold. Why? Because Ether stopped at this point for more than a month creating a baseline.
The 0.236 Fib. retracement, around $3,900, was not consolidated so this level goes bust as support, on the first try. There wasn't any action around this level on the way up, there won't be any on the way down. So we know Ether to move lower on this drop.
The next level is 0.382 Fib. and this is a strong level. Retraces and corrections within a bull market can easily end here. This is a price of $3,485. There is support around this level as it was consolidated for two weeks before the last high. This level has potential to hold because Ethereum is very strong right now and this zone is below the March, May and December 2024 peaks.
The last level is the 0.5 Fib. retracement. This is another strong support and it tends to stop corrections on its track on a strong bull market. This level can be easily tested. If it is tested, the action isn't likely to last long at these low pries. We are talking about $3,100.
Again, the range between $2,100 and $2,700 is the 0.786-0.618 Fib. retracement and this is a dream buy zone right now and very unlikely that such an opportunity will open up. If it does open, this time, will you buy? Buy when prices are low. Sell at resistance, buy at support.
Ethereum is going down. It is still too early to say how long this correction will go for. Just keep in mind that a retrace can last 1-3 weeks while a correction can last 1-3 months. Both scenarios are possible. Regardless of what the market decides, the bull market is not over, we will see additional growth.
Ethereum will continue growing to hit a new all-time high and beyond.
Namaste.