Ethereum Price Stuck Below $4,000 as LTHs Apply Selling PressureEthereum’s price trades at $3,846 at press time, slipping below the $3,872 support level. The altcoin king has remained stuck under $4,000 for nearly a week, reflecting fading momentum and tightening volatility in the broader crypto market.
Given the prevailing selling pressure and weak inflows, Ethereum’s price could fall further toward the $3,742 support zone. If this level fails to hold, a deeper correction could follow, pushing ETH down to $3,489. Such a decline would reinforce the current bearish outlook.
However, if Ethereum holders curb their selling and demand strengthens, ETH could rebound above $4,000. A decisive break of this resistance could lift prices toward $4,221, signaling renewed optimism and invalidating the prevailing bearish setup.
Ethlong

ETHUSD Is showing a great buy opportunity - low risk high rewardETHER - ETH/USD experienced a big drop to the downside like most other cryptocurrencies... but it nows has very clear signs of a major bullish movement ahead. There is currently a head and shoulders pattern forming which has given us high confidence that it will head to the upside. BUY NOW!

Ethereum — Losing the PremiumThe Ethereum future’s chart is showing weakness, and I’m expecting a drop toward the $3,760 area from current levels.
Scenario invalidation — the zone is marked on the chart at $4,041

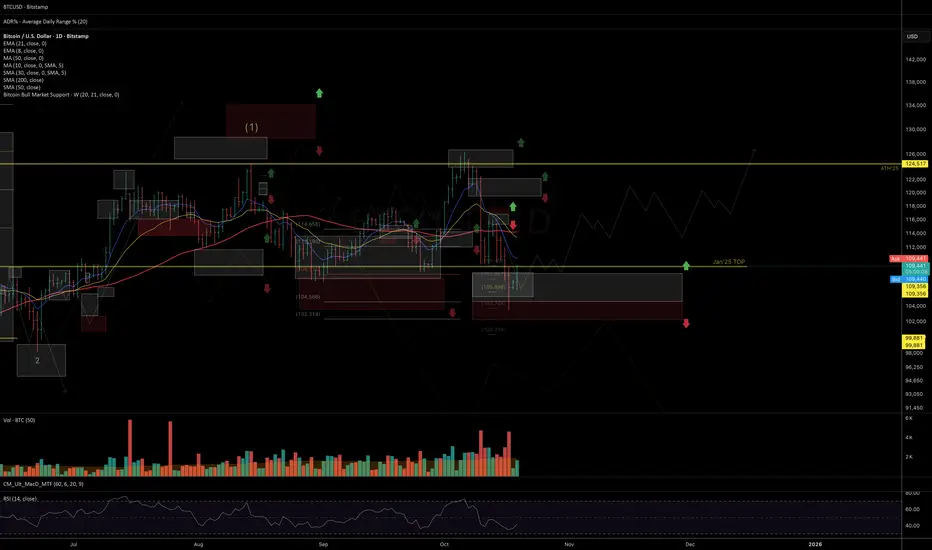
Ethereum’s Hidden Fractal Points to $33K by November 2026Most of the space seems to think that the bull market is officially over, that the four-year cycle has come to a close. For most of the cycle, I have thought that way too. 1,064 days is up, and that’s the longest a Bitcoin cycle has ever gone for. So, the idea that the same thing will play out again is very valid, and it’s entirely possible that it is indeed the end. However, my stance is very different — I still think we have one year left in the tank, and I will present a lot of evidence to support why I believe this and why I’m sticking to it.
If you’ve been following me for a while, you know that we’ve found some very interesting bar patterns in history that keep on repeating, and this will be the primary source of evidence used in my thesis.
Bar Pattern Fractals
I have tested hundreds of indicators over the last six years and bought thousands of dollars’ worth of indicators, and in the end, the highest success rate has come from simply following bar pattern fractals. They repeat over and over. They are hard to find, but once you do, you can ride them for months.
ETH 2017 Fractal
What you see above is a fractal I have been following for months now. It has been mirroring the 2017 cycle, with some parts nearly identical in movement and timing, with only a few small deviations here and there. The macro pattern continues to play out like clockwork.
Take a look at this TA from March 2025. We caught near the bottom, called for max pain, and discussed this fractal that could be playing out. The ETH call was under 2000 back then.
I also published TAs on Chainlink and its repeating bar patterns. It was straightforward for catching big macro moves for LINK.
As you can see, these are just two examples of many fractals I’m following. The main one is ETH because it’s been a 1:1 mirror for the most part. The last spike down was a deviation for sure — well, at first I thought it was on the Bitstamp chart because it has the most historical data for ETH, but when I switched to the Binance chart, I found something very interesting.
A view of the bar pattern fractal is telling us where we are.
When switching to the Binance chart, we see a very interesting wick of 26% that nuked the market during that time — very similar to what Binance has done this time around. You cannot make this stuff up. So at first, I thought it was a small deviation, but in fact, after looking at this chart, it’s still a mirror, even including that huge scam wick of 27%. Amazing.
So as you can see, in terms of the bar pattern fractal, I simply cannot ignore the fact that this keeps mirroring, and if it continues, it’s possible that we have one more year left in this bull market, and that this four-year cycle thesis is, in fact, a massive bear trap.
If we take a look at the monthly candle that shook a lot of players out last cycle before the run-up, we can see that we printed a candle with wicks on both ends — very similar to what we are forming right now.
If we zoom into that moment on a smaller timeframe, you can now see the moves are similar — a big drop into a double bottom followed by a slow grind up. This is how ETH normally puts in bottoms.
Looking at ETH’s RSI levels on the monthly chart — during the first cycle, when it broke the all-time high, RSI was extremely overbought at 87. On the last cycle, it was 82. This cycle, ETH is at an all-time high and the RSI is only 59. We’re not even in the overbought range yet — there’s so much room for ETH to expand, it’s crazy.
Since its inception, ETH has always pulled off the same move: one very aggressive wave with an aggressive pullback, followed by one smaller wave that creates a higher high to finish off the cycle. It’s done this every time.
Which means that if the bar pattern fractal continues to mirror, then wave 1 tops in the first week of January 2026, followed by a massive correction that will again fool everyone into thinking the four-year cycle is 100% over. But what if ETH puts in a bottom in February 2026 and rallies back up to all-time highs? Nobody would believe it — the disbelief would be strong because everyone would have sold the top in Q4 2025 due to the four-year cycle theory.
The second major piece of evidence I’m leaning on is the Russell 2000. Since its inception, the Russell 2000 has done the exact same thing before expansion comes:
Double top
Second drop bear trap
V-shaped recovery back to all-time high
Expansion breakout
Same thing every time. Look at the chart and tell me we’re not going into expansion — there’s a very high chance. The last two times, we got that massive monthly candle breakout in November.
Which brings me to the main point — every time the Russell goes into expansion, Bitcoin has started its most aggressive run. The last three times, Bitcoin went on to break its all-time high and put in a cycle top within an average of 355 days.
Gold, shown above, is so close to the 4.236 extension right now that it would be crazy to buy here. There’s a high chance of a major top coming in, and we’re about to see a major rotation back into Bitcoin with those gains.
Just take a look at the Power of Law model for Bitcoin — the bull market hasn’t even started yet.
It’s crazy that people are calling the cycle top with the Mayer Multiple sitting at 1.19.
Conclusion
My view is that there is one more year left in this uptrend in crypto. Bitcoin has turned into a different beast. It has completely detached itself from the rest of crypto for the most part, but the first expansion is coming in 2026. If the bar pattern does not deviate, then greatness lies ahead.

Ethusdt - dragon longIf you like the idea, please put a ‘like’. It's the best ‘Thank you!’ 😊 P.S. Always do your own analysis before a trade. Set a stop loss. Capture profits in instalments. Withdraw profits in fiat and make yourself and your friends happy.

Weekly Review on #BTC and #ETHThe market continues to move within the framework of the main hypothesis — a potential completion of the correction from historical highs and the early signs of a possible trend reversal, as discussed in my recent market review:
As long as #BTC maintains weekly closes above 102K, the base scenario (both for #BTC and #ETH) remains unchanged — gradual recovery, consolidation, and a move toward new highs. I wouldn’t rule out the possibility that this could happen even before year-end.
However, a weekly close below 102K would signal an increased probability that the four-year macro growth cycle has ended and the market could be transitioning into a macro corrective phase across the crypto sphere.
Updated key levels and charts:
BITSTAMP:BTCUSD
Support: 106K | Resistance: 110–112K
Chart:
BITSTAMP:ETHUSD
Support: 3680 | Resistance: 4360
Chart:
Thank you for your attention, and I wish you a productive start to the week and successful trading decisions ahead!
ETHEREUM HIGH PROBABILITY SETUP SOON!!! 🚨 ETHER HIGH PROBABILITY BUY SETUP 🚨
* Here We Can See Clearly The Next Potential Moves For ETHUSD Coming Hours/Days.
* Keep Your Eyes Close On Your Trading Positions.
* Happy PIP Hunting Traders.
FXKILLA.

$ETH UPDATE: #Ethereum’s weekly candle is about to close below CRYPTOCAP:ETH UPDATE:
#Ethereum’s weekly candle is about to close below the $4,000 support, confirming the bearish outlook. As mentioned before, my stance remains bearish and you can see the same sentiment in my recent Bitcoin analysis as well.
The key support zone for ETH now sits between $3,500 and $3,300, around the 1W 50 EMA. If price fails to hold this area, the next downside targets will be $3,000 and $2,800. I’ll also be updating the Bitcoin weekly chart later today (Sunday) to track how both charts align in this bearish setup.

DMTR/USDT - ABSOLUTE GEM!! x50 MINIMUMTargeting the 0.003/35 area! Strong bounce and strength since last weeks crash - Real giant in RWA and AI sectors proven tech and innovation - BUYING ANY FURTHER DIPS BUT CONFIDENT OF UPWARDS PRICE - DONT SLEEP ON DMTR OVER THE NEXT 12months!! SEND ITTTT

ETH Long into Q4📈 Ethereum / USD (1W) – Macro Outlook
Ethereum is consolidating after a strong rally, currently finding support near the 0.382–0.618 Fibonacci retracement zone — a historically key area for continuation setups.
If this structure holds, ETH could be gearing up for its next macro leg, with potential upside targets aligning around:
⚪ Very Likely: ~$6,400
🔵 Likely: ~$7,800
Key Support Levels to watch:
$3,850 → short-term support
$3,220 → major retracement support
As long as ETH maintains higher lows above the 0.618 region, the macro bullish structure remains intact — indicating that Ethereum may just be cooling off before its next impulse.
🚀 Macro trend still favors continuation, but short-term volatility remains high.
#Ethereum #ETH #Crypto #TechnicalAnalysis #ETHUSD #Altcoins #CryptoTrading

ETHBTC Rally into Q4📊 Ethereum vs Bitcoin (ETH/BTC) – Weekly Chart Update
ETH/BTC has officially broken out of its long-term downtrend (yellow trendline) that’s been in play since 2022. After the breakout, price is now retesting the previous resistance area — a classic move before potential continuation.
🔹 Key Levels to Watch:
Resistance Zone: 0.059–0.063 BTC (Fibonacci 1.272–1.414 extension zone, highlighted in yellow)
Major Target: 0.067 BTC (Fib 1.618)
Support: 0.033–0.035 BTC
Long-term support: 0.024 BTC
A successful hold above the breakout zone could confirm a trend reversal in favor of Ethereum dominance. A rejection, however, might lead to another leg down before accumulation.
🚀 Will ETH finally regain strength vs BTC, or is this just a relief rally?
#ETHBTC #Ethereum #Bitcoin #CryptoTrading #TechnicalAnalysis #AltcoinSeason #CryptoChart

Next Stop: 8K? Ethereum’s Big Breakout LoadingEthereum has been building a clean bullish structure for years and right now it’s standing right at the edge of a major breakout.
If ETH manages to hold above the 4K zone, the 6K–8K targets are just the beginning.
Above that, we enter the FOMO Zone, and a move toward 13K is totally on the table.
As long as price stays above 2.75K, the bullish structure remains solid.

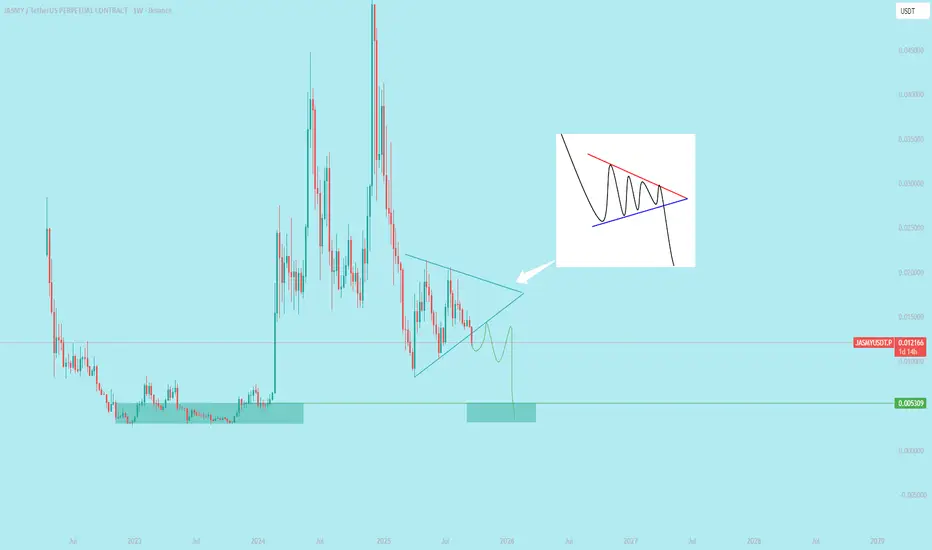
$JASMY Breakdown Bearish Symmetrical Triangle in 1W
`A bearish symmetrical triangle is a continuation pattern in technical analysis that forms during a downtrend. It signals a period of market consolidation where neither buyers nor sellers have a clear advantage, suggesting a potential continuation of the prevailing downward trend once the pattern is completed.` @everyone
Ethereum Falls Below $4,000—But A Price Rebound Could Be NearEthereum’s price currently sits at $3,727, having fallen from $4,000 in the past 48 hours. However, technical indicators suggest that the altcoin may soon see a reversal, with investors preparing to defend key support levels.
If Ethereum bounces off the $3,742 support line, it could climb back toward $4,000. A successful breach of that barrier would likely push ETH higher, targeting the $4,221 level once again. This movement would align with historical recovery trends seen after periods of capitulation.
Still, a failure by investors to sustain momentum could trigger a deeper correction. Should the market sentiment turn bearish, Ethereum may decline toward $3,489. A drop below this level would invalidate the short-term bullish outlook, delaying any potential rebound.

$ETH will be $6,000 by ChristmasEveryone on CT has had enough, they’re calling for a bear market, that’s exactly when things erupt. There’s euphoria with gold right now, that’s exactly will probably end bad for those who buy the top, the rotation will be into ETH pushing it to ath and then alts erupt. Believe in something

ETH - Potential Bullish Reversal towards PDHETHUSD – Potential Bullish Reversal Scenario 🐂
We’ve observed a strong bullish reaction following a sweep of the previous day’s low (PDL) within our identified Point of Interest (POI), aligned with a 1-hour Bullish Imbalance (BISI).
This reaction suggests a possible shift in market structure, and we are now anticipating a reversal to the upside, potentially targeting resting sell-side liquidity. There is also a chance we may see a Symmetrical Movement Theory (SMT) divergence forming relative to BTC, which could further validate bullish intent.
From my perspective, the liquidity engineered below the recent sweep presents a strategic area where institutional participants may look to accumulate long positions for a more sustained move upward.
We also have favorable draw on liquidity (DOL) to the buy side, including the previous day’s high (PDH) and visible engineered liquidity levels above.
Let’s now monitor price action following this bullish reaction to assess whether confirmation for a higher move develops.

2025 BTC TOP > ETH PUSHIf BTC tops and sets its first lower high around $119K and tags the 0.702 level, it could confirm the top. If ETH experiences extreme price appreciation into that move, it would validate the capital rotation, and once this move starts it could be over in 30 to 90 days. See my last post for this dynamic playing out during the last cycle.

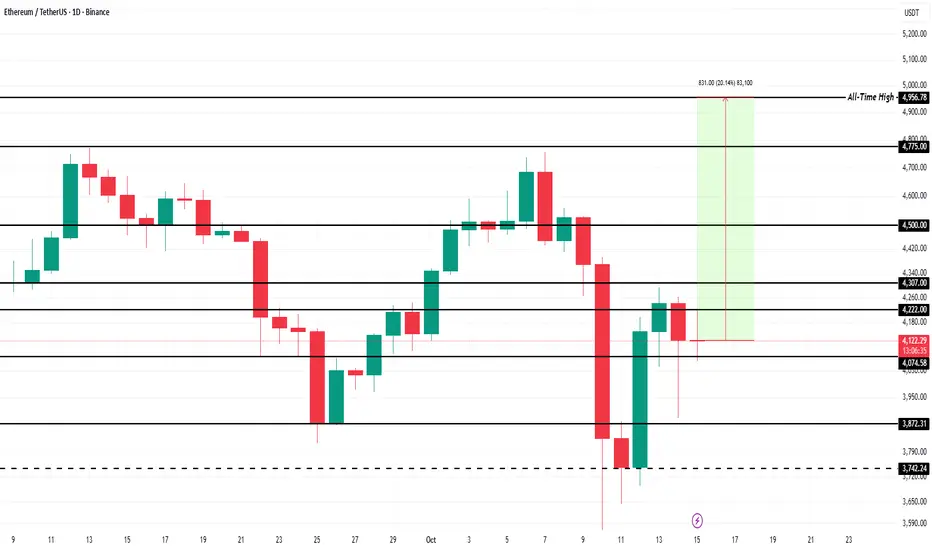
ETHUSD – Demand Zone Reaction | Bullish Reversal Expected BITSTAMP:ETHUSD
Market Overview
ETHUSD has been consolidating under a descending trendline while repeatedly respecting the key demand zone.
This area has historically absorbed heavy selling pressure, indicating institutional buy orders building up.
If price breaks above minor internal resistance (around 4,050), the breakout could confirm a new bullish leg targeting upper liquidity zones.
Key Scenarios
✅ Bullish Case 🚀 → 🎯 Target 1 4,080 | 🎯 Target 2 4,150 | 🎯 Target 3 4,210
❌ Bearish Case 📉 → Close below 3,920 could extend decline toward 3,860
Current Levels to Watch
Resistance 🔴 4,080 – 4,150
Support 🟢 3,940 – 3,920
⚠️ Disclaimer: This analysis is for educational purposes only. Not financial advice.

Ethereum’s Path to $5,000 Likely Blocked by LTH ActionsEthereum is currently priced at $4,147, trading just below the key $4,222 resistance level. A successful breach of this barrier could enable ETH to climb toward $4,500. This would attract stronger inflows from institutional and retail investors alike.
If accumulation strengthens and confidence returns, Ethereum could advance toward $4,956 — its previous all-time high — and potentially touch $5,000. This would represent a decisive signal of market recovery and renewed bullish momentum.
However, if bearish sentiment grows or long-term holders continue offloading their holdings, Ethereum could slip below $4,000. A deeper correction could pull the price down to $3,872 or lower, invalidating the bullish thesis and signaling renewed selling pressure in the market.
ETH - MONTHLY DOJI - UPDATE:#ETH - price analysis: Tricky times Ahdea? 📊
Global Structure (Long-Term View):
🔸The chart remains bullish above the $ 3,180 level (monthly view). 📈
🔸That said, prices are stuck under a potential double-top ATH resistance at 4,800– 4,950. ⚠️
🔸Monthly High: $ 4,755
🔸Monthly Low: $ 3,435
🔸Current price is showing a Doji candle on both monthly and weekly charts, sitting exactly in the middle range from low to high. Neutral vibes for now! 🤔
Daily View:
Price is holding above the previous key resistance zone of 3,700 - 3,750.
Upper Key Resistances to Watch:
$ 4,300 - $ 4,540 - $ 4,75 - $ 4,950
What to Expect (Medium-Term Outlook):
We're in a sideways phase within the yellow zone: 4,250– 3,700, until a real breakout happens.
If bulls keep consolidating above $ 3,180, an upward move seems likely.
Tricky moment-there's literally no clear long-term or medium-term direction right now.
I've highlighted key levels and possible setups in my charts below. #DYOR
In case of a bad market event and bearish breakout, 2,850 and 2,500 could act as key bottoms.
My Take: This feels like a consolidation trap, bulls or bears, who's winning?
Share your thoughts below!
Bullish rebound or more downside? 👇
Key levels, yellow zone, and Doji highlights in my charts.

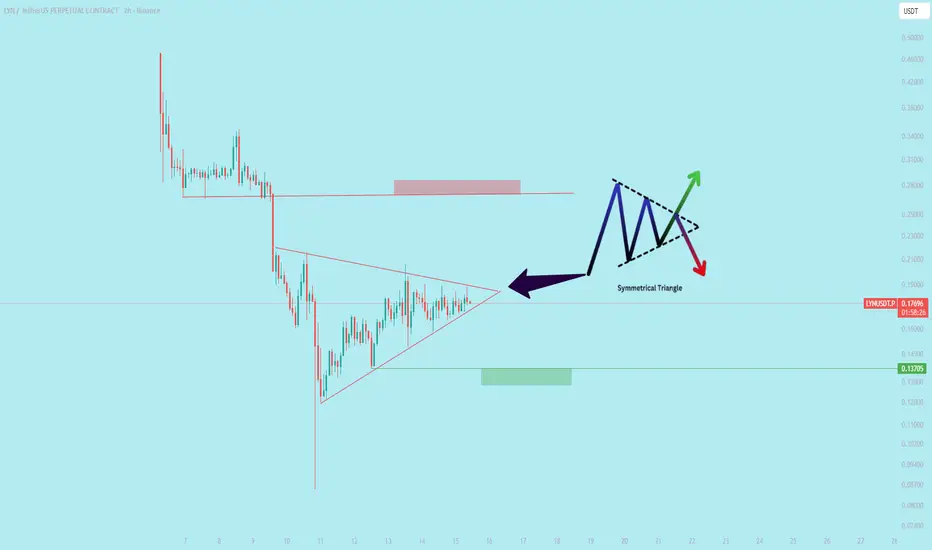
$LYN Performing a symmetrical triangle**$LYN** **Performing a symmetrical triangle** `symmetrical triangle is a chart pattern formed by two converging trendlines that connect a series of lower highs and higher lows. It represents a period of market consolidation and indecision, with neither buyers nor sellers having a clear advantage. The price range narrows as it moves toward the triangle's apex, or point of convergence.`
#ETH/USDT
#ETH
The price is moving within a descending channel on the 1-hour frame, adhering well to it, and is heading for a strong breakout and retest.
We have a bearish trend on the RSI indicator that is about to be broken and retested, which supports the upward move.
There is a major support area in green at 3900, which represents a strong support point.
We are heading for consolidation above the 100 moving average.
Entry price: 4156
First target: 4274
Second target: 4405
Third target: 4583
Don't forget a simple matter: capital management.

#ETH/USDT the Final Push Before the Parabolic Run!#ETH
The price is moving within a descending channel on the 1-hour frame, adhering well to it, and is heading for a strong breakout and retest.
We have a bearish trend on the RSI indicator that is about to be broken and retested, which supports the upward move.
There is a major support area in green at 3900, which represents a strong support point.
We are heading for consolidation above the 100 moving average.
Entry price: 4156
First target: 4274
Second target: 4405
Third target: 4583
Don't forget a simple matter: capital management.
When you reach the first target, save some money and then change your stop-loss order to an entry order.
For inquiries, please leave a comment.
Thank you.
