The Fed Meeting and Its Further Play in EthereumCRYPTOCAP:ETH has returned to the trendline. Even if there another short-term drop, thats just part of the futures game - it can't happen without it.
Ahead of the Fed meeting, the market will likely move upward, so that no one can buy cheap after a positive decision on lowering the key rate.
Looking at the recent candles, enough longs have been closed to allow growth without abuse.
Funding across all exchanges has stabilized.
CRYPTOCAP:ETH outflows are starting to exceed inflows.
There nothing to look for down below - everything points to growth.
If it’s not too much trouble, support the post. Wishing you all the best!
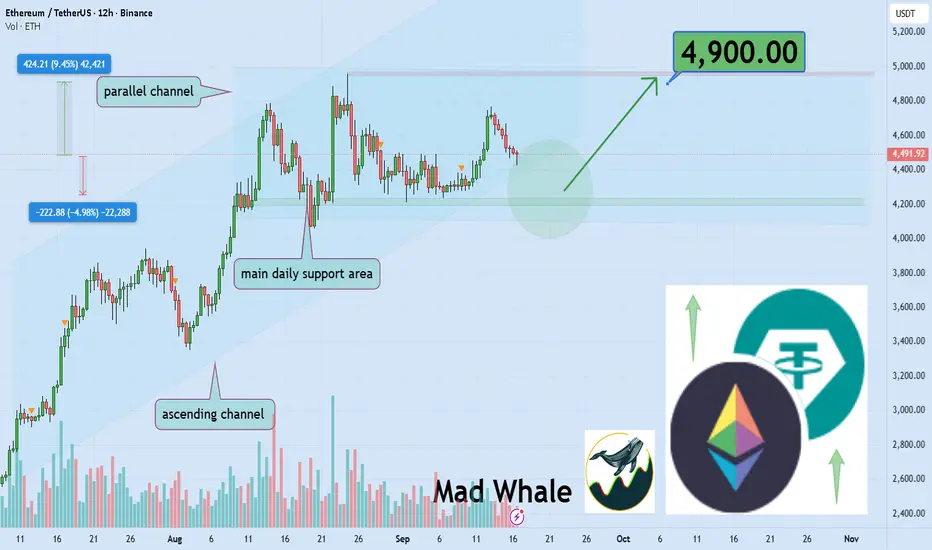
Ethreum

The real reason 80% fail to achieve consistent profit?!Why do most traders never achieve consistent profit in crypto?
The problem isn’t strategy, it’s mindset and behavior.
This analysis reveals where hidden mental traps actually lie.
Hello✌️
Spend 2 minutes ⏰ reading this educational material.
🎯 Analytical Insight on Ethereum:
Ethereum is testing the lower boundary of its bullish channel and key daily support 📉.
If this level holds, a potential 9% upside could target $4,900 🚀.
Now , let's dive into the educational section,
🚀 The cycle of trader failure
Most people enter the market chasing fast wealth.
The first thing they face is extreme volatility.
Fear and greed quickly consume every decision they make.
😱 Fear of losing
When the market dips, many freeze in panic.
Instead of seeing opportunity, they only see growing losses.
Early exits destroy potential profits before they can grow.
💸 Endless greed
In bullish trends, people believe the sky has no limit.
They buy recklessly, forgetting risk management completely.
The result? Getting trapped at the top and facing heavy losses.
🧠 The mindset problem
The truth is technical knowledge alone isn’t enough.
Without mental control, even the best tools are useless.
The market is, above all, a mirror of psychology.
📊 Beginner vs professional
Beginners chase quick wins, professionals chase survival.
One focuses on moments, the other on long-term trends.
This simple difference separates winners from losers.
🎯 The crowd’s blind spot
Most traders trust the collective sentiment of the masses.
But when everyone is fearful or greedy, the trend often flips.
That’s when whales extract maximum profit.
🛑 Lack of strategy
Many don’t even have a basic risk plan.
No stop loss, no position sizing, just gambling.
Inevitably, this leads to a blown account.
🔍 The importance of broader vision
Focusing on one candle or one signal is a trap.
Different timeframes tell completely different stories.
Only with a wide perspective can you read the market.
🛠 Useful TradingView tools
To overcome these challenges, TradingView offers tools that clarify your mindset:
Fear & Greed Index: measures collective psychology of the market.
RSI Indicator: detects overbought and oversold conditions.
Volume analysis: shows real capital inflows and outflows.
Smart alerts: let your actions be data-driven, not emotion-driven.
Support and resistance mapping: builds a solid trading plan.
Each tool becomes powerful only when combined with discipline and mental control.
📌 Conclusion
Most traders fail to achieve consistent profit because they’re trapped by fear, greed, and lack of structure. The path to survival lies in mastering psychology and using tools with discipline.
💡 Three golden recommendations
Always define your exit and stop loss before entering.
Enter trades only when your mind is calm, not emotional.
Consistency comes from daily discipline, not from chasing one lucky setup.
✨ Need a little love!
We pour love into every post your support keeps us inspired! 💛 Don’t be shy, we’d love to hear from you on comments. Big thanks , Mad Whale 🐋
📜Please make sure to do your own research before investing, and review the disclaimer provided at the end of each post.
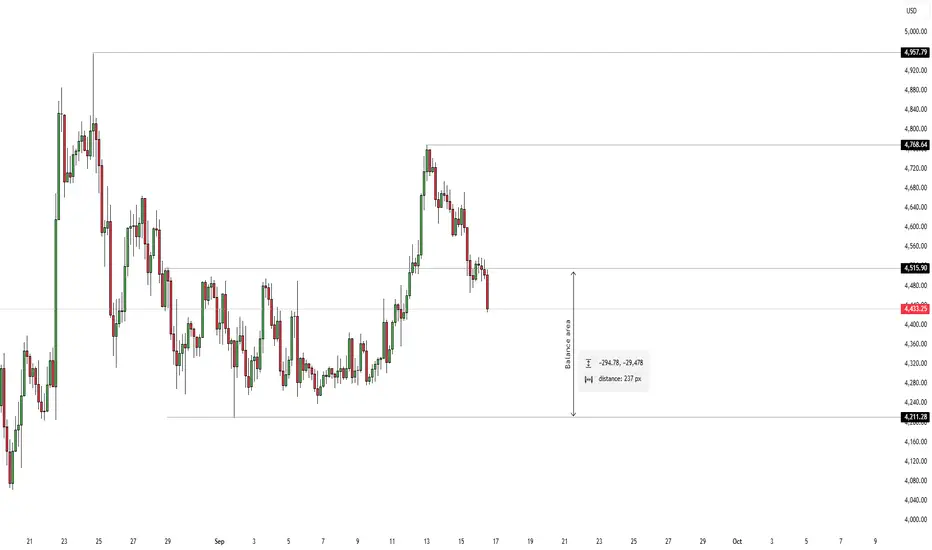
ETHUSD 4H HOURLY PROJECTION AND IDEA.The second in command in the crypto market is Eth, just broke a structure back into a previous Balance Area, which may mean price could be static for sometime and the Pair takes its lead and direction from its Head BTC, which is also on a downward move, but the overall direction of the market is Bullish, and currently price is within a previous range i expect price to stay within this range (Balance) lets see what price would do next.
ETHUSDT.PHello friends
Given the good growth we had, the price has made a 14% correction. If the specified support is maintained, the price can see the specified targets. If the support is broken, the price can fall by another step. We have identified important support points for you.
*Trade safely with us*

#ETH/USDT Testing Wedge Breakout Amid Key Support#ETH
The price is moving within a descending channel on the 1-hour frame, adhering well to it, and is heading for a strong breakout and retest.
We have a bearish trend on the RSI indicator that is about to be broken and retested, which supports the upward move.
There is a major support area in green at 4480, which represents a strong support point.
For inquiries, please leave a comment.
We are in a consolidation trend above the 100 Moving Average.
Entry price: 4524
First target: 4585
Second target: 4645
Third target: 4715
Don't forget a simple matter: capital management.
When you reach the first target, save some money and then change your stop-loss order to an entry order.
For inquiries, please leave a comment.
Thank you.

ETH *UPDATE*Hello friends
Given the channel breakdown and the entry of buyers, it now seems that the price is in a pullback. In this case, the price pivots of the channel, which are now becoming supported, are expected to be good support and cause the price to grow and move with it to the specified targets.
*Trade safely with us*

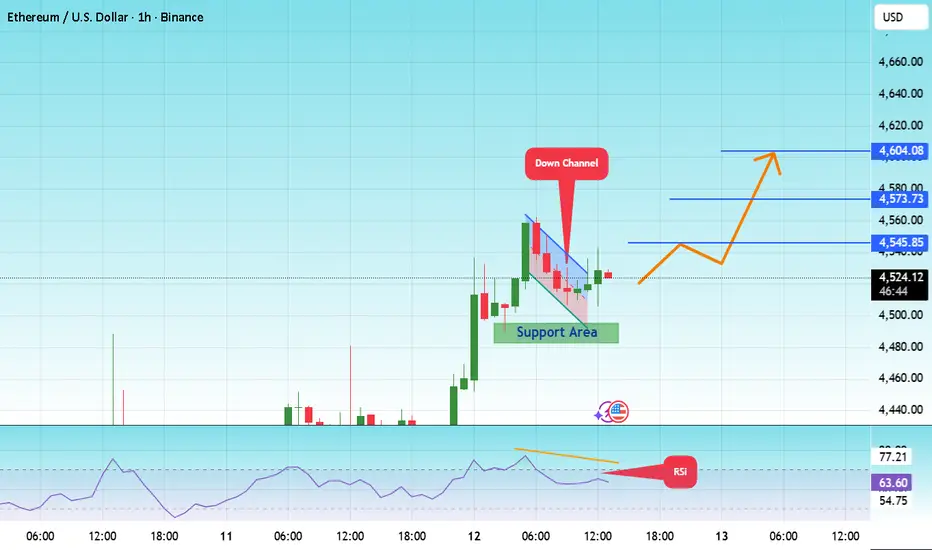
#ETH/USDT –> Falling Wedge Breakout Within Ascending Channel#ETH
The price is moving within a descending channel on the 1-hour frame and is expected to break and continue upward.
We have a trend to stabilize above the 100 moving average once again.
We have a downtrend on the RSI indicator that supports the upward move with a breakout.
We have a support area at the lower boundary of the channel at 4500, acting as strong support from which the price can rebound.
We have a major support area in green that pushed the price upward at 4485.
Entry price: 4525
First target: 4545
Second target: 4573
Third target: 4604
To manage risk, don't forget stop loss and capital management.
When you reach the first target, save some profits and then change your stop order to an entry order.
For inquiries, please comment.
Thank you.
$EPTUSDT Ready for the Next Leg Up$EPT finally broke out of its long accumulation zone.
If it can hold above that grey support area, buyers look set to drive the next big move upward.
DYOR, NFA

ETH/USDT 15m – Breakout Above $4,600/- Whats Next For #ETH ?🚀 ETH just broke out of the $4,600 zone, holding strong above the EMA200.
Fresh Fair Value Gaps (FVG) and demand zones are supporting momentum, with bulls now eyeing $4,700–$4,800 next.
🔎 Market Structure
EMA200 trend remains bullish on 15m.
Breakout from the $4,520–$4,560 consolidation.
Liquidity above $4,600 cleared → momentum intact.
📍 Key Levels
Support 1: $4,535 (intraday demand / FVG retest)
Support 2: $4,480–$4,520 (previous base)
Deep Bullish FVG: $4,360–$4,400
Resistance 1: $4,700–$4,720
Resistance 2: $4,800–$4,850
📈 Trade Plan (FVG Strategy)
Entry Zone: $4,606 – $4,620
Stop Loss: $4,585
Targets:
TP1: $4,700
TP2: $4,760
TP3: $4,800+
✅ Outlook
As long as $4,535 holds, dips into FVG/demand zones remain buy opportunities.
A clean break above $4,700 could accelerate momentum to $4,800–$4,850.
⚠️ Breakdown below $4,535 would weaken structure and open downside to $4,480 / $4,360.
💡 Not financial advice. Educational purposes only. Manage risk carefully.
📢 What’s Your Take?
Do you think ETH can hold $4,535 support and push toward $4,800?
Drop your thoughts below & hit follow for daily crypto setups 🚀
🔖 Hashtags
#ETHUSDT #ETH #Ethereum #Crypto #Altcoins #15m #Scalping #DayTrading #SwingTrading #EMA200 #FVG #PriceAction #TechnicalAnalysis

ETH USD SELL NOW 4510ETHUSD SELL @ 4510
ETHUSD – Bearish Setup at 4510 | Reversal Play
Ethereum has reached a key resistance zone near 4510, where price action shows signs of exhaustion and rejection. Momentum indicators are flashing bearish divergence, and volume is fading—setting up a clean short opportunity.
📌 Trade Parameters
- Entry: 4510
- Stop Loss: 4550 (above resistance wick)
- Take Profit: 4400 (near support zone)
- Risk/Reward Ratio: ~2.75:1
📊 Technical Confluence
- Bearish divergence on RSI
- MACD histogram fading after bullish impulse
- Rejection from upper trendline
- Volume drop on bullish candles
- Lower high structure forming on 1H chart
💬 Trade Narrative
ETHUSD has rallied into a resistance zone but failed to break above 4510 with strength. This setup targets a retracement toward 4400, with tight risk above 4550. If price breaks below 4475, expect acceleration toward the target. Setup remains valid unless bulls reclaim 4550+ with volume.
This trade favors short-term tactical execution, especially with BTC showing signs of consolidation and broader crypto sentiment cooling off.
📣 Trader’s Note:
Watch for confirmation on lower timeframes (15M/1H). If price breaks below 4475 with momentum, consider trailing stop or scaling in.

#boatkid looks like it’s about to fly#boatkid looks like a full correction and consolidation, it looks like it’s gonna fly.
Dyor and stay ready.

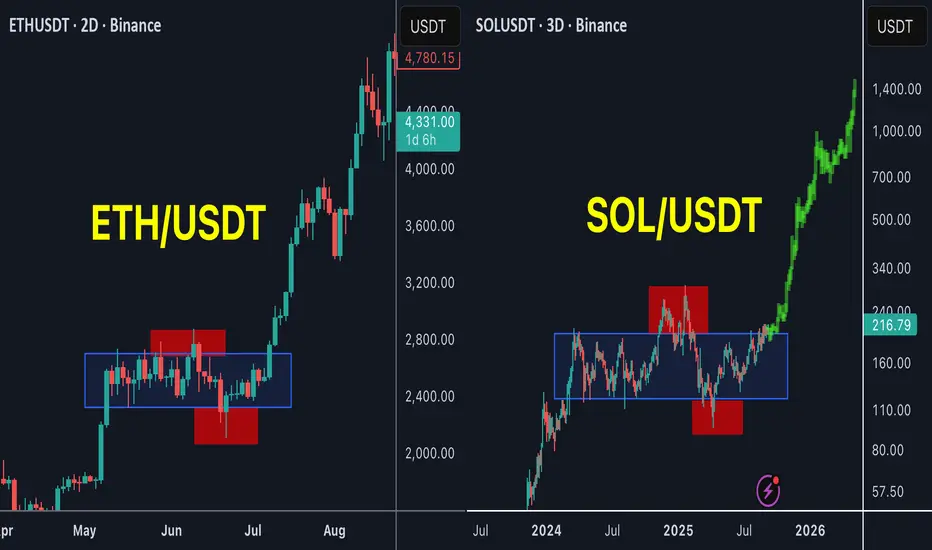
SOL is the next ETH !SOL / USDT
SOL is forming the same pattern as ETH before the huge breakout in past few weeks
Accumulation with 2 major stoploss hunt for bulls and bears and now is trying to breakout the accumulation zone
History show high success rate of this pattern
Will SOL be the next ETH ?
Best of wishes
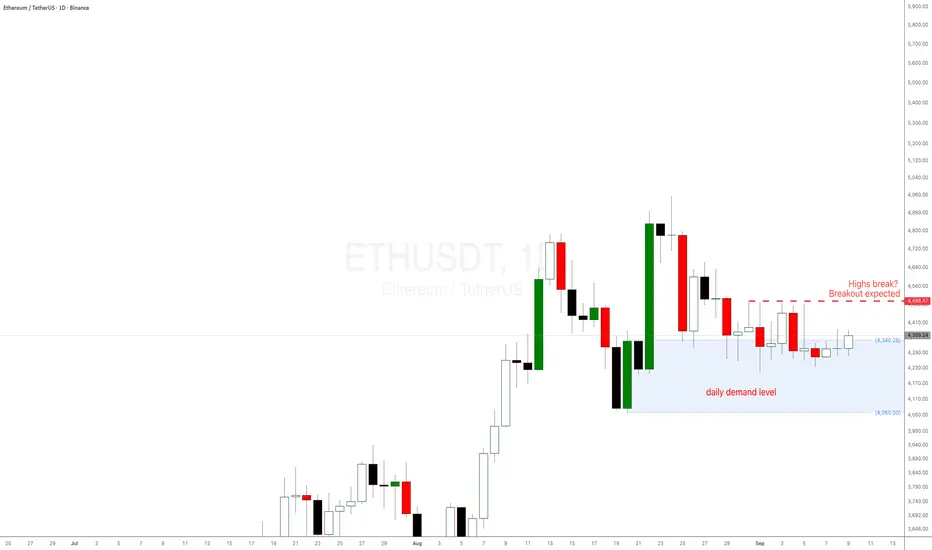
Ethereum ETH 2025 analysis and prediction daily demand levelEthereum ETH 2025 analysis and prediction as a reaction to the daily demand level at $4336. If the daily high in red is broken, a breakout is expected. ETH has been doing nothing for days, price action is not behaving as it usually does at these imbalances.
This is happening with Bitcoin BTC weekly demand level in control and playing out well. Refer to my BTC analysis in another trading idea.
#ETH/USDT towards upper levels#ETH
The price is moving within a descending channel on the 1-hour frame, adhering well to it, and is heading for a strong breakout and retest.
We have a bearish trend on the RSI indicator that is about to be broken and retested, which supports the upward breakout.
There is a major support area in green at 4260, which represents a strong support point.
For inquiries, please leave a comment.
We are in a consolidation trend above the 100 Moving Average.
Entry price: 4300
First target: 4333
Second target: 4378
Third target: 4427
Don't forget a simple matter: capital management.
When you reach the first target, save some money and then change your stop-loss order to an entry order.
For inquiries, please leave a comment.
Thank you.

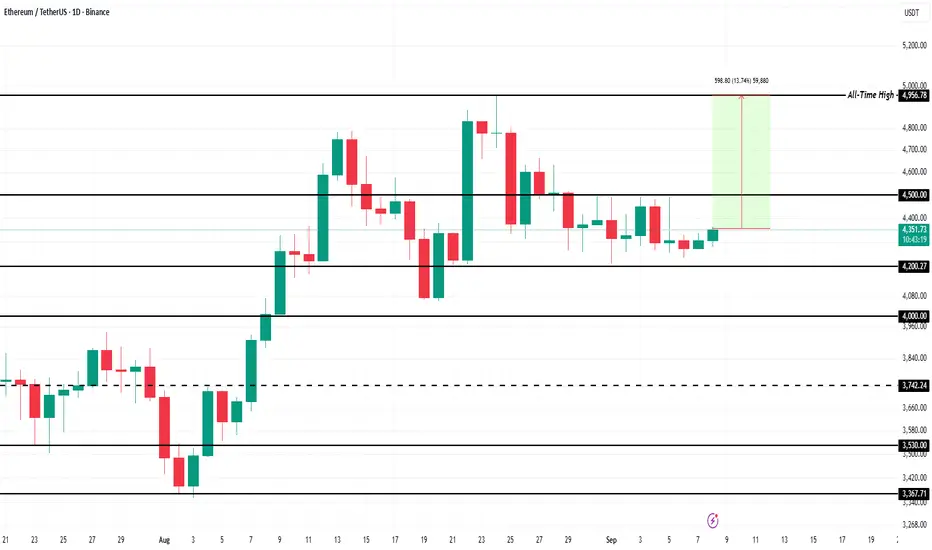
Ethereum Could Hit All-Time High in The First Week Of SeptemberEthereum’s price is currently at $4,315, showing limited movement after days of stagnation. The altcoin king continues to hover around the $4,331 support level, attempting to secure it as a foundation for a potential upward breakout in the near term.
The Chaikin Money Flow (CMF) indicates rising inflows, a positive signal for Ethereum’s momentum. If the indicator crosses above the zero line, it will confirm stronger inflows. This could push ETH past $4,331 and toward $4,500, reducing the gap to its $4,956 all-time high.
However, risks remain if investor sentiment weakens. Should selling pressure increase, Ethereum could struggle to maintain upward momentum. In this scenario, ETH might either consolidate sideways above $4,222 or fall through it, retesting $4,007 as support and invalidating the bullish thesis for the short term.
#ETH/USDT towards upper levels#ETH
The price is moving within a descending channel on the 30-minute frame, adhering well to it, and is heading for a strong breakout and retest.
We have a bearish trend on the RSI indicator that is about to be broken and retested, which supports the upward move.
There is a major support area in green at 4255, which represents a strong support point.
For inquiries, please leave a comment.
We are in a consolidation trend above the 100 Moving Average.
Entry price: 4295
First target: 4326
Second target: 4367
Third target: 4417.83
Don't forget a simple matter: capital management.
When you reach the first target, save some money and then change your stop-loss order to an entry order.
For inquiries, please leave a comment.
Thank you.

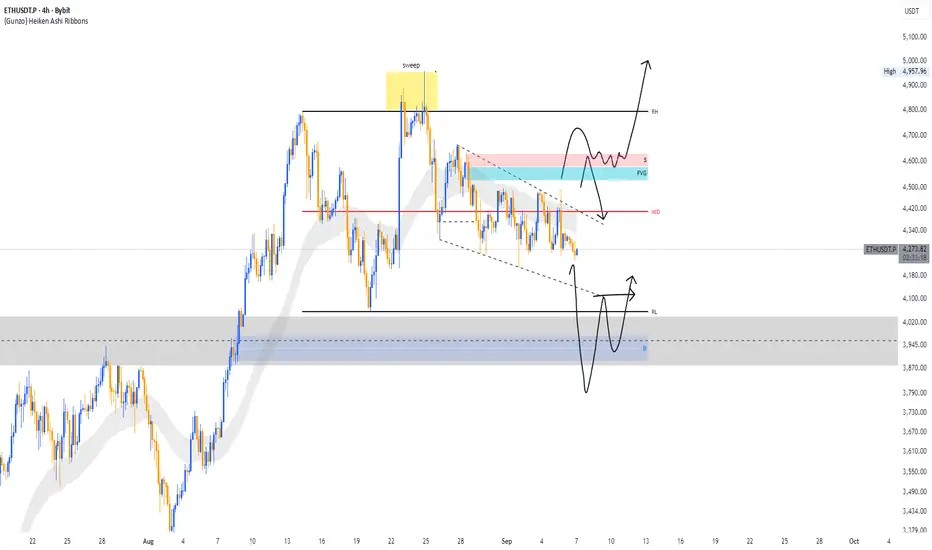
ETH/USDT 4H AnalysisEthereum is consolidating after a recent liquidity sweep near $4,950. Price is currently ranging between mid-level resistance ($4,420) and the demand zone around $3,950–$4,000.
Two possible scenarios in play:
🔹 Bullish Case: If ETH holds above $4,200 and clears the FVG + supply zone ($4,600–$4,700), we could see a strong continuation toward $5,000 psychological level.
🔹 Bearish Case: If current support fails, ETH may retest the grey demand zone ($3,900–$3,950) before any bullish recovery.
Key Levels to Watch:
Resistance: $4,420 / $4,700 / $5,000
Support: $4,200 / $3,950
⚠️ This analysis is for educational purposes only, not financial advice. Always trade with proper risk management.
💬 Do you think ETH will reclaim $5k next, or will we see a deeper correction first?
We got the first profit! Next is 10k. Who's with me? ^_^
We got our perfect entry and reached our TP. Now that big institutions and whales are showing interest in BINANCE:ETHUSDT reaching 10k is more likely once the captial starts moving to ETH.
I too, with the experts have a similar view on ETH's future performance!
Not gonna list out things y'all already know. Feel free to drop your idea even if contradicting.
Good luck!
#BTC #ETH #bullrun #technicalanalysis #crypto #fundamentalanalysis #priceaction
ETHUSD BUY 4350ETHUSD Long Setup – Eyeing Momentum Above 4350
📌 Entry: 4350
🛡️ Stop Loss: (Set based on your risk tolerance, e.g., below recent support)
🎯 Target: (Optional – define based on resistance zones or fib levels)
Ethereum is showing signs of strength after consolidating near a key support level. A clean break above 4350 signals bullish intent, supported by improving volume and short-term trend alignment. This setup favors momentum traders looking to capitalize on a potential leg up toward the next resistance zone.
Watch for confirmation on lower timeframes and monitor BTC correlation for added confluence. Ideal for intraday or swing entries depending on volatility.
#ETHUSD #CryptoTrading #Ethereum #BreakoutSetup #BullishBias #MomentumTrade #TradingViewIdeas
Want me to tailor this for meme-style engagement or algo-friendly tagging? I can remix it in seconds.

New Bearmarket ideaHere we a have a deviation of an ascending channel, at these levels the market doesnt look lie itll have a hard sell off just yet and my overall look for bitcoin is about $26k to end this run. this bull market has been a tough pill for me to swallow but hey you live and you learn, its the only way to get better a the craft

ETH - Bearish correction awaited! remember my view on #ETH 📉
Nothing looks bullish here, under 4510$, especially 4600$
Very neutral area yet. (short term).
Again, it looks more like a bearish retest HTF, and there is a huge gap to be fill if price isn"t able to hold above 4250.
Medium term setup:
likely a correction to hit the 4050 - 4000$ support. 📉
A deeper correction toward 3800$ levels would also be a good spot & key demand zone for a next bull rally.
Money rotation into some #alts ?

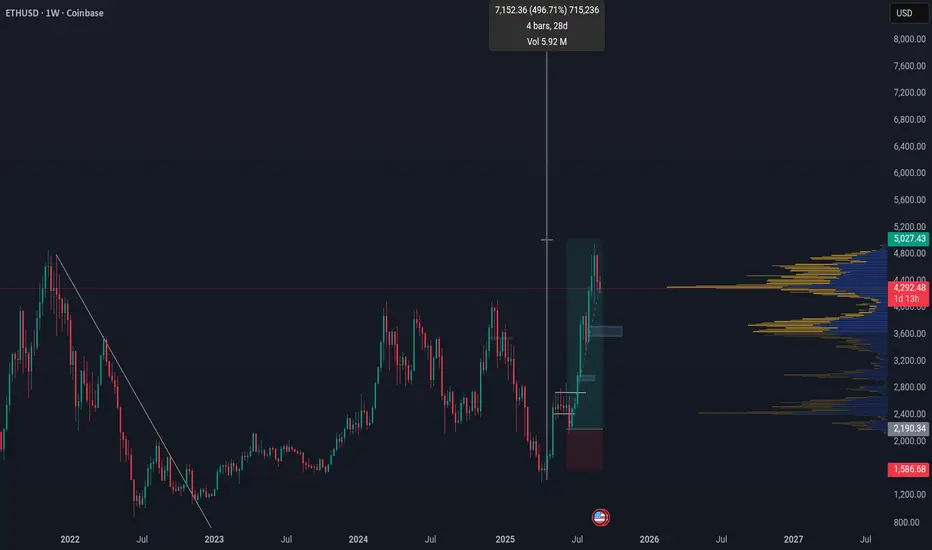
BITCOIN - The Corrective Pattern Since 2013 Explained...In this video, I break down Bitcoin’s corrective pattern since 2013 using the AriasWave methodology—rather than Elliott Wave or Bollinger Bands. This marks a significant moment for AriasWave followers, as I apply the method in a more advanced way to decode not only Bitcoin’s structure, but also global markets and, most importantly, Altcoins.
I highlight Altcoins in particular because they appear to hold the greatest potential for explosive growth, largely due to their lagging correlation with Bitcoin. This video is the first in a new analysis series, where I’ll soon take a closer look at Bitcoin’s short-term price action. For now, I wanted to start with this broader perspective, which projects Bitcoin reaching a target range between $276K and $311K.
The target for Ethereum is $69K.
I will explain the target for Thor Chain in an upcoming RUNEUSDT video.

$ETH trading near $4,400 I’m still holding my short.CRYPTOCAP:ETH trading near $4,400 — I’m still holding my short. Strong resistance sits at $4,850–$5,100, and I’ll look to add more if we retest that zone. First downside target is $4,000, then $3,500. I’ll share updates if I close or adjust the position.
