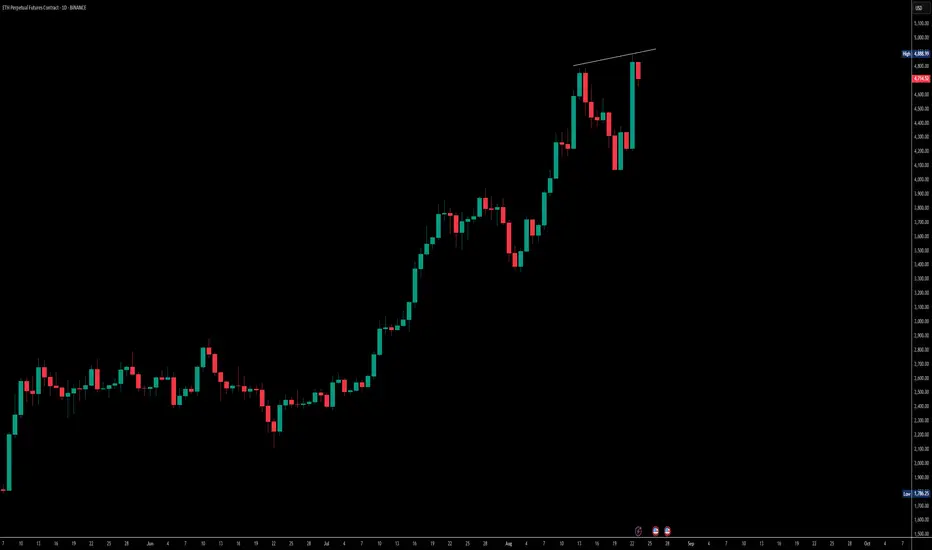
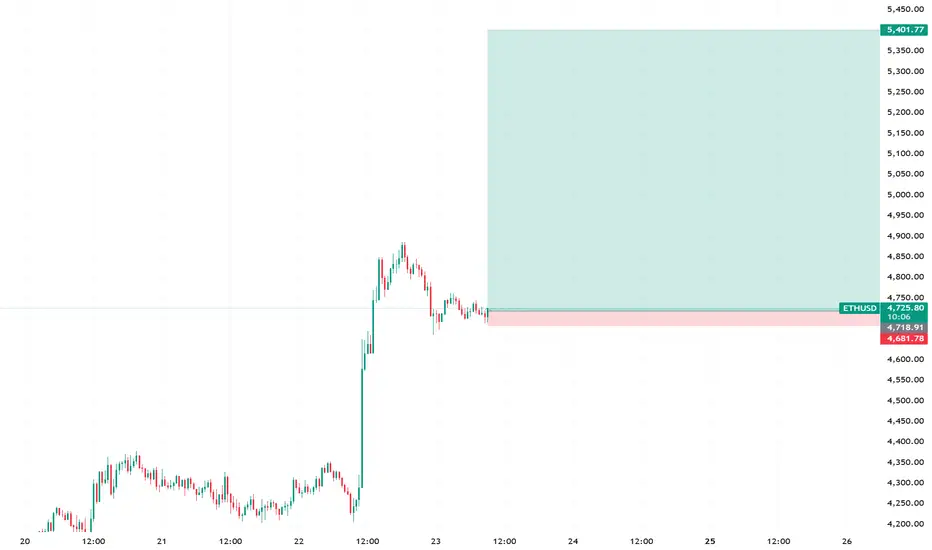
ETHUSDTI think moved trend by break 4485$ resistance and 4250$ support in BINANCE:ETHUSDT .
Support: 4250 - 3900 - 3510
Resistance: 4485 - 4720 - 5000
Please control risk management.
Ethreum

Ethereum Whales Scoop Up 260K ETH, Fueling $5K Recovery Hopes
The cryptocurrency market is witnessing a significant shift as Ethereum whales accumulate massive positions, with recent data showing an unprecedented 260,000 ETH purchased in just 24 hours. This substantial whale activity is generating considerable optimism among investors and analysts, who are now eyeing a potential recovery toward the psychologically important $5,000 price level.
Massive Whale Accumulation Signals Market Confidence
Large-scale Ethereum holders, commonly referred to as "whales" in the cryptocurrency community, have demonstrated remarkable confidence in ETH's future prospects through their recent buying behavior. The acquisition of 260,000 ETH in a single day represents approximately $650 million worth of Ethereum at current market prices, indicating that institutional and high-net-worth investors are positioning themselves for what they perceive as an imminent price rally.
This whale accumulation pattern is particularly significant given the broader market context. While many retail investors remain cautious following recent market volatility, sophisticated investors with substantial capital reserves are taking advantage of current price levels to build sizeable positions. The concentrated nature of these purchases suggests coordinated confidence among major market participants rather than isolated buying decisions.
The timing of this accumulation is noteworthy as well. Ethereum has been trading in a consolidation phase following its previous rally, and whale activity often serves as a leading indicator of upcoming price movements. Historical data shows that significant whale accumulation periods frequently precede major price breakouts, lending credence to the bullish sentiment surrounding ETH's near-term prospects.
Bitcoin Profit Rotation Driving Ethereum Demand
A particularly interesting aspect of the current market dynamics is the apparent rotation of capital from Bitcoin into Ethereum. As Bitcoin approaches resistance levels and shows signs of consolidation, savvy investors are taking profits from their BTC positions and reallocating these funds into ETH. This rotation strategy reflects a sophisticated understanding of market cycles and the relative value proposition between the two leading cryptocurrencies.
Bitcoin's recent performance has been strong, but many analysts believe that Ethereum may offer superior upside potential in the coming months. The rotation from BTC to ETH is not merely a short-term trading strategy but reflects fundamental beliefs about Ethereum's technological advantages and ecosystem growth potential. This capital rotation is providing additional buying pressure for ETH while simultaneously reducing selling pressure from profit-taking activities.
The scale of this rotation is substantial enough to impact market dynamics significantly. When large holders move capital between cryptocurrencies, it often creates momentum that smaller investors follow, potentially amplifying the initial movement. This phenomenon could be contributing to the sustained buying pressure we're observing in Ethereum markets.
Technical Analysis Points to $5K Target
From a technical analysis perspective, the current whale accumulation is occurring at what many chartists consider optimal entry levels. Ethereum's price action has formed what appears to be a strong support base, and the addition of substantial whale buying is providing the foundation for a potential breakout to higher levels.
The $5,000 price target that has emerged in analyst discussions is not arbitrary. This level represents a significant technical milestone that would place Ethereum at new all-time highs, surpassing its previous peak reached during the 2021 bull market. Achieving this target would require approximately a 50-60% rally from current levels, which, while substantial, is not unprecedented for Ethereum during strong market phases.
Several technical indicators are aligning to support this bullish thesis. The accumulation by whales is reducing the available supply on exchanges, creating conditions for price appreciation when demand increases. Additionally, on-chain metrics show declining ETH reserves on major exchanges, suggesting that holders are moving their assets to cold storage with long-term holding intentions.
Fundamental Drivers Supporting Price Recovery
Beyond technical factors, several fundamental developments are supporting the case for Ethereum's price recovery. The network's transition to proof-of-stake consensus has fundamentally altered ETH's economic model, introducing deflationary mechanisms that reduce supply over time. This structural change creates long-term upward pressure on prices, particularly when combined with sustained demand.
The growth of decentralized finance (DeFi) continues to drive demand for ETH as the primary collateral and gas token for the Ethereum ecosystem. Recent developments, including major DeFi protocols expanding their offerings and new innovations in yield generation, are attracting both institutional and retail capital to the Ethereum network. This increased activity translates directly into increased demand for ETH.
Layer 2 scaling solutions are also contributing to Ethereum's value proposition by making the network more accessible and cost-effective for users. While some initially worried that Layer 2 solutions might reduce demand for mainnet ETH, the opposite has proven true. These scaling solutions are enabling new use cases and bringing more users to the Ethereum ecosystem, ultimately increasing overall network value and ETH demand.
Institutional Adoption Accelerating
The whale accumulation we're observing is likely driven, at least in part, by increasing institutional adoption of Ethereum. Major corporations, investment funds, and financial institutions are recognizing Ethereum's potential as both a store of value and a platform for innovation. This institutional interest is providing a stable foundation of demand that supports higher price levels.
Recent regulatory clarity in various jurisdictions has made it easier for institutions to hold and trade Ethereum. The approval of Ethereum ETFs in multiple markets has provided traditional investors with regulated exposure to ETH, broading the potential investor base significantly. This institutional infrastructure is creating new channels for capital to flow into Ethereum, supporting the whale accumulation trend.
The institutional adoption story extends beyond simple investment holdings. Many institutions are building applications and services on Ethereum, creating operational demand for ETH that goes beyond speculative investment. This utility-driven demand provides a more stable foundation for price appreciation than speculation alone.
Market Sentiment and Risk Factors
While the whale accumulation and associated price targets are generating significant optimism, it's important to consider potential risk factors that could impact Ethereum's trajectory. Macroeconomic conditions continue to influence cryptocurrency markets, and changes in monetary policy or economic outlook could affect investor appetite for risk assets like ETH.
Regulatory developments remain a key consideration for Ethereum's future. While recent regulatory clarity has been generally positive, ongoing discussions about cryptocurrency regulation in major markets could introduce volatility. However, Ethereum's established position and broad ecosystem make it less vulnerable to regulatory challenges than smaller, less established cryptocurrencies.
Competition from other blockchain platforms also represents a consideration, though Ethereum's first-mover advantage and network effects provide substantial competitive moats. The ongoing development of Ethereum 2.0 and associated scaling solutions are addressing many of the performance concerns that competitors have attempted to exploit.
Looking Ahead: October Catalyst Potential
Many analysts are pointing to October as a potential catalyst month for Ethereum's price recovery. This timing aligns with historical patterns showing that the fourth quarter often brings increased cryptocurrency market activity. The combination of whale accumulation, institutional adoption, and seasonal patterns could create a perfect storm for price appreciation.
The prediction of a potential "bear trap" in September, where prices might temporarily decline to the mid-$3,000 range before surging in October, reflects sophisticated market timing strategies. Such scenarios often catch retail traders off-guard while providing additional accumulation opportunities for sophisticated investors who understand market cycles.
Conclusion
The recent whale accumulation of 260,000 ETH represents a significant vote of confidence in Ethereum's future prospects. Combined with capital rotation from Bitcoin, technical breakout potential, and strong fundamental drivers, conditions appear favorable for a substantial price recovery toward the $5,000 target level.
While short-term volatility remains possible, the sustained whale buying suggests that sophisticated investors are positioning for longer-term appreciation. The combination of reduced supply through staking and burning mechanisms, increased institutional adoption, and ongoing ecosystem development creates a compelling investment thesis for Ethereum.
Investors should remain aware of potential risks and market volatility, but the current accumulation pattern by whales provides strong evidence that major market participants expect significant appreciation in Ethereum's value. As the cryptocurrency market continues to mature and institutional adoption accelerates, Ethereum appears well-positioned to benefit from these broader trends, potentially making the $5,000 price target achievable in the coming months.
The convergence of technical, fundamental, and sentiment factors creates an unusually positive outlook for Ethereum. While past performance doesn't guarantee future results, the current whale accumulation pattern mirrors successful accumulation phases that have preceded major rallies in Ethereum's history, suggesting that similar outcomes may be possible in the current market cycle.

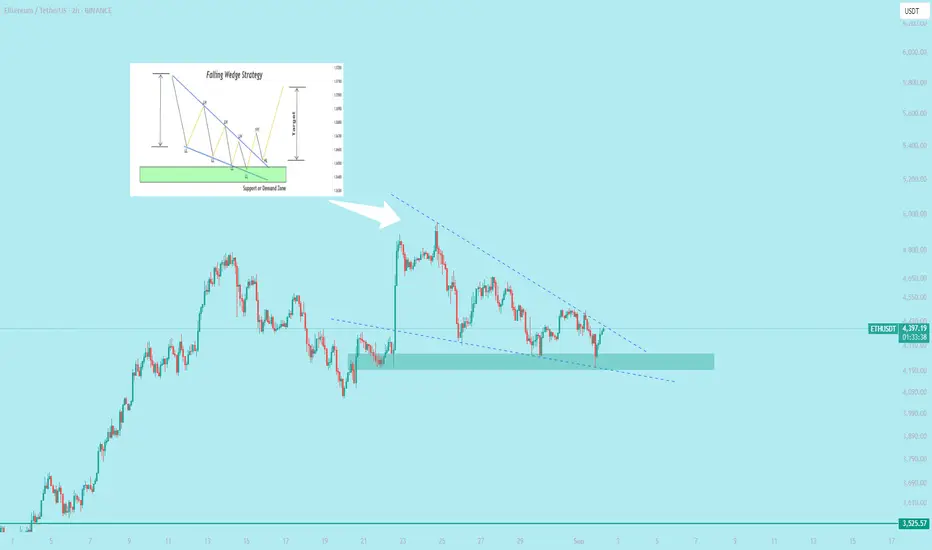
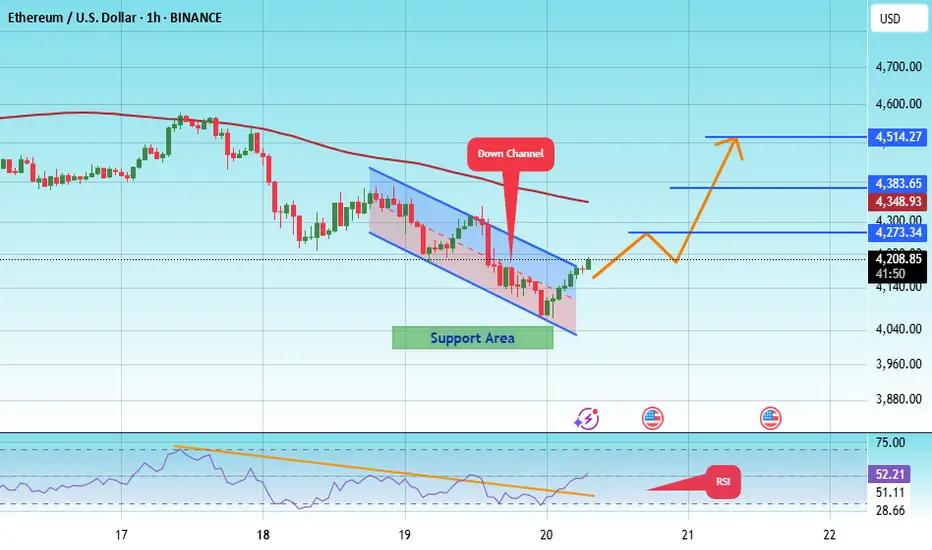
$ETH Performing falling wedge patternA **falling wedge pattern** is a bullish chart pattern in technical analysis. It forms when the price makes lower highs and lower lows, but the range narrows as the lines converge, creating a wedge shape sloping downward.
**Key Points:**
- **Bullish Signal**: Indicates a potential price reversal or breakout to the upside.
- **Structure**: Two converging trendlines—support (lower) and resistance (upper)—sloping downward.
- **Breakout**: Typically, the price breaks above the upper resistance line, signaling a bullish move.
- **Volume**: Often decreases as the wedge forms, then spikes on breakout.
- **Confirmation**: Wait for a breakout above resistance with strong volume for confirmation.
**Trading Tip**: Enter a long position after the breakout, with a stop-loss below the lower trendline. Target price is often the height of the wedge added to the breakout point.
Example: If Sahara stock shows a falling wedge, watch for a breakout above the upper trendline with high volume for a potential buy signal.
Ethereum’s Epic Climb: $10,000+ by Year-End 2025!New data and discoveries have come in, so my prediction for ETH has changed.
Back in March 2025, I saw this ETH pattern forming:
So far, everything is playing out as expected, but I believe the timeline has shifted to sometime at the end of December 2025.
We have one major liquidation event to play out before this happens in September, and I would not be surprised if we get a pullback to $3,500 before liftoff.
Bitcoin will most likely go down to $92,000 to close the CME gap:
You can check that out above, and when that happens, ETH should bottom out somewhere around $3,500.
The next major time Fibonacci will be on October 10th, 2025; this is most likely when we get the breakout. Until then, a massive trap is forming.
Ascending triangles are the name of the game in a bull market, especially with ETH:
As long as we keep putting in lower highs into ascending triangles, we are good to go higher; anything else is noise.
Invalidation for this thesis is simple: we close a weekly candle under the orange support, and chances are very high that we are done.
All I think is happening here is preparation for a massive bear trap, flushing out all the late leverage, as they always do. This is just a rite of passage before a major rally ensues.

ETHUSD SWING SELL LOADING1. Top123 Pattern Confirmation
The Top123 pattern is a reversal pattern:
Point 1: First high after a strong uptrend (recent swing high near $4,960–$5,000).
Point 2: Pullback low (around $4,370–$4,400 zone).
Point 3: Lower high rejection (below $4,700 resistance zone).
👉 Since price failed to create a new higher high and instead formed a lower high, the bullish momentum is weakening and signaling potential trend reversal.
2. Bearish Momentum Signs
Recent daily candles show strong selling pressure with long wicks and consecutive red candles.
Price rejected supply zone ($4,650–$4,700) → confirming seller dominance.
Break of support level around $4,400 increases the probability of a larger downside move.
3. Supply & Demand Structure
Price is currently retesting broken support as resistance (classic bearish structure).
Short entry zone aligns with the supply zone, which increases the probability of rejection.
Target zone is marked around $3,600–$3,550, which is the next strong demand/support level.
✅ Summary:
This ETH/USD daily setup is a potential short because:
Top123 pattern indicates trend reversal from bullish → bearish.
Bearish momentum visible with lower highs and supply zone rejection.
Price structure aligns with short entry near resistance and target at next demand zone.
Strong risk-to-reward ratio makes the trade favorable.

ETH/USD: ETH on the Edge!ETH is currently trading around $4,390–$4,430 after a summer rally and a modest pullback, reflecting broader crypto weakness linked to shifting U.S. rate-cut expectations. Demand from spot ETH ETFs has been a key support factor, with inflows continuing steadily and several trackers reporting multi-billion-dollar monthly additions.
On-chain activity also remains robust, with DeFi TVL, daily transactions, and active addresses near 2025 highs, indicating that real usage underpins price action. The completion of the Pectra upgrade and upcoming scalability improvements further support medium-term confidence, while macro developments remain the main swing factor, as crypto reacts to Fed guidance and broader risk appetite.
Technically, $4,300–$4,350 provides immediate support, with deeper support at $4,150–$4,200, while resistance sits at $4,600, above which $4,950–$5,000 becomes achievable. In the next 2–6 weeks, ETH is likely to trade in a range of $4,200–$4,950, with ETF inflows and strong on-chain metrics cushioning dips, though a decisive close above $4,600 would open a run toward $4,900–$5,000, and a close below $4,300 risks probing $4,150–$4,200.
Into Q4, the outlook remains constructive but choppy, with potential to retest and break $5,000 if flows persist and macro conditions remain favorable. Key risks include a macro downside surprise, ETF outflows, and technical or regulatory setbacks.
Market participants should watch ETF flow prints, on-chain activity, and U.S. rates data, as these will heavily influence ETH price action. Overall, near-term trading likely remains choppy between $4,200 and $4,950, with $4,600 acting as pivotal resistance and $4,300 as immediate support, while ETF inflows and real usage favor buy-the-dip behavior, and macro developments will determine whether ETH can sustainably challenge $5,000.

ETH/USDTI think the box and area I drew below is a good buy zone for Ethereum and we could see an upward move from it.

EthMarket showing signs of weakening here tbh..
Potential for a sweep of 4k and even retesting 2.618 down at 3.5k
Over all bullish bias unless 3.5k is lost comprehensively but the volume of eth being purchased by institutions (announced already) is significant so I dont think we break down fully from here
But wider market forces also sugges a consodildatory period until the next Sept fomc.

Ethereum Exit Queue Hits $5B: Wall Street’s Big Bet?
Ethereum Exit Queue Hits $5B: Sell Pressure or Wall Street’s Big Bet?
Ethereum continues to dominate crypto headlines in 2025. The network’s staking system has reached an unprecedented milestone with nearly $5 billion worth of ETH awaiting withdrawal—a development that has sparked both optimism and concern. While some fear that this backlog could translate into significant sell pressure, others see it as part of a broader realignment toward institutional adoption.
At the same time, Ethereum’s spot ETFs are outperforming Bitcoin ETFs by a wide margin, drawing in nearly $1.83 billion in just five days—ten times the inflows of Bitcoin funds. This surge highlights a growing narrative: Wall Street is tilting its focus toward Ethereum, not only as a cryptocurrency but as a foundational layer of modern finance.
This article examines the implications of the record exit queue, the rise of Ethereum ETFs, and whether ETH is poised to outperform BTC as the crypto market’s dominant asset.
Ethereum’s Record Exit Queue: A $5B Test for the Market
Ethereum’s exit queue refers to the backlog of stakers who have requested to withdraw their ETH from the staking contract. Following Ethereum’s transition to proof-of-stake in 2022 and the Shanghai/Capella upgrade in 2023, staked ETH has become liquid, enabling participants to lock and unlock their holdings as they choose.
Today, that queue has swelled to nearly 5 million ETH—worth around $5 billion. This is the largest exit queue in Ethereum’s history, and it raises critical questions:
1. Will this ETH be sold on the open market?
After a 72% rally in the past three months, many stakers may be tempted to take profits, especially those who locked in ETH at lower prices during the bear market. A mass sell-off could put downward pressure on prices.
2. Or is this a rotation of capital?
Not all withdrawals translate into selling. Many institutional investors may be withdrawing ETH to redeploy it into spot ETFs, where liquidity, custodial security, and regulatory approval are more attractive. Others may seek higher yields in decentralized finance (DeFi) protocols, liquid staking derivatives, or alternative strategies.
3. What about long-term holders?
A sizable portion of Ethereum’s stakers are long-term believers in the protocol. For them, withdrawing doesn’t necessarily mean exiting—rather, it may signal repositioning into newer financial products that better fit their strategies.
Ultimately, the exit queue is both a sign of Ethereum’s growing liquidity and a potential near-term overhang on price.
The 72% Rally: Profit-Taking or Momentum?
Ethereum’s price surge—up 72% in just three months—gives context to the withdrawal queue. After a prolonged bear market, ETH holders have seen one of the strongest rallies in years. For many, the exit queue represents an opportunity to lock in profits at multi-month highs.
However, the rally is not just speculative. Several fundamental drivers are fueling Ethereum’s rise:
• ETF approvals and inflows are bringing unprecedented institutional demand.
• Layer 2 scaling solutions such as Arbitrum, Optimism, and Base are driving transaction volumes while reducing costs.
• Tokenization pilots by major banks and asset managers are increasingly choosing Ethereum as a settlement layer.
This means the rally is underpinned by both sentiment and structural adoption, making it harder to dismiss as a short-lived pump.
Ethereum ETFs: Outshining Bitcoin
One of the most striking developments is the flow of capital into Ethereum ETFs. In just five days, spot Ether ETFs have attracted $1.83 billion in inflows, compared to only around $180 million into Bitcoin ETFs. This 10-to-1 ratio in favor of Ethereum is rare, as Bitcoin has traditionally dominated institutional flows.
Why are ETFs favoring Ethereum?
1. Utility Beyond Store of Value
Bitcoin is often called “digital gold,” but Ethereum is more than a speculative hedge. It underpins decentralized finance, NFTs, tokenization, and smart contracts—areas with real-world utility that institutions can leverage.
2. Yield Through Staking
Unlike Bitcoin, Ethereum offers staking rewards. Even though ETF structures may not directly pass staking yields to investors, the narrative of a yield-bearing crypto asset appeals to long-term capital allocators.
3. Alignment with Wall Street’s Future
Ethereum’s programmability makes it easier for Wall Street to imagine building products and services on top of it. From tokenized bonds to on-chain settlement systems, Ethereum’s relevance extends beyond speculation.
As a result, institutional flows are tilting toward ETH, reinforcing its narrative as the infrastructure layer of finance.
Will Ethereum Outperform Bitcoin?
The question on every investor’s mind: can Ethereum outperform Bitcoin in this cycle?
Ethereum’s Tailwinds:
• ETF Momentum: With stronger inflows, ETFs could become a steady channel for demand.
• Broader Use Cases: Ethereum is not just money—it’s programmable finance.
• Institutional Adoption: Banks and asset managers are experimenting with Ethereum for tokenization and settlement.
Ethereum’s Risks:
• Sell Pressure: The $5B exit queue could weigh heavily on prices if too much ETH hits the market.
• Competition: Alternative blockchains like Solana and Avalanche are vying for institutional attention with faster throughput.
• Regulation: Ethereum’s staking system could attract more scrutiny than Bitcoin, which is generally classified as a commodity.
Bitcoin’s Defenses:
Bitcoin still has the advantage of being the original, most secure, and most decentralized crypto asset. Its supply cap of 21 million gives it unmatched scarcity. But in terms of growth opportunities and utility, Ethereum may have the edge.
Wall Street’s Tilt Toward Ethereum
Ethereum’s ETF inflows and VanEck CEO Jan van Eck’s recent remarks calling ETH “the Wall Street token” suggest a broader narrative shift. Wall Street is beginning to view Ethereum not just as another cryptocurrency, but as the financial operating system of the future.
• Banks are exploring blockchain-based stablecoin transfers.
• Asset managers are launching tokenization pilots on Ethereum.
• Investors are reallocating from Bitcoin to Ethereum ETFs.
This alignment means Ethereum is no longer just a crypto-native story. It is becoming central to how global finance evolves.
Looking Ahead: Short-Term Pressure, Long-Term Promise
The $5 billion exit queue is a short-term concern. If even a fraction of that ETH is sold, prices could face volatility. But in the bigger picture, withdrawals represent liquidity and flexibility—a sign of a maturing ecosystem.
At the same time, Ethereum’s ETF success and its growing reputation as Wall Street’s blockchain suggest that institutional adoption is only beginning. If these inflows persist, Ethereum could not only outperform Bitcoin but also cement its role as the primary financial infrastructure of the digital age.
Conclusion
Ethereum is at a crossroads. On one hand, the record $5 billion exit queue raises fears of sell pressure and short-term volatility. On the other, Ethereum’s ETF dominance, institutional adoption, and 72% rally signal powerful momentum.
The battle between profit-taking and institutional accumulation will define Ethereum’s near-term price action. But the broader trend is clear: Ethereum is no longer just competing with Bitcoin—it is carving out its identity as the backbone of decentralized and traditional finance alike.
As Wall Street piles into ETH and banks experiment with on-chain settlement, Ethereum’s claim to be the future of finance grows stronger. Whether it outperforms Bitcoin in this cycle remains to be seen, but one thing is certain: Ethereum has secured its place at the center of the crypto narrative.

Ethereum Buy ZoneEntering long in ETHUSD
from zone 4545 - 4525
keeping target 4660 as First booking area
4760 second booking area

Ethereum at Risk? Leverage Hits Record High as AI Finance BoomEthereum (ETH), the second-largest cryptocurrency by market capitalization, is navigating a complex and dynamic environment. On one hand, Ethereum continues to emerge as the backbone of AI-powered finance, solidifying its role as the infrastructure layer for the next wave of intelligent decentralized applications. On the other hand, market participants are growing wary, as the Binance leverage ratio for ETH has surged to historic highs, a signal often correlated with heightened volatility and potential downside risk.
Adding to the intrigue, Ether recently broke out against Bitcoin, rallying by nearly 5% on Monday. While this has brought short-term optimism into the market, analysts caution that a true trend reversal will only be confirmed if ETH can flip the critical $4,700 level into long-term support.
This article explores these pivotal developments, the risks and opportunities they present, and why Ethereum remains at the center of both financial innovation and speculative fervor.
________________________________________
1. Binance Leverage Ratio Soars to Record Levels: What It Means for Ethereum
Understanding the Binance Leverage Ratio
The Binance Estimated Leverage Ratio (ELR) is a key metric that tracks the amount of open interest in derivatives relative to the reserves of the underlying asset—in this case, ETH—on the Binance exchange. A rising ELR indicates that traders are increasingly using borrowed funds (leverage) to speculate on price movements.
As of late August 2025, the ELR for Ethereum has skyrocketed to its highest level ever recorded, surpassing previous peaks from 2021 and 2022. This means that a higher percentage of Ethereum trading on Binance is being conducted with leverage, raising the stakes for both bulls and bears.
Risks of Elevated Leverage
High leverage can act as a double-edged sword:
• Volatility Amplification: Leveraged positions can exaggerate price swings. A modest move in ETH price can trigger liquidations, leading to cascading effects.
• Greater Liquidation Risk: With more traders overexposed, sudden price drops can result in mass liquidations, accelerating downward momentum.
• Market Fragility: The market becomes more vulnerable to external shocks—regulatory changes, macroeconomic data, or unexpected news events can have outsized impacts.
Historical Precedents
When the ELR reached similarly elevated levels in May 2021 and November 2022, Ethereum experienced sharp corrections shortly thereafter. These historical patterns suggest that the current surge in leverage could be a warning sign for a potential pullback—especially if ETH fails to hold critical technical levels in the coming days.
________________________________________
2. Ether Breaks Out Against Bitcoin: A Key Technical Signal
While leverage-related risk looms large, Ethereum has shown notable strength against Bitcoin in recent trading sessions. On Monday, Ether rallied nearly 5%, breaking out of a multi-month consolidation pattern against BTC. This has sparked renewed interest in whether ETH is poised to outperform Bitcoin in the near term.
ETH/BTC Breakout: A Bullish Reversal?
The ETH/BTC ratio is often used by traders to assess relative strength. A breakout in this pair suggests that Ethereum is gaining ground in terms of market dominance and investor interest.
Technical analysts point out that the ETH/BTC pair recently broke above a descending trendline that had been in place since early 2024. This move is being interpreted by many as a bullish reversal — a signal that Ethereum might be ready to lead the next leg of the crypto bull market.
The $4,700 Level: A Make-or-Break Resistance
Despite the excitement, the rally’s sustainability hinges on one key resistance level: $4,700. Ethereum previously tested this level in early 2024 but failed to break through decisively. Flipping this level into support is crucial for validating the current uptrend.
• Short-Term Bull Case: If ETH consolidates above $4,700, it could open the door to a retest of the all-time high around $4,870 and potentially push toward the psychologically significant $5,000 mark.
• Bearish Scenario: If ETH fails to hold $4,700 and falls back below, it could trigger another round of liquidations, especially given the high leverage environment.
•
With the Ethereum market teetering on a technical knife-edge, all eyes are now on price action around this critical level.
________________________________________
3. Despite Volatility, Ethereum Is Cementing Its Role as the Backbone of AI-Powered Finance
While short-term risks dominate headlines, Ethereum is quietly laying the foundation for the next generation of decentralized, AI-powered financial systems. The convergence of blockchain and artificial intelligence (AI) is rapidly evolving, and Ethereum is emerging as the preferred platform for this fusion.
Why Ethereum?
Ethereum’s core strengths make it uniquely suited to become the infrastructure layer for AI-integrated finance:
• Smart Contract Flexibility: Ethereum’s programmable contracts allow developers to build complex autonomous systems that interact with external data.
• Network Effects: With the largest developer community in Web3, Ethereum benefits from continual innovation and support.
• Layer-2 Scaling: Rollups and other Layer-2 solutions (e.g., Arbitrum, Optimism) enable Ethereum to handle greater transaction throughput, crucial for AI applications that require real-time data processing.
•
Key Use Cases for AI on Ethereum
1. Autonomous Financial Agents
Smart contracts can be paired with AI agents to create self-governing financial bots that execute trades, manage portfolios, or optimize yield strategies in DeFi protocols. These agents can adapt to market conditions faster than human traders, offering a competitive edge.
2. Decentralized AI Marketplaces
Ethereum-based platforms like Ocean Protocol and SingularityNET allow users to buy, sell, or license AI models and data sets. These marketplaces are democratizing access to AI, enabling developers and researchers to monetize their work without intermediaries.
3. On-Chain AI Inference
Projects are now exploring how to run AI inference—the process of making predictions from trained models—directly on-chain or via decentralized compute networks. This allows for truly censorship-resistant and transparent AI decision-making in areas like lending risk assessment and insurance underwriting.
4. AI-Powered Oracles
Oracles such as Chainlink are integrating AI to enhance the reliability and relevance of off-chain data delivered to smart contracts. This enables more accurate, real-time inputs into DeFi protocols, insurance contracts, and prediction markets.
________________________________________
4. Institutional Interest & Regulatory Clarity Fuel Ethereum’s Growth
Beyond technological innovation, Ethereum is also benefiting from increased institutional interest and a clearer regulatory environment in key markets.
Spot ETH ETFs Drive Demand
The approval of spot Ethereum ETFs in several jurisdictions — including the U.S., Europe, and Asia — has contributed to a surge in institutional demand. These financial products allow traditional investors to gain exposure to ETH without dealing with wallets or private keys.
In the months following ETF approvals, Ethereum saw:
• A sharp increase in institutional inflows.
• Greater liquidity and reduced volatility.
• Renewed bullish sentiment among long-term holders.
Regulatory Clarity Emerges
Regulatory bodies have begun to differentiate Ethereum from other crypto assets, often classifying it as a commodity rather than a security. This distinction has major implications for how ETH is treated under financial regulations, and further cements its status as a legitimate and investable asset.
________________________________________
5. What Comes Next: Scenarios to Watch
Bullish Scenario
If Ethereum can maintain momentum and flip $4,700 into support in the coming days, the path to new all-time highs becomes much clearer.
• Key Price Levels: After $4,700, the next resistance is at the 2021 all-time high of $4,870. Beyond that, price discovery could push ETH toward $5,200–$5,500.
• Narrative Boost: A growing narrative around AI + DeFi convergence could bring a fresh wave of speculative interest and developer activity to the Ethereum ecosystem.
Bearish Scenario
However, if ETH fails to hold $4,700 and the high leverage ratio on Binance triggers a liquidation cascade, a retracement to $4,300 or even $4,000 is possible in the short term.
• Market Sentiment: Leverage unwinding could lead to panic selling, particularly among retail traders.
• Macro Risk: Any unfavorable macro developments (e.g., interest rate hikes, geopolitical tensions) could exacerbate the downtrend.
________________________________________
Conclusion: Ethereum at a Crossroads
Ethereum stands at a crossroads — balancing short-term price volatility against immense long-term potential. The record-high leverage ratio on Binance is a flashing warning sign for traders, suggesting the possibility of a pullback in the face of overheated speculative behavior.
Yet beneath the surface, Ethereum is evolving into the foundational layer of AI-powered, decentralized finance. As smart contracts become smarter and more autonomous, Ethereum’s role as the infrastructure for intelligent financial systems is becoming increasingly clear.
The recent 5% rally and breakout against Bitcoin signal optimism, but all eyes are now on $4,700. If this critical level becomes support, Ethereum could be poised for a breakout that finally fulfills its promise — not just as a digital asset, but as the backbone of an entirely new financial era.
#ETH/USDT#ETH
The price is moving within a descending channel on the 1-hour frame and is expected to break and continue upward.
We have a trend to stabilize above the 100 moving average once again.
We have a downtrend on the RSI indicator that supports the upward move with a breakout.
We have a support area at the lower boundary of the channel at 4300, acting as strong support from which the price can rebound.
We have a major support area in green that pushed the price upward at 4330.
Entry price: 4544.
First target: 4646.
Second target: 4830.
Third target: 4995.
To manage risk, don't forget stop loss and capital management.
When you reach the first target, save some profits and then change your stop order to an entry order.
For inquiries, please comment.
Thank you.

ETH BTC pair showing ETH under pressure to react - out of steam
ETH is under Long term resistance against the King Crypto, Bitcoin.
That weekly chart above does show ETH making its first come back since Late 2021 but now, it has reached a libe it may struggle to overcome.
The Weekly MACD below shows us there is room to move but look back at the last aTH in "021 ( dashed lines) amd see where MACD was then !
The Weekly RSI is already up in Overbought but as we know, it can range High
But, again, look back where RSI was when it reached its ATH's in 2021 ( dashed lines )
The DAILY chart also shows possible reasons to think that ETH may taje a breather.
OA being rejected off long term resistance
RSI has ranged high for weeks
MACD has ranged high for weeks.
True, with the American backing for its "Baby Crypto", mpmentum may continue but just remember, it is NOT decentralised really...the more you have, the more power you have to influence it.
Anyway..just be aware....Moves ARE about to happen and they could be in either direction but, Technicaly, it should Range or Dip.
Unless there is some other backing yet to appear......coughs......
ETHUSDT ETHEthereum has shown bullish strength in recent weeks and has formed several positive patterns. I believe it will target the $8,500 level after breaking the top at $4,900.

BTC AND ETH AnalysisCRYPTOCAP:BTC
Until we’re below the red box I outlined, my DOL on LQ is EQLs left below and PML. Then, depending on how we behave there, it will determine if further continuation to the June low and IBPR are going to be the DOL.
Now it is only a matter of narrative → how we’re going to do it: we will either find support within the BISI I marked and retrace to the red box (D SIBI – but it can stay as BAG), or we will displace through the blue BISI, find resistance there, and offer a low-resistance liquidity run to the EQLs and PML.
-----------------
CRYPTOCAP:ETH
On ETH, the thing is that as long as we’re respecting the inverted BISI, we can still make a deeper retrace to the upside. However, on BTC I’m becoming bearish; therefore, I’m more neutral on ETH. If we see that it respects the D.IFVG, then a potential retrace is likely, and that will also cause a retrace on BTC. But if we displace below the D.IFVG and find resistance there, then at that point both pairs are going to move in tandem, and I expect a rally to the downside.

Alt season time (PART 1)Hello friends
Well, the question that has come up a lot for you these days is the alt season or its beginning.
Well, you see the Ethereum dominance chart that the candle closed well on the weekly time frame, but on the daily time frame, if the price holds the 14.20 area and the 14.85 resistance is broken well and validly, we will go for the higher numbers that we have specified, and in this case we will see good growth of altcoins.
If the price falls and the support at 14.20 is broken, we will see a drop in the price of Ethereum as well as altcoins, so these next few days are very important.
*Trade safely with us*

ETH ATH scalpTrade is simply, ETH is about to break ATH and draw in massive amounts of breakout traders, we buy here taking more risk to sell to them later.
Use stops, patience and good luck.
ETHUSD-Just Another Correction Within Uptrend?On Ethereum, we’re seeing a retracement from the 4800 area, but we think this still can be a corrective move within the ongoing uptrend. The updated wave structure suggests this could be wave four of an incomplete bullish impulse that started from the June lows, so be aware of another push higher—ideally toward the 5000 area once the retracement completes. We see price now at strong support at 4160 - 4000 region, near the black trendline and former swing highs from December 2024, where stabilization may occur. So it appears that Ethereum has more upside ahead, especially with the October 2021 highs still intact; and before calling the end of this bull run with a larger fifth wave, we’d first need to see a breakout beyond that level, after which sharp extensions toward higher targets would be possible.

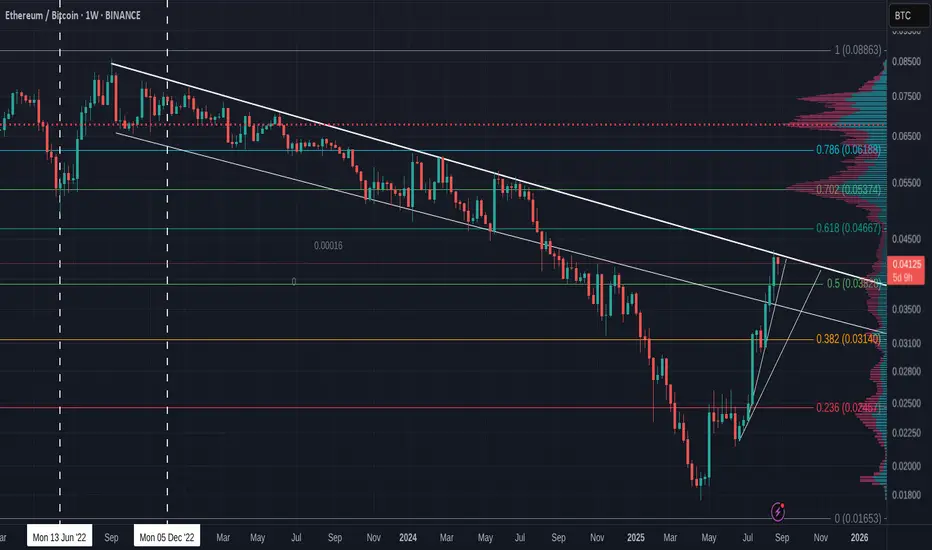
Period of ETH outperformance vs BTC is almost overWe got a clean five wave up structure that topped with a bang in April 25
This is from when ETH has been outperforming BTC nicely.
We can see a very clean corrective three wave decline labelled as A down, B up, C down
The ratio BTC vs ETH is approaching my Target 2.
What that chart tells us is that most likely the period of ETF outperformance against BTC is almost over.
That does not necessarily means that BTC should start a big rally. It is possible that both, BTC and ETH would decline. But that chart suggests that BTC would hold better in that case.

ETH Long term outlookPotential for if ETHBTC revisits Highs 9k eth by EOY
After that the traditional adoption cycles would suggest we are in for a significant bearish period...
If adoption has become significant enough there's credence to the idea that cycle theory no longer applies to this market like it used, 'this time will be different'.
However this has been called previous cycles and we still saw major downturns, if large projects begin to implode or stable coins depeg this would be what to watch out for to trigger a significant bear market.
Given BYBIT already got hacked for like 5% of the eth supply this cycle (major downturn) im not sure what would be the next issue...
Ive outlined two general paths but truth is it could be significantly more bullish than both of these... BTMNR calling for 10-15...
idk how easy it will be at the ETHBTC resistance even with the new high liquidity buyers.
see how we go..

#ETH/USDT Breaks Below Recent Triangle Structure !#ETH
The price is moving within an ascending channel on the 1-hour frame, adhering well to it, and is on track to break it strongly upwards and retest it.
We have support from the lower boundary of the ascending channel, at 4040.
We have a downtrend on the RSI indicator that is about to break and retest, supporting the upside.
There is a major support area in green at 4000, which represents a strong basis for the upside.
Don't forget a simple thing: ease and capital.
When you reach the first target, save some money and then change your stop-loss order to an entry order.
For inquiries, please leave a comment.
We have a trend to hold above the 100 Moving Average.
Entry price: 4203.
First target: 4273.
Second target: 4383.
Third target: 4514.
Don't forget a simple thing: ease and capital.
When you reach the first target, save some money and then change your stop-loss order to an entry order.
For inquiries, please leave a comment.
Thank you.
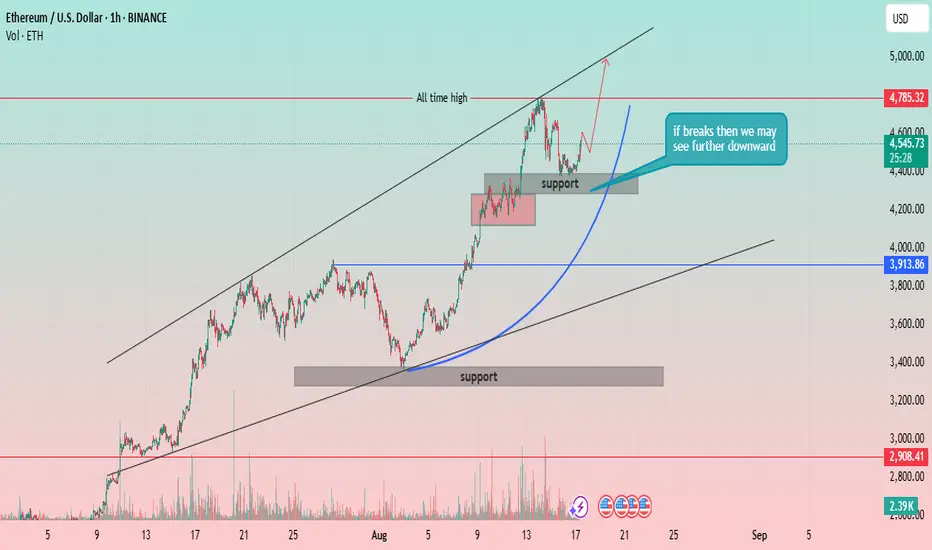
Ethereum (ETH) 1H Chart: Re-testing the All-Time High?Strong Uptrend Channel: The price of Ethereum has been moving within a well-defined ascending channel, indicated by two parallel black trendlines. This strong channel suggests a sustained bullish momentum.
All-Time High: A significant resistance level is marked as the "all-time high" at approximately 4,785.32 USD. The price has recently tested this level.
Support Levels:
Major Support Zone: A broad support zone is identified between approximately 3,300 USD and 3,450 USD. This zone has previously acted as a strong base for a price rally.
Recent Support Zone: A smaller, more recent support zone is marked around 4,200 USD. The price has consolidated within this area after its recent push towards the all-time high.
Price Action and Projections:
The price recently reached a peak near the all-time high and has since pulled back, consolidating within the recent support zone.
A key annotation states, "if breaks then we may see further downward." This highlights the importance of the 4,200 USD support zone. A break below this level could indicate a potential deeper retracement, possibly towards the lower trendline of the channel or the major support zone.
A parabolic arc is drawn (blue line), suggesting a potential trajectory for the price to continue its move higher from the current level, with a goal of re-testing or breaking the all-time high.
Volume: The chart includes a volume indicator, showing significant volume spikes during the major rallies and drops, confirming strong market interest and participation.
$Eth daily chart shows higher highs but RSI hints at pullbackLooking at ETH on the daily timeframe, price action is pushing higher highs, but RSI isn’t fully aligned — it’s only forming a higher low. That usually tells us this move could just be a pullback rather than a strong bullish divergence.
ETH already retested the May 2021 levels, and from here a correction toward $4,450 seems likely. If it holds and rebounds there, momentum can continue, but if it fails, we should be ready for deeper downside. The key support to watch is $4,000 — losing that would open doors for another correction.
On the other side, the stochastic RSI is near the bottom, which suggests a possible bounce. But weekends often come with fake pumps and dumps, so patience is important. Monday evening or Tuesday morning looks like a better window to see whether ETH attempts a proper correction or not.