$ETH Bearish Short-Term (September 24, 2025)BINANCE:ETHUSDT
Summary of Price Action:
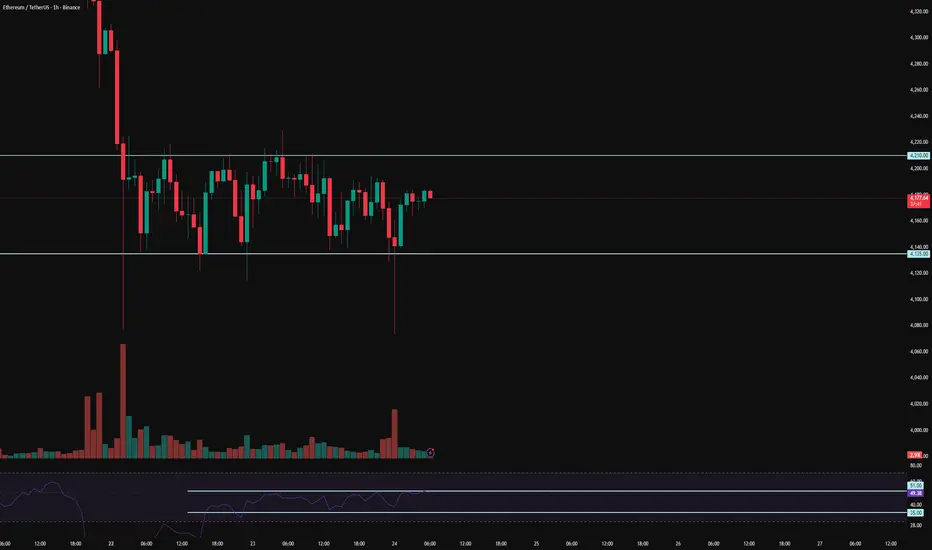
Recent Movement: In the last 24 hours, ETH has dropped by about 1.12%, reaching around $4,133 - $4,175 this morning (UTC). This follows a slight recovery from lows near $4,092 on September 22, but it's now retesting support at $4,100 amid strong institutional redemptions. In your 2H chart, we see a series of red candles (bearish) indicating selling pressure, with trading volume increasing during the decline, confirming seller interest.
Key Levels:
Support: $4,100 (immediate level, tested today) and $4,000 - $4,092 as a stronger lower zone. If $4,100 breaks, we could see a drop toward $3,900.
Resistance: $4,180 - $4,200 (strong level with recent rejections). A break above $4,200 would signal recovery toward $4,300.
Volume and Liquidity: 24-hour volume is around $34.8 billion, with large liquidations tied to $141 million in spot ETF outflows over the past day, mostly from institutional longs. This shows smaller traders suffering from bearish pressure.
MACD Indicator Analysis :In the chart you sent, the MACD line (blue) is crossing below the signal line (orange), with the histogram turning more negative (red bars growing). This indicates a bearish divergence – the price is weakening while momentum is losing strength. MACD is below the zero line, confirming a weak short-term trend. RSI (at similar levels) is around 40-50, signaling lightly oversold, but still without strong buy signals.
Overall Trend:
Bearish Short-Term, Bullish Long-TermShort-Term (Today/Next Day): Bearish.
The price is consolidating in a bearish channel, with predictions for further downside toward $4,000 - $4,092 today or tomorrow, due to fear sentiment and pressure from ETF outflows. This matches your chart, where we see a potential descending triangle pattern (but still uncertain). Avoid immediate buys – wait for confirmation below $4,100 for shorts or above $4,180 for longs.
ETHUSDT

ETH Crash or Bounce? The Critical Level Everyone Is WatchingEthereum (ETH/USDT) – Critical Support Test Ahead
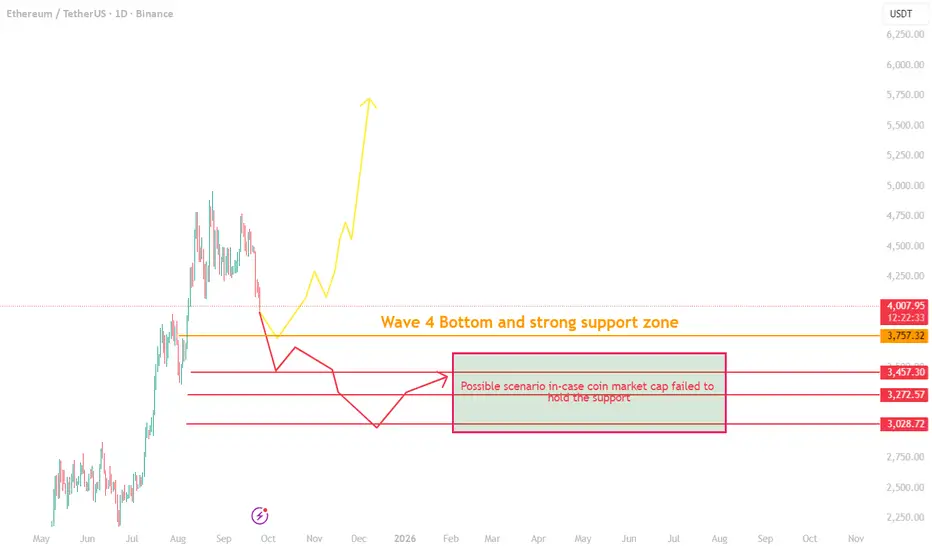
Ethereum is currently under pressure after breaking below the $4,000 support. The next significant level to watch is the $3,760 zone, which is not only a strong technical support but also aligns with the Elliott Wave 4 bottom as well as a key Fibonacci retracement area.
Key Scenarios
1. Bullish Recovery (Primary Expectation)
If ETH holds above the $3,760 support, we can expect consolidation in the range of $4,000 – $4,350.
This zone is likely to act as a base for Ethereum until broader market conditions stabilize.
Once momentum returns, ETH has the potential to resume its upward trend.
2. Bearish Breakdown
If ETH fails to defend $3,760, then deeper downside levels may come into play:
$3,450
$3,270
$3,000
This would represent a sharp and aggressive downturn. While possible, this remains weak scenario, given how violent the move would be.
Why the Answer Lies Outside ETH’s Chart
The real driver here isn’t just Ethereum—it’s the total "crypto market cap excluding BTC" as I have warned 2 days ago that's it's falling into a correction
The altcoin market cap is currently in correction as capital flows back into Bitcoin dominance, which has already broken its downtrend line and reached today 59%.
If the altcoin market cap holds its critical support and BTC dominance starts dropping, we can expect a broader bullish recovery across altcoins, with Ethereum following.
If that support breaks, then the weaker bearish scenario may unfold.
Conclusion
For now, the $3,760 support remains the critical line in the sand. Holding it keeps Ethereum within a bullish recovery path. Breaking it could open the door to deeper corrections.
ETH 1D Analysis - Key Triggers Ahead | Day 27❄️ Welcome to the cryptos winter , I hope you’ve started your day well.
⏰ We’re analyzing ETH on the 1-Day timeframe
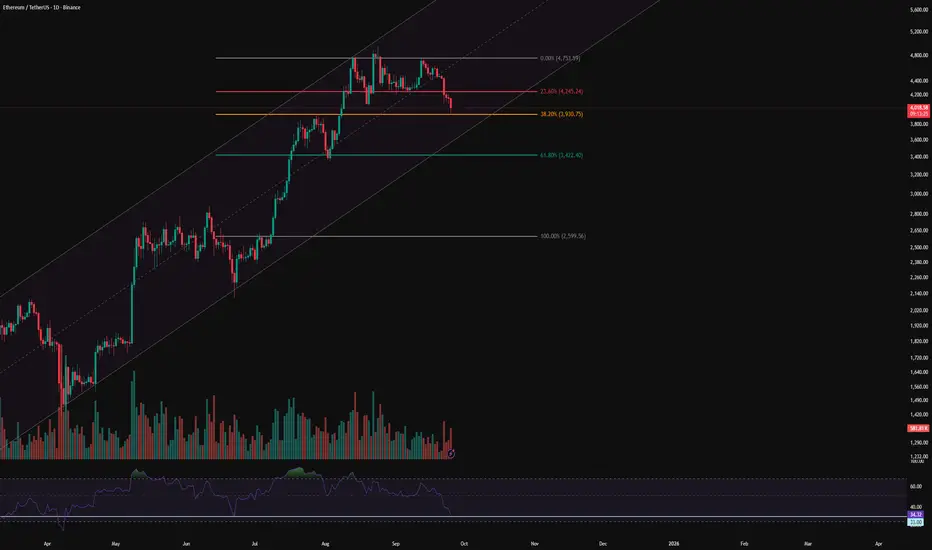
👀 On the daily timeframe we observe that Ethereum is trading inside a strong ascending channel. Currently, after touching the channel top, price moved toward the midline, lost the midline, and is now heading toward the channel bottom. Ethereum reacted once at the 38% Fibonacci zone, but selling pressure is increasing, and with losing this support level around $3,930, ETH can move toward the channel bottom and even lower support levels.
🎮 The Fibonacci retracement is drawn from the $2,600 breakout area up to the all-time high of Ethereum, which clearly covers all the support and resistance zones. At this stage, Ethereum has reacted to the 38% Fib level, but with losing this area it could move toward the key support overlapping with the channel bottom. The 38% zone observed in this analysis has high validity in daily price action, and with breaking this area we can open a short position.
🧮 Looking at the RSI oscillator, after creating a new all-time high, Ethereum entered selling pressure and is now near its oversold area. Our key RSI zone is also located here. With a cross below 33, Ethereum could experience a deeper correction and fully enter the oversold range.
🕯 The size and volume of red candles for breaking Fibonacci zones usually happen in a whale-driven manner. Normally, before the move, one or two opposite stop-hunts with shadows (wicks) appear, and then the move continues. The recent candles Ethereum has formed show strong selling volume, and candle closes below the 38% Fib zone together with selling pressure can bring even more red candles.
🧠 For an Ethereum position, it seems better to wait until whales and sharks of the market finish their stop-hunts. On the third touch, for example, with a break of the 38% Fib zone and entry of ETH into the oversold RSI area, we can open a sell position.
💡 Keep in mind that today the U.S. labor market has strengthened significantly, and there may be no signal of upcoming rate cuts in the next Fed meetings.
❤️ Disclaimer : This analysis is purely based on my personal opinion and I only trade if the stated triggers are activated .
ETH$ in uptrend ch ?!Ethereum is in an ascending channel, but it's undergoing a correction. The bottom of the channel, marked in orange, is an important point. Additionally, the green box indicates a key area that aligns with the weekly Fibonacci zone, as well as the 200 EMA. This is very significant and could lead to a price increase.


Ethereum (ETH/USDT) Weekly Chart UpdateEthereum (ETH/USDT) Weekly Chart Update
ETH is currently trading around $4026, down approximately 9.5% this week.
A long-term triangle breakout has occurred, and the price is now retesting this breakout zone.
Support levels: $3800 and $3500 (with the moving average).
Resistance levels: $ 4,500–$ 4,800 (short-term); if the momentum continues, the next major target would be $ 5,500–$ 6,000.
The overall trend remains bullish as long as ETH stays above $3500–$3600.
⚡ Summary:
ETH is currently experiencing a mid-term correction, but the long-term outlook remains bullish. Staying above support could pave the way for a move towards $5000+ in the coming months.
#crypto #ETH #BTC

ETHUSDT #009 (Be careful, need 15-20% correction for next cycleHello dear traders.
Good days.
First of all thanks for your support and comments.
————————————————————————
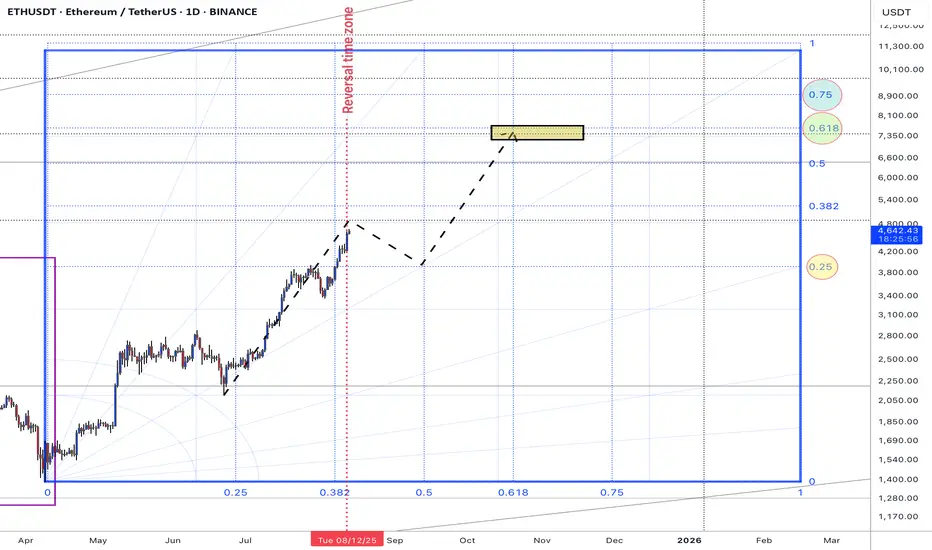
On daily Gann Square ETHUSDT break out 0.5 Gann Square price zone and with good strength trend line support it expected to fill 0.618 Gann box price level at exact reversal time zone .
So be careful and do not be FOMO . expected to grow up to 4800$ and correct 15-20 % correction for retest 0.5 Gann price zone .
If support at 3940-3915 $ will grow up fro next bull cycle .
BTC Dominance is mached also at exact time with ETHUSDT .
Weekly overview of ETHUSDT Chart will updated.
Good luck and safe trades.
ETH: Sharp Flush, Filling the FVG or Preparing for a Deeper DropHello everyone,
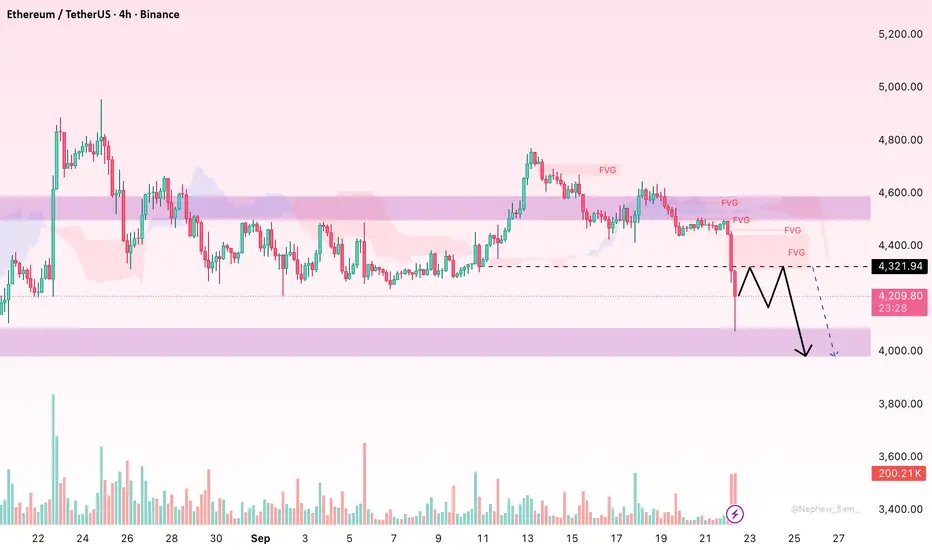
On the H4 chart the recent red candle in ETH was a textbook flush: price plunged straight below the Ichimoku Cloud, selling volume spiked, and a large cluster of FVGs has formed overhead around 4.32k–4.40k. This setup typically favours a technical rebound to fill those gaps before the market chooses its next direction.
Why did ETH fall so sharply?
First, mass liquidation of leveraged positions: this morning alone, hundreds of millions in long positions were wiped out, with ETH accounting for a significant share, intensifying the move lower.
Second, deteriorating ETF flows: after a period of strong inflows, spot ETH ETFs saw heavy redemptions in early September (from ~$505M to ~$952M within days), adding supply as investors took profit or rotated into BTC.
Third, risk-off sentiment ahead of the Fed and lingering regulatory uncertainty around ETH ETFs—particularly the delayed review of staking features—has curbed appetite. Finally, the wider crypto market saw broad-based selling, wiping out tens of billions in market cap and dragging ETH down with it.
From a technical view, I expect ETH to rebound toward 4.32k–4.36k (lower FVG edge, possibly extending to 4.38k–4.40k near the Cloud) to retest supply. If selling pressure re-emerges there, price is likely to reverse toward 4.08k–4.02k, retesting the recent absorption zone. Holding 4.02k could allow another attempt back at 4.32k; breaking and closing H4 below 4.02k, however, opens risk toward ~3.98k.
Only if ETH closes above 4.40k–4.43k on H4 (escaping the FVG and regaining the Cloud) would I consider a scenario of building a higher base.
What about you—do you lean towards “rebound to sell” or “base building for a reversal”?
This Volatility Period:Around September 24th(September 23rd-25)
Hello, traders!
Follow us to get the latest information quickly.
Have a great day!
-------------------------------------
(ETHUSDT 1D Chart)
This Volatility Period: Around September 24th (September 23rd-25th)
Before this volatility period began, the price fell below 4403.87 and then fell to the 3900.73-4107.80 range.
The 4403.87-1749.30 range, which corresponds to the HA-High ~ DOM (60) range, is likely to act as resistance, as it represents a high point.
The 3900.73-4107.80 range represents the previous all-time high (ATH). If the price remains above this range, the uptrend is likely to continue.
Therefore, the key question is whether the price can find support in the 3900.73-4107.80 range and rise above the 4403.87-4749.30 range.
After this volatility period, we should examine whether the price can find support in the 3900.73-4107.80 range.
If not, support around 3265.0-3438.16 is crucial.
-
If the OBV indicator falls below the Low Line, the price is likely to decline again.
Therefore, support around 3900.73-4107.80 is crucial.
-
The basic trading strategy is to buy in the DOM(-60) ~ HA-Low range and sell in the HA-High ~ DOM(60) range.
Considering this basic trading strategy, it may be natural for the price to decline since it failed to rise above 4403.87-4749.30.
Since it fell in the HA-High ~ DOM(60) range, it is likely to decline until it meets the DOM(-60) or HA-Low indicator.
However, since important support and resistance points or zones have formed, the trend can reverse at any time depending on whether support is found at those points or zones.
In this sense, the K value of the StochRSI indicator is in the oversold zone, suggesting a potential uptrend in the near future.
While the K value of the StochRSI indicator is in the oversold zone, the possibility of further decline is high. However, the established support and resistance zones increase the likelihood of turning this crisis into an opportunity.
In this situation, what we can do is confirm the signs of an uptrend.
Otherwise, if we anticipate a new trade in advance, we may face another crisis as the volatility period progresses.
-
If you are currently trading, there is an opportunity to sell in the first installment when resistance is encountered in the 4403.87-4749.30 zone.
As mentioned earlier, this is based on the basic trading strategy.
Depending on whether support is found in the 3900.73-4107.72 range, you'll decide whether to sell in two installments or buy.
Since the stock market trades in single-share increments, selling before the price has more than doubled from the purchase price makes it difficult to buy again.
However, the coin market allows for decimal trading, making trading easier than in the stock market.
This freedom of buying and selling is the biggest advantage of the coin market.
If your buy price is below 3900.73, buying when the 3900.73-4107.80 range shows signs of support will increase your average buy price, potentially putting you under psychological pressure.
However, as mentioned earlier, the coin market allows for decimal trading, making it possible to separate your buy price into separate trades.
Therefore, you can record the purchase price and purchase amount separately, differentiating them from the existing average purchase price, and then trade them separately.
If you understand this principle, you'll find the coin market much easier to trade than the stock market.
This is one of the reasons why even those who have successfully traded in the stock market often fail in their initial trading in the coin market.
-
Thank you for reading to the end.
I wish you successful trading.
--------------------------------------------------
- Here's an explanation of the big picture.
(3-year bull market, 1-year bear market pattern)
I'll explain more in detail when the bear market begins.
------------------------------------------------------

ETHUSDT 1D chart Review1. Trendline (orange) - was clearly pierced down → it is a signal of weakening the growth moment.
2. Horizers of support / resistance:
• Resistance: $ 4,604 (strong), above $ 4,960.
• Support: $ 4 150 (currently tested), next $ 3,958 and $ 3,696.
3. Price - currently ~ 4 169 $, i.e. right with the support of $ 4 150.
4. Candles - a strong inheritance candle after piercing the trend → weakness signal.
5. STOCHASTIC RSI - in the sales zone (<20), which may suggest the possibility of short -term reflection.
⸻
🔹 Application:
• Short date: possible reflection from $ 4 150 thanks to the sale (technical bounce).
• average date: If level $ 4 150 breaks and the candle closes below → the road opens to $ 3,958 and even $ 3,696.
• Only a return above $ 4 272 and a retest trendline from below would give a signal of buyers.
⸻
👉 To sum up: The market is in the critical zone - support $ 4 150 decides.
• Bull: keeping the defense of this level + reflection from the sale.
• Bear: loss $ 4 150 = greater correction in the direction of $ 3 950–3 700.

ETH Oversold Again – Is a Bounce Coming?Ethereum (ETHUSDT) on the 4H chart is showing signs of oversold conditions as the RSI once again dips below the 30 level. This setup has historically aligned with local bottoms, where ETH tends to bounce back shortly after reaching such extreme levels of selling pressure. The current price action around $4,170 highlights a critical zone to monitor for potential reversal.
If ETH can hold this level and buying momentum steps in, a relief rally could follow in the short term. However, if weakness persists, further downside retests cannot be ruled out. Traders should closely watch RSI recovery and volume confirmation for signals of a stronger rebound.

ETH Analysis: Deeper Pullback in PlayETH is still trading within a broader uptrend channel, but recently, the price has started to pull back after a significant rally. After pushing up too far, the market is now taking a breather and recalibrating.
From a technical standpoint, this pullback is completely normal and healthy after such a strong move. Pullbacks like this are part of any bullish trend, providing the market a chance to reset. If the pullback continues, the next target could be the 3,600 support area, where multiple key factors converge: horizontal support, trendline support, and the 0.618 Fibonacci retracement level.
The 3,600 level is crucial. If ETH holds strong here and shows signs of a reversal, it could be a solid entry point for the next leg up. However, if the price breaks below this level, we may see deeper downside, and the current bullish structure could start to break down.
As always, confirm your setups before entering and make sure your risk management is solid. Stay alert for the next opportunities!

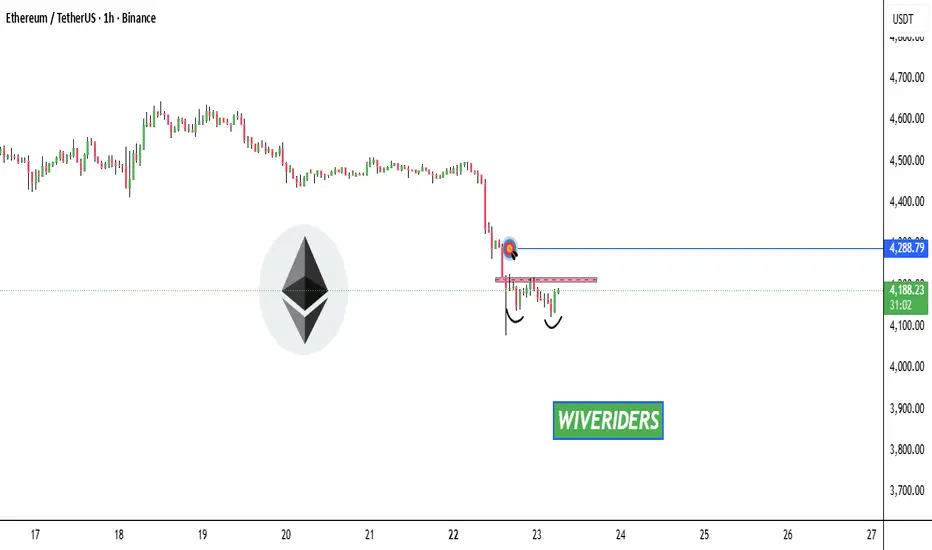
ETH 1H Analysis - Key Triggers Ahead | Day 26❄️ Welcome to the cryptos winter , I hope you’ve started your day well.
⏰ We’re analyzing ETH on the 1-Hour timeframe.
👀 On the 1-hour timeframe, Ethereum is currently ranging after its recent drop, sitting in a decision-making zone. It already faked the range low once and bounced back up, creating a clean trading structure. If ETH breaks above the $4,210 resistance, it could complete its correction and push higher. On the other hand, if ETH continues its deeper correction, a break and confirmation below the $4,135 support would open the way to lower levels.
🧮 Looking at the RSI oscillator, it’s now hovering around the 50 zone. A cross above 51 could trigger a bullish breakout, while a cross below 35 would suggest Ethereum is heading for a deeper correction.
🕯 Candle size and volume have shrunk inside this range, showing clear consolidation. Buyers and sellers are in a tug-of-war, and we’d prefer not to trade in these tight squeezes with heavy volume until a clear winner emerges. A breakout of the range will likely need strong “whale candles” to confirm direction.
💸 The ETH/BTC pair also shows a similar structure — after its recent drop, it has entered a tight consolidation pattern that mirrors the price action seen against USDT.
🧠 For trading ETH, patience is key. Wait to see which side Ethereum chooses to break out from. Once the range high or low (outlined above) is taken out with confirmation, we can look for a position in that direction.
❤️ Disclaimer : This analysis is purely based on my personal opinion and I only trade if the stated triggers are activated .
ETH is Sinking Deep: Strong Downtrend and Big SELL Opportunity!Currently, ETH/USDT is under strong selling pressure due to both fundamental and technical factors . According to the latest news, over 2.6 million ETH (equivalent to about $11.7 billion ) is waiting to be withdrawn from the Ethereum network. When these ETH are released, it will create significant selling pressure, greatly affecting ETH's price in the short term. This could lead to investor anxiety and a potential sell-off, diminishing confidence in the market.
From a technical perspective , the chart shows a descending wedge, with lower highs and the current bottom becoming weak. It is highly likely that ETH will drop to the support level at $4,110 before making any new moves.
Given these factors, the appropriate trading strategy is to open a SELL order if the price cannot break through the resistance at $4,410 and falls below the support at $4,110. The Stop Loss should be placed at $4,450, just above the resistance, and Take Profit at $4,110.
In conclusion, ETH is facing a strong downtrend in the short term. Investors should keep an eye on the market and open a SELL order as the price continues to drop.

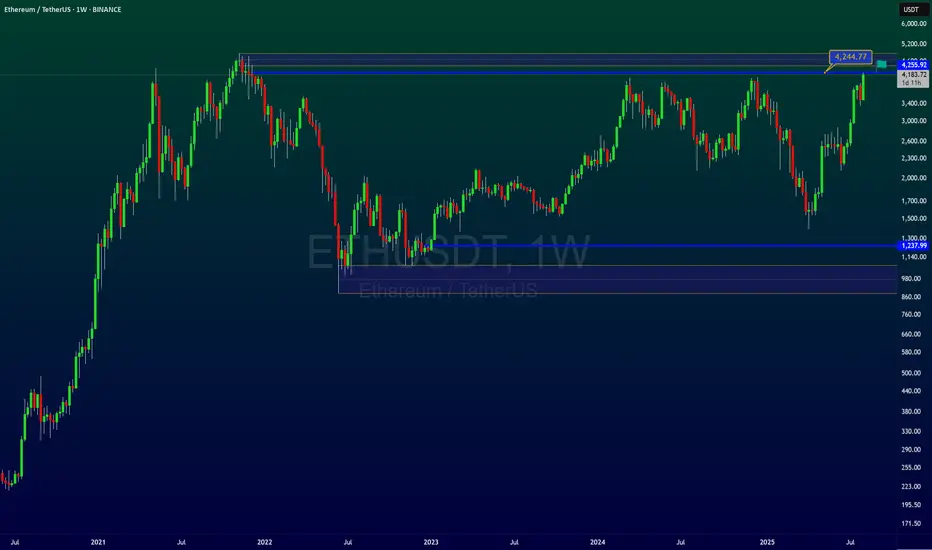
ETH ANALYSISETH has broken above the long-term trendline, a major structural shift on the weekly chart.
From here, I think price may pull back to retest the trendline along with the bull market support band.
If that retest holds and momentum stays constructive, ETH could bounce strongly and eventually push toward making a new all-time high.
🎯 Conclusion: My view is bullish in the bigger picture — I expect ETH to retest the trendline and bull market support band before attempting a major breakout to new highs.

ETH/USDTCurrently trading in a local consolidation, moving within its range expansion.
After a deviation below the range low, long setups can be considered — but only if confirmation conditions are met.
Potential short opportunities may appear in the 4400–4500 zone, again only with proper confirmations.

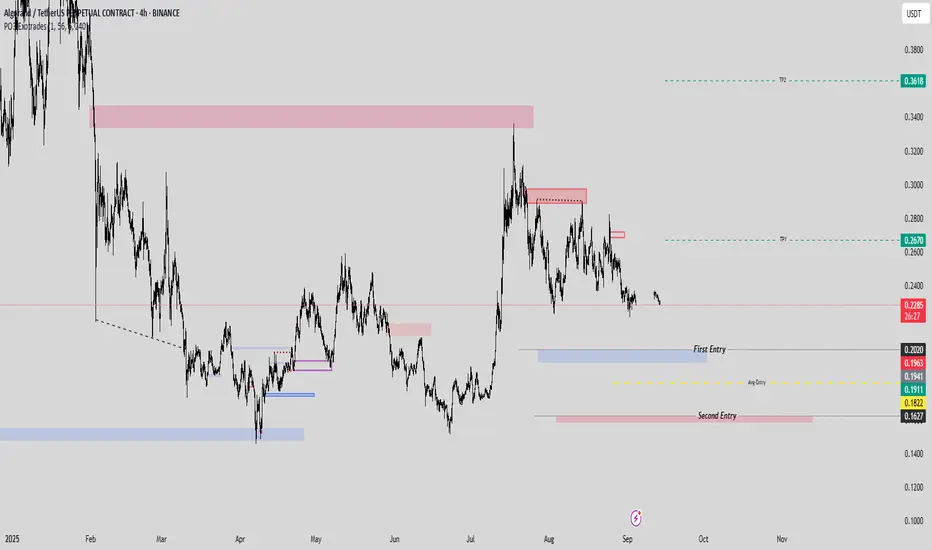
ALGO/USDT Double-Entry Precision Signal with 80% profitHere’s a strategic setup for #ALGOUSDT designed to lock in gains and eliminate downside risk through a two-tiered entry.
- Entry 1: 0.2020
- Entry 2: 0.1627 (purely to reduce overall trade risk; not a profit-seeking leg)
- TP1: 0.2670 (take 50% off the table)
- TP2: 0.1627
---
After TP1 is hit and you’ve secured half your position, shift your stop to breakeven on the remaining size. You can free-risk by moving your stop in the platform or setting a manual alert once 0.2670 is reached. This ensures the rest of the trade carries zero risk while letting profits run.
---
Note: the second entry point isn’t aimed at generating additional profit—it serves solely to widen your safety net and lower the average cost of your position. Trade smart, manage risk, and let the market work in your favor.
BINANCE:ALGOUSDT.P
ETH this week: stabilization after liquidations and ETF flows inFundamental approach
- ETH prices slipped this week amid a broad crypto pullback following a weekend wave of leveraged liquidations and profit-taking, even as prior spot ETF inflows and easing Fed policy supported risk appetite earlier in the week. Sentiment was volatile as traders digested mixed ETF flow signals and macro easing after the Fed's rate cut.
- The main impacting factors included a reported $1.5B in crypto long liquidations, which are pressuring majors. ETH prices posted their weakest two-day stretch since late Aug as risk unwound into Monday's session. Offsetting factors were mid-Sep net inflows into US spot ETH ETFs, led by BlackRock's product, and growing anticipation for Dec's Fusaka upgrade aimed at scaling Layer 2 data capacity.
- In the near term, ETH could stabilize if ETF flows remain favorable and macro conditions stay supportive; however, further deleveraging and data-sensitive risk sentiment could keep swings elevated. Upcoming catalysts include continued daily ETF flow prints, developer communications around the Fusaka timeline, and features that may influence medium-term adoption.
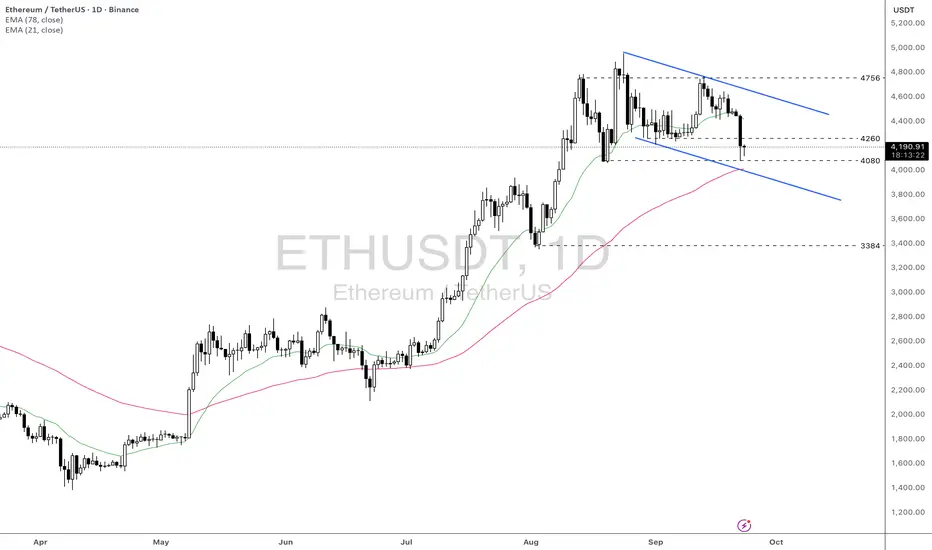
Technical approach:
- ETHUSD is forming a lower high and lower low pattern within the defined range of 4080-4756. The price is awaiting a clear breakout to determine the upcoming trend.
- If ETHUSD breaks below the support at 4080, EMA78, and the descending channel's lower bound, the price may retest the following support at 3384.
- On the contrary, closing above 4260 may help ETH prices gain momentum to retest the descending channel's upper bound.
Analysis by: Dat Tong, Senior Financial Markets Strategist at Exness
ETH all time high or reverse????Ethereum has returned to the top after a long time and is on the verge of breaking the top, but in my opinion this will not happen. Of course, it is possible to see new prices, but then it will enter a correction and this will happen in the next move that will start in the future.
So we should wait for a very good entry with a cheap and lower price.
Stay with me and boost me after introducing me to your friends.
ETH has formed a potential Double Bottom pattern 📊 CRYPTOCAP:ETH Market Update
CRYPTOCAP:ETH has formed a potential Double Bottom pattern ✅
It’s now testing the red resistance zone 🔴 — if it breaks out with confirmation, the first target will be the blue line level 🎯
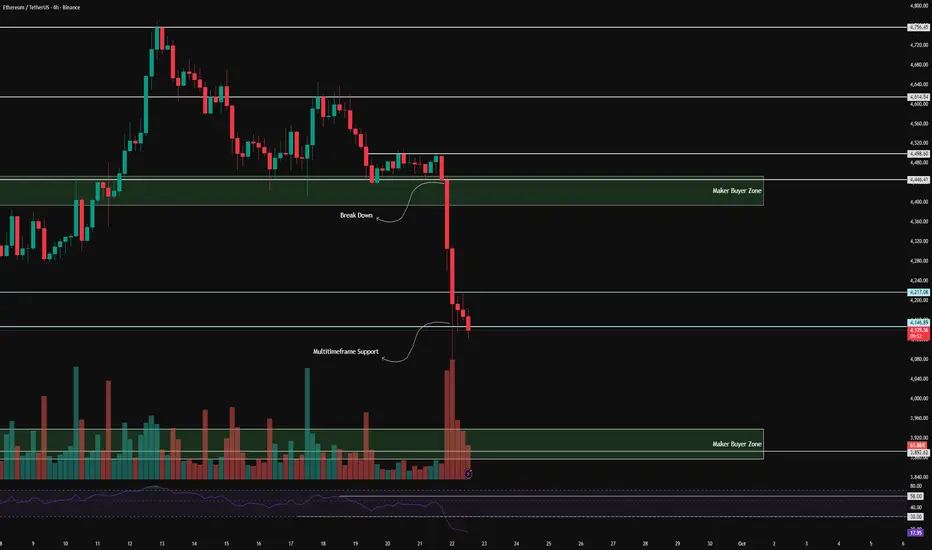
ETH 4H Analysis - Key Triggers Ahead | Day 25😃 Hey , how's it going ? Come over here — Winter got something for you!
⏰ We’re analyzing ETH on the 4-Hour timeframe.
👀 On the 4H timeframe for Ethereum, we can see that after breaking below its maker-buyer zone, ETH moved down toward lower support levels, experiencing a **7% drop** — an unexpected move that even pushed major holders to sell. Ethereum is now sitting at a **multi-timeframe support zone**, and if this level is lost, it could head toward the next lower maker-buyer area, where we’ll need to observe how price reacts.
🧮 The **RSI oscillator** shows ETH deep in the **oversold zone** with heavy selling pressure. Buyers have yet to step in, meaning that with more sell-side momentum, Ethereum could remain oversold for an extended period.
🕯 The **size and volume of red candles** have increased sharply in a short span of time. This fast move down with fewer candles signals **strong selling sentiment**, while price itself looks uncertain about its next direction.
💸 Looking at **ETHBTC**, the pair experienced a sharp drop and deep correction with the start of the new week. It is also resting at a multi-timeframe support zone. If that breaks, Ethereum could face a further correction.
🧠 As for positioning, it’s still early. We’d prefer to wait for the market to build a stronger structure and possibly a wider range before entering. A **short position below the 4147 support** is possible with low risk, but since RSI remains heavily oversold, we must also consider the potential for a **price rebound**.
❤️ Disclaimer : This analysis is purely based on my personal opinion and I only trade if the stated triggers are activated .
ETH New Update (4H)This analysis is an update of the analysis you see in the "Related publications" section
Honestly, as you know, the market had been ranging for several days without much movement. On the chart, we had signs of a drop, but the drop didn’t happen, and instead the market dropped in a way that was shown.
Considering that the demand zone has held and the market is still ranging, we can return to the scenario of (this analysis () and expect to see some recoveries from Ethereum.
Either Ethereum can get rejected from the identified supply zone, or it can make a new all-time high afterwards.
For risk management, please don't forget stop loss and capital management
When we reach the first target, save some profit and then change the stop to entry
Comment if you have any questions
Thank You

ETHUSDTHello Traders! 👋
What are your thoughts on Ethereum?
Ethereum has recently broken above the key resistance area near 4100, printing a new high slightly above the previous peak. After this breakout, price action has entered a corrective phase, suggesting a healthy pullback.
This correction is currently forming a bullish flag pattern, which may act as a continuation setup.
As long as ETH remains above the highlighted support zone, the bullish scenario remains valid. A confirmed breakout from the flag formation could trigger the next impulsive wave, potentially leading to fresh all-time highs.
Keep a close eye on the flag breakout and watch for bullish momentum to resume once the consolidation completes.
Don’t forget to like and share your thoughts in the comments! ❤️
