$EWT > #BITCOIN ?$EWT is basically one of my new bitcoin bags its looking to go up from here epect gains in the next 4-8 hours lets see if this is a strong enough trend for higher time windows
EWT

$CSCO short setup if market turns in next couple of weeksplease share thoughts particularly if you use elliot wave and can give feedback. room to run within macro channel but other factors considered i think it completes wxyxz and macro X within 10 days.
thank you.

TTWO - Technical MarkupSomeone asked me to do a markup on this ticker as well - figured I'd post it too.


DXY (Dollar Index)In the DXY, it currently looks like we are in the last legs of the downward movement. Here, an implied EDT could be developing as a white v of the red (c). Thus, a downward wave would still be missing. The ideal target, the 1.00 extension, of the pink Y would be fairly close to the trendline drawn below. However, for me, a close below the last low would be enough to finish counting the movement. Of course, this also implies that there are still more highs/lows to come in the single pairs before the dollar should start its run.

US30 (Dow Jones)Just as in the Dax, another high could be in store for the Dow. However, I think this scenario is more likely in the Dow. In this case, the Dow would also have only one more x built-in on Friday. I have rebuilt my count a little compared to the last post, by placing the red x of the orange (z) now on the low at 29430. In the now running yellow circled z we would have here an ideal target of 31980 in whose proximity is also the 1.00 extension of the red y. This is at 31749, so that a run-up to this area is currently the most likely scenario. However, my last count remains valid until the break of the high.

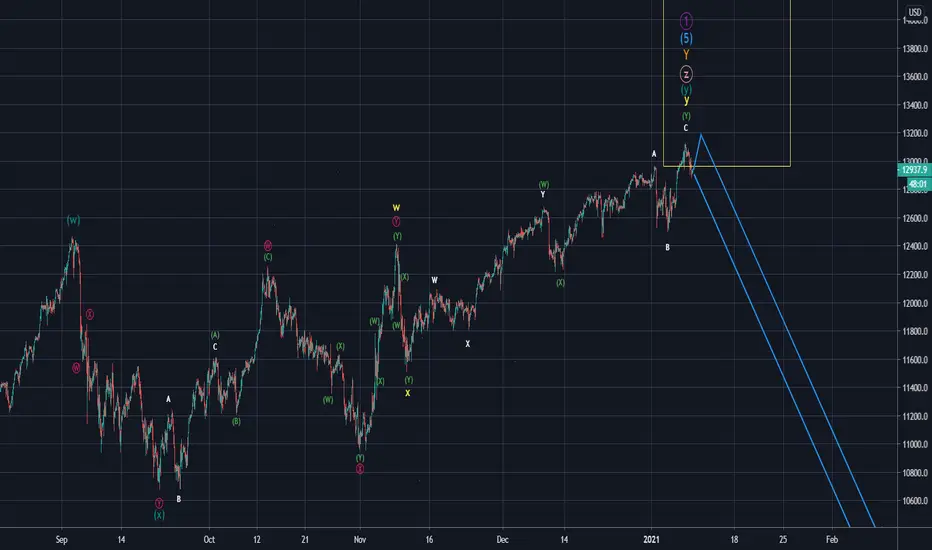
USTech100 (NASDAQ)In the Nasdaq, too, a further high currently seems more likely than the direct way down. But also here I would like to emphasize again that this is not a necessary and the last posted count until the break of the high is still valid. In the yellow y, we have already left the 1.00 extension behind us. However, I have noticed that unlike in many other markets, the Nasdaq often runs to the area between the 1.272 and the 1.382 extension to complete a wave. Unfortunately, I can no longer draw in smaller units, as the white letters already represent the minus scale degree. Therefore, just think here another abc of which the c wave is still outstanding. Target here would be the area between 13340 and 13609.

GER30 (DAX)As described in my last analysis, the Dax has reached with the last high at 14137 only the minimum target, in the form of the 0.618 extension, of the yellow circled z. In all other waves, the mandatory targets have already been reached. However, there is still potential to the upside. So far, only the 0.618 extension has been reached in the pink (z). The next level the 0.786 extension is at 14204. In the drawn alternative, we would have with the high at 14137 only the green Alt. (w) of the yellow circled z completed and with the Friday low the green Alt. (x) finished. Should the market still aim for a new high from here, the ideal target here would be at 14235. In the vicinity of which also lies the mentioned 0.786 of the pink (z). From therefore a quite attractive target, which I like in principle much better than the current all-time high. What speaks against it, however, is that the market has run in late Friday trading again towards the low instead of clearly break away from it.
A decision will probably be made early in the next trading week. Ultimately, the DAX is very likely to suffer significant losses soon and a new high, would only delay this by a few days.

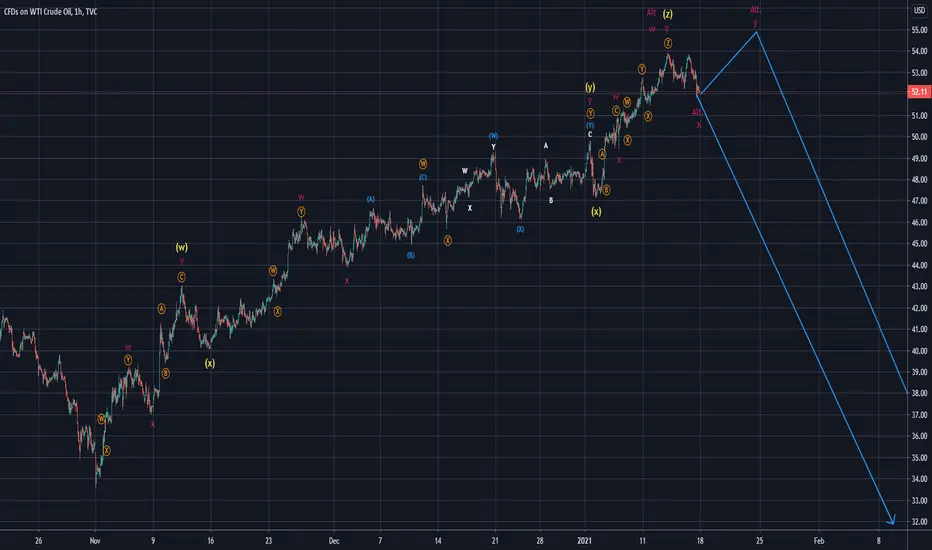
USOil (WTI)Due to the fall of the May contract into negative territory, oil can hardly be counted superordinate, as this is not provided in the EWT. Therefore, I have here only the last movement counters. Here it is not yet quite clear whether the final yellow (z) only the red w (here Alt. w) was completed or whether it was already completed. The 0.618 minimum target was reached in any case, so that a further rise would not be mandatory.
NZDUSDI also expect the dollar to make a comeback in this pair. Looking at the monthly chart, I am currently still missing a low, so I see the rise since the low in March only as the green X. I expect another low which should find its end in the area of the low in 2009. It is currently not quite clear whether another high is missing before the market goes into reverse gear.

Gold long term countTaking a closer look at the yellow precious metal, we have to state that, as in many forex pairs, an impulsive count is not possible and the market only forms 3-3-3 patterns.Looking at the current upward movement since 2015 and especially the run after the low in March is clearly a three-wave pattern. The question here is whether we have already reached the high, for this speaks that in the last movement in the yellow (wxy) the ( y ) has exactly hit the 1.00 extension or whether the market still reaches the 1.00 extension of the red circled Y to complete the complete upward pattern, which has formed since the beginning of the 20th century. In the blue C, the 1.00 extension is at 2108 that of the Y circled in red at 2285.

USDJPY In this pair, it is currently not quite clear to me whether the white circled X was actually already completed or whether here after the completion of the blue C still follows a downward wave. Which should ideally break the low in 2016 at 98.7 once again. With a view to the other dollar pairs, however, I have decided for this count.


NASDAQ 100 (USTech100)The Nasdaq may now have finally ended its upward momentum that began in 1985. The mandatory target of the superior wave 2, which should have been started now, is the 38.2 retracement of the entire movement and is currently at 8125. The downward movement since the high can be counted as a five-wave and thus represents a first important indication for the correction that is now starting to take place.
EURUSD 4hI have checked all my forex analyses again extensively in the last few days and have to discard my last EURUSD count, also with a view to the other dollar pairs. Basically, there is still some upside potential here. But the movement can also be counted finished. So that now the blue C could have been started.

EURUSD LongtermI have checked all my forex analyses again extensively in the last few days and have to discard my last EURUSD count, also with a view to the other dollar pairs. Basically, there is still some upside potential here. But the movement can also be counted finished. So that now the blue C could have been started.

AUDUSDIn the big picture, the last wave of the downward movement that started in 2011 should now be in place. Contrary to the count of the many, the movement since the low in March can in no way be counted impulsively. We have now probably completed the yellow X as a complex corrective pattern. The pair should now run again to the area of the 2008 low to complete the movement.

US500 (S&P500)The upward movement might have been completed with the last high. However, only the 0.618 of the red ( y ) was reached here so far. I would primarily assume here that a high in the region of 3867 is still missing before the market turns.

GBPUSDIn Sterling, two options are currently conceivable. Either the downward movement was completed with the low in March and the market is currently in the white (X) of the circled red X (marked as Alt.). Or the market has formed an overshooting X at the low in March and the current movement already completes the red circled X. Looking at the other dollar pairs, I would prefer the main scenario here.

USDCHFAdmittedly, this pair is basically not too nice to count. I still did my best and this is the most likely count for me at the moment. What must of course always be taken into account with the corrective count is that the market can always still attach another corrective pattern. So the movement can be counted finished, but if it's really finished, only the future will show. It is possible that the 5 circled in green forms a Zig Zag and is therefore not yet finished. The target for this scenario would be 0,8721.

USDCADIt is currently not entirely clear in the USDCAD whether the downward movement in the form of the orange Y was completed or whether the yellow circled y was completed first. In the first scenario, the complete labeling would have to be set to a higher degree. To make the first scenario recognizable, I have drawn in here with Alt. In any case, the dollar should rise again in the coming weeks. It is possible that a small downward wave is still missing in the blue c.


