Exponentialmovingaverage


LTCUSD Litecoin CryptocurrencyApproaching Price Targets 144.00 and 146.00. So far, price action is moving as planned. We got the pull back into dynamic support and resistance which is the exponential moving average period 10 and exponential moving average period 20. We got a pull back to price level 124.50. We got a price action signal which was a bullish engulfing bar after the breakout... after closing above 124.50.
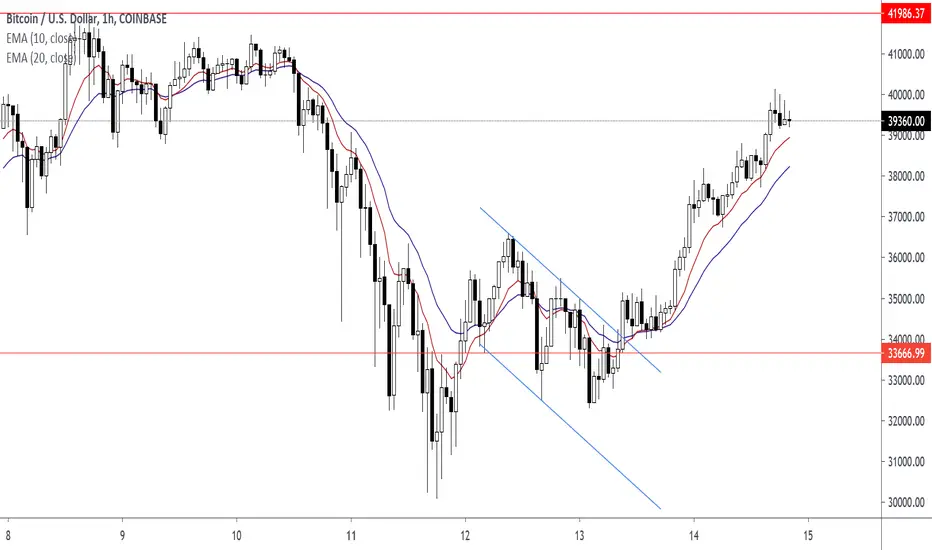
Now a channel formed and the channel diagonal level was retested with pin bar/rejection candle.


BTC | Waiting for that last gaspExciting times
BTC broke the psychological resistance, but without consistency, and I'm in the opinion that it can not be sustained for the long term
I'm not sure where the top will be, so I based the potential run on the last bull run that happened in late 2017 while taking into account
that there are bigger players in the market now. I've kept in mind that the fundamentals are telling me that institutions are FOMOing
into the market along with the rest of the retail investors which could be one of the primary driving factors.
Assuming we see anywhere between a 2x to 4x move, with the 2x being shown to remain conservative,
I've outlined potential areas where the next bear run could take over while expecting a future rebound
that would create a higher breakout based on a 2 - 4 year timeline
Based on historical data, we can safely assume that a proper correction will have anywhere between a 30% to 80% drop from the top.
We have yet to see this, so I'm waiting for that last gasp in which I'll be buying incrementally on the way down as momentum fades
This run is a long term game and could last anywhere from the end of the month as well as into next spring,
but I do remain in the opinion that BTC will correct at some point returning to a higher low in which the next
accumulation phase will begin and it will most likely be the last time we see anything below the $20k range
Right now is the time to be taking profits, and observing, while waiting for those small corrective dips on the way up to
build on those returns. So far, the market seems persistent on setting a new ATH and that is yet to be seen
Regardless, I expect to see some interesting market moves in either direction before we return to the $12k - $20k range
where new support will take place and bigger players will plan to buy up while the rest of the market cools down
So far, the 20 week and 50 week are still showing numbers in the teens and we will have to test these areas at some point
on the lower bound.
In conclusion, I think overall that BTCs future is bright and that in the long term it will do more than just compete
with national currencies and international regulatory bodies.


What Are These Moving Averages?Moving averages rely on past data, they are considered to be lagging or trend following indicators. Regardless, they still have great power to cut through the noise and help determine where a market may be heading.
Different types of moving averages
There are various different types of moving averages that can be used by traders. Despite the various types, the MAs are most commonly broken down into two separate categories: simple moving averages (SMA) and exponential moving averages (EMA). Depending on the market and desired outcome, traders can choose which indicator will most likely benefit their setup.
The simple moving average
The SMA takes data from a set period of time and produces the average price of that security for the data set. The difference between an SMA and a basic average of the past prices is that with SMA, as soon as a new data set is entered, the oldest data set is ignored. So if the simple moving average calculates the mean based on 10 days worth of data, the entire data set is constantly being updated to only include the last 10 days.
It's important to note that all data inputs in an SMA are weighted equally, regardless of how recently they were inputted. Traders who believe that there's more relevance to the newest data available often state that the equal weighting of the SMA is detrimental to the technical analysis. The exponential moving average (EMA) was created to address this problem.
The exponential moving average
EMAs are similar to SMAs in that they provide technical analysis based on past price changes. Nevertheless, the equation is a bit more complicated because an EMA assigns more weight and value to the most recent price inputs. Although both averages have value and are widely used, the EMA is more responsive to sudden price fluctuations and reversals.
Cause EMAs are more likely to project price reversals faster than SMAs, they are often especially preferred by traders who are interested in short-term trading. It is important for a trader or investor to choose the type of moving average according to his personal strategies and goals, adjusting the settings accordingly.
MAs of 50, 100, and 200 days are the most commonly used.
How to trade with MA?
Generally, a rising MA suggests an upward trend(acts as a support when rising under a price) and a falling MA indicates a downtrend(acts as resistance when falling above a price). Though, a moving average alone is not a really reliable and strong indicator. Therefore, MAs are constantly used in combination to spot bullish and bearish crossover signals.
A crossover signal is created when two different MAs crossover in a chart. A bullish crossover (also known as a golden cross) happens when the short-term MA crosses above a long-term one, suggesting the start of an upward trend. In contrast, a bearish crossover (or death cross) happens when a short-term MA crosses below a long-term moving average, which indicates the beginning of a downtrend.
One major downside of MAs is their delay time. Since MAs are lagging indicators that consider previous price action, the signals are often too late. For example, a bullish crossover may suggest a buy, but it may only happen after a significant rise in price.
This suggests that even if the uptrend continues, potential profit may have been lost in that period between the rise in price and the crossover signal. Or even worse, a false golden cross signal may lead a trader to buy the local top just before a price drop. These fake buy signals are usually referred to as a bull trap.
To put it all in a nutshell, Moving Averages are powerful TA indicators and one of the most widely used. The ability to analyze market trends in a data-driven way provides great penetration into how a market is performing. Remember that MAs and crossover signals should not be used alone and it is always more reliable to combine different TA indicators in order to avoid fake signals.
Best regards EXCAVO

Copper Target Price 3.3135Entry at Exponential Moving Average (10 Period).
Bullish Flag. Descending Channel. Trend Is Up. Uptrend. Pin Bar Candlestick.
