Bullish bounce setup?EUR/GBP is falling towards the pivot and oculd bounce to the 1st resistance which acts as a swing high resistance.
Pivot: 0.8678
1st Support: 0.8658
1st Resistance: 0.8712
Disclaimer:
The above opinions given constitute general market commentary, and do not constitute the opinion or advice of IC Markets or any form of personal or investment advice.
Any opinions, news, research, analyses, prices, other information, or links to third-party sites contained on this website are provided on an "as-is" basis, are intended only to be informative, is not an advice nor a recommendation, nor research, or a record of our trading prices, or an offer of, or solicitation for a transaction in any financial instrument and thus should not be treated as such. The information provided does not involve any specific investment objectives, financial situation and needs of any specific person who may receive it. Please be aware, that past performance is not a reliable indicator of future performance and/or results. Past Performance or Forward-looking scenarios based upon the reasonable beliefs of the third-party provider are not a guarantee of future performance. Actual results may differ materially from those anticipated in forward-looking or past performance statements. IC Markets makes no representation or warranty and assumes no liability as to the accuracy or completeness of the information provided, nor any loss arising from any investment based on a recommendation, forecast or any information supplied by any third-party.
F-EUR

Bullish continuation above key support?EUR/CAD is falling towards the pivot, which serves as a pullback support that aligns with the 50% Fibonacci retracement and could bounce back to the 1st resistance, which acts as a pullback resistance.
Pivot: 1.61864
1st Support: 1.61261
1st Resistance: 1.63589
Disclaimer:
The above opinions given constitute general market commentary, and do not constitute the opinion or advice of IC Markets or any form of personal or investment advice.
Any opinions, news, research, analyses, prices, other information, or links to third-party sites contained on this website are provided on an "as-is" basis, are intended only to be informative, is not an advice nor a recommendation, nor research, or a record of our trading prices, or an offer of, or solicitation for a transaction in any financial instrument and thus should not be treated as such. The information provided does not involve any specific investment objectives, financial situation and needs of any specific person who may receive it. Please be aware, that past performance is not a reliable indicator of future performance and/or results. Past Performance or Forward-looking scenarios based upon the reasonable beliefs of the third-party provider are not a guarantee of future performance. Actual results may differ materially from those anticipated in forward-looking or past performance statements. IC Markets makes no representation or warranty and assumes no liability as to the accuracy or completeness of the information provided, nor any loss arising from any investment based on a recommendation, forecast or any information supplied by any third-party.

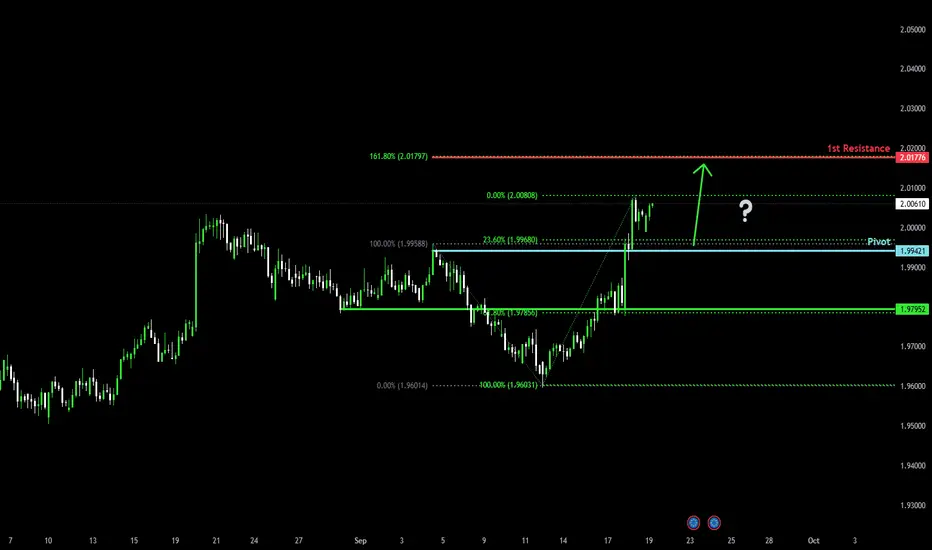
Bullish momentum to extend?EUR/NZD is falling toward the pivot and oculd bounce to the 1st resistance which aligns with the 161.80% Fibonacci extension.
Pivot: 1.99421
1st Support: 1.97952
1st Resistance: 2.01776
Disclaimer:
The above opinions given constitute general market commentary, and do not constitute the opinion or advice of IC Markets or any form of personal or investment advice.
Any opinions, news, research, analyses, prices, other information, or links to third-party sites contained on this website are provided on an "as-is" basis, are intended only to be informative, is not an advice nor a recommendation, nor research, or a record of our trading prices, or an offer of, or solicitation for a transaction in any financial instrument and thus should not be treated as such. The information provided does not involve any specific investment objectives, financial situation and needs of any specific person who may receive it. Please be aware, that past performance is not a reliable indicator of future performance and/or results. Past Performance or Forward-looking scenarios based upon the reasonable beliefs of the third-party provider are not a guarantee of future performance. Actual results may differ materially from those anticipated in forward-looking or past performance statements. IC Markets makes no representation or warranty and assumes no liability as to the accuracy or completeness of the information provided, nor any loss arising from any investment based on a recommendation, forecast or any information supplied by any third-party.
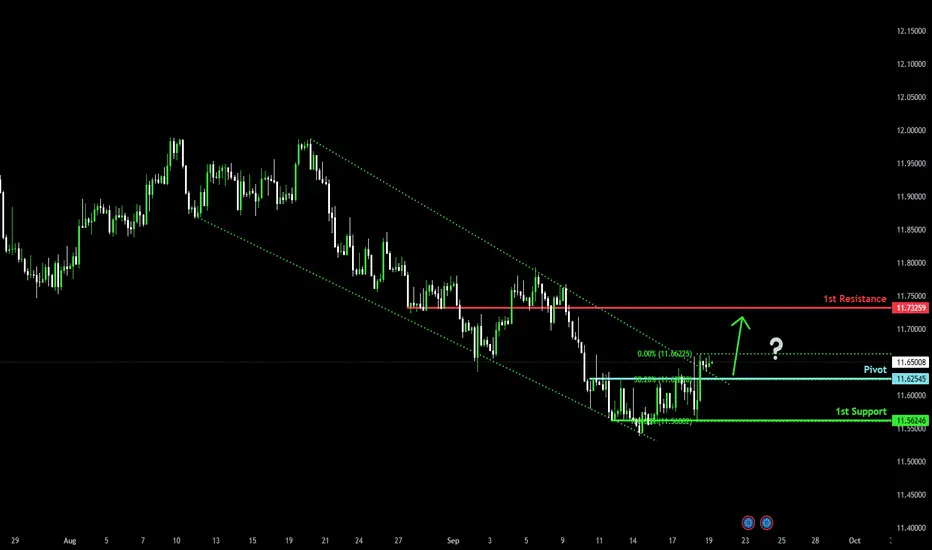
Bullish reversal at key support?EUR/NOK is falling towards the pivot which acts as a pullback support that aligns with th 38.2% Fibonacci retracement and could bounce to the 1st resistance.
Pivot: 11.62545
1st Support: 11.56246
1st Resistance: 11.73259
Disclaimer:
The above opinions given constitute general market commentary, and do not constitute the opinion or advice of IC Markets or any form of personal or investment advice.
Any opinions, news, research, analyses, prices, other information, or links to third-party sites contained on this website are provided on an "as-is" basis, are intended only to be informative, is not an advice nor a recommendation, nor research, or a record of our trading prices, or an offer of, or solicitation for a transaction in any financial instrument and thus should not be treated as such. The information provided does not involve any specific investment objectives, financial situation and needs of any specific person who may receive it. Please be aware, that past performance is not a reliable indicator of future performance and/or results. Past Performance or Forward-looking scenarios based upon the reasonable beliefs of the third-party provider are not a guarantee of future performance. Actual results may differ materially from those anticipated in forward-looking or past performance statements. IC Markets makes no representation or warranty and assumes no liability as to the accuracy or completeness of the information provided, nor any loss arising from any investment based on a recommendation, forecast or any information supplied by any third-party.
Bearish reversal off 61.8% Fibonacci resistance?USD/CAD is rising towards the resistance level, which is an overlap resistance that aligns with the 61.8% Fibonacci retracement and could reverse from this level to our take profit.
Entry: 1.3831
Why we like it:
There is an overlap resistance that aligns with the 61.8% Fibonacci retracement.
Stop loss: 1.3879
Why we like it:
There is a pullback resistance.
Take profit: 1.3729
Why we like it:
There is a pullback support level.
Enjoying your TradingView experience? Review us!
Please be advised that the information presented on TradingView is provided to Vantage (‘Vantage Global Limited’, ‘we’) by a third-party provider (‘Everest Fortune Group’). Please be reminded that you are solely responsible for the trading decisions on your account. There is a very high degree of risk involved in trading. Any information and/or content is intended entirely for research, educational and informational purposes only and does not constitute investment or consultation advice or investment strategy. The information is not tailored to the investment needs of any specific person and therefore does not involve a consideration of any of the investment objectives, financial situation or needs of any viewer that may receive it. Kindly also note that past performance is not a reliable indicator of future results. Actual results may differ materially from those anticipated in forward-looking or past performance statements. We assume no liability as to the accuracy or completeness of any of the information and/or content provided herein and the Company cannot be held responsible for any omission, mistake nor for any loss or damage including without limitation to any loss of profit which may arise from reliance on any information supplied by Everest Fortune Group.

Potential bearish drop?GBP/USD is rising towards the resistance level, which is a pullback resistance and could reverse from this level to our take profit.
Entry: 1.3584
Why we like it:
There is a pullback resistance level.
Stop loss: 1.3669
Why we like it:
There is a pullback resistance.
Take profit: 1.3457
Why we like it:
There is a pullback support that is slightly below the 61.8% Fibonacci retracement.
Enjoying your TradingView experience? Review us!
Please be advised that the information presented on TradingView is provided to Vantage (‘Vantage Global Limited’, ‘we’) by a third-party provider (‘Everest Fortune Group’). Please be reminded that you are solely responsible for the trading decisions on your account. There is a very high degree of risk involved in trading. Any information and/or content is intended entirely for research, educational and informational purposes only and does not constitute investment or consultation advice or investment strategy. The information is not tailored to the investment needs of any specific person and therefore does not involve a consideration of any of the investment objectives, financial situation or needs of any viewer that may receive it. Kindly also note that past performance is not a reliable indicator of future results. Actual results may differ materially from those anticipated in forward-looking or past performance statements. We assume no liability as to the accuracy or completeness of any of the information and/or content provided herein and the Company cannot be held responsible for any omission, mistake nor for any loss or damage including without limitation to any loss of profit which may arise from reliance on any information supplied by Everest Fortune Group.

Bullish bounce off 61.8% Fibonacci support?EUR/USD is falling towards the support level, which is a pullback support that aligns with the 61.8% Fibonacci retracement and could bounce from this level to our take profit.
Entry: 1.1728
Why we like it:
There is a pullback support that aligns with the 61.8% Fibonacci retracement.
Stop loss: 1.1613
Why we like it:
There is a pullback. support.
Take profit: 1.1866
Why we like it:
There is a pullback resistance.
Enjoying your TradingView experience? Review us!
Please be advised that the information presented on TradingView is provided to Vantage (‘Vantage Global Limited’, ‘we’) by a third-party provider (‘Everest Fortune Group’). Please be reminded that you are solely responsible for the trading decisions on your account. There is a very high degree of risk involved in trading. Any information and/or content is intended entirely for research, educational and informational purposes only and does not constitute investment or consultation advice or investment strategy. The information is not tailored to the investment needs of any specific person and therefore does not involve a consideration of any of the investment objectives, financial situation or needs of any viewer that may receive it. Kindly also note that past performance is not a reliable indicator of future results. Actual results may differ materially from those anticipated in forward-looking or past performance statements. We assume no liability as to the accuracy or completeness of any of the information and/or content provided herein and the Company cannot be held responsible for any omission, mistake nor for any loss or damage including without limitation to any loss of profit which may arise from reliance on any information supplied by Everest Fortune Group.

EUR/USDThis is my observation for today! I think there’s a high chance, as two FVGs have already formed on the H4. Let’s go! EASY Money.

Falling towards major support?The Fiber (EUR/USD) is falling towards the pivot which acts as a pullback support that is slightly above the 61.8% Fibonacci retracement and could bounce to the 1st resistance.
Pivot: 1.1768
1st Support: 1.1678
1st Resistance: 1.1895
Disclaimer:
The above opinions given constitute general market commentary, and do not constitute the opinion or advice of IC Markets or any form of personal or investment advice.
Any opinions, news, research, analyses, prices, other information, or links to third-party sites contained on this website are provided on an "as-is" basis, are intended only to be informative, is not an advice nor a recommendation, nor research, or a record of our trading prices, or an offer of, or solicitation for a transaction in any financial instrument and thus should not be treated as such. The information provided does not involve any specific investment objectives, financial situation and needs of any specific person who may receive it. Please be aware, that past performance is not a reliable indicator of future performance and/or results. Past Performance or Forward-looking scenarios based upon the reasonable beliefs of the third-party provider are not a guarantee of future performance. Actual results may differ materially from those anticipated in forward-looking or past performance statements. IC Markets makes no representation or warranty and assumes no liability as to the accuracy or completeness of the information provided, nor any loss arising from any investment based on a recommendation, forecast or any information supplied by any third-party.

Potential bullish bounce?EUR/NZD has bounced off the support level, which serves as a pullback support, and could rise from this level to our take-profit target.
Entry: 1.97941
Why we like it:
There is a pullback support level.
Stop loss: 1.96274
Why we like it:
There is a swing low support level.
Take profit: 2.00165
Why we like it:
There is a swing high resistance level.
Enjoying your TradingView experience? Review us!
Please be advised that the information presented on TradingView is provided to Vantage (‘Vantage Global Limited’, ‘we’) by a third-party provider (‘Everest Fortune Group’). Please be reminded that you are solely responsible for the trading decisions on your account. There is a very high degree of risk involved in trading. Any information and/or content is intended entirely for research, educational and informational purposes only and does not constitute investment or consultation advice or investment strategy. The information is not tailored to the investment needs of any specific person and therefore does not involve a consideration of any of the investment objectives, financial situation or needs of any viewer that may receive it. Kindly also note that past performance is not a reliable indicator of future results. Actual results may differ materially from those anticipated in forward-looking or past performance statements. We assume no liability as to the accuracy or completeness of any of the information and/or content provided herein and the Company cannot be held responsible for any omission, mistake nor for any loss or damage including without limitation to any loss of profit which may arise from reliance on any information supplied by Everest Fortune Group.

Bearish drop off?EUR/GBP has rejected off the resistance level, which is an overlap resistance, and could potentially drop from this level to our take-profit.
Entry: 0.8685
Why we like it:
There is an overlap resistance level.
Stop loss: 0.8721
Why we like it:
There is a pullback resistance.
Take profit: 0.8637
Why we like it:
There is a pullback support level.
Enjoying your TradingView experience? Review us!
Please be advised that the information presented on TradingView is provided to Vantage (‘Vantage Global Limited’, ‘we’) by a third-party provider (‘Everest Fortune Group’). Please be reminded that you are solely responsible for the trading decisions on your account. There is a very high degree of risk involved in trading. Any information and/or content is intended entirely for research, educational and informational purposes only and does not constitute investment or consultation advice or investment strategy. The information is not tailored to the investment needs of any specific person and therefore does not involve a consideration of any of the investment objectives, financial situation or needs of any viewer that may receive it. Kindly also note that past performance is not a reliable indicator of future results. Actual results may differ materially from those anticipated in forward-looking or past performance statements. We assume no liability as to the accuracy or completeness of any of the information and/or content provided herein and the Company cannot be held responsible for any omission, mistake nor for any loss or damage including without limitation to any loss of profit which may arise from reliance on any information supplied by Everest Fortune Group.

EURUSD Consolidates Ahead of Fed Rate Decision – Key Pivot 1.188EURUSD – Overview
EURUSD has already tested the resistance zone highlighted in yesterday’s analysis and is now consolidating between 1.1882 and 1.1780 ahead of the Federal Reserve rate decision.
The Fed announcement and Powell’s guidance are expected to drive the next breakout from this range.
Technical Outlook
📈 Bullish scenario
The pair maintains a bullish bias while trading above 1.1780.
A confirmed break above 1.1883 would strengthen momentum toward 1.1940 → 1.2060.
📉 Bearish scenario
A decisive move below 1.1780 would shift bias bearish.
Downside targets: 1.1751 → 1.1684.
Key Levels
Pivot: 1.1882
Resistance: 1.1940 – 1.2060
Support: 1.1780 – 1.1751 – 1.1684
📌 Market Context:
The Fed’s decision will dictate the breakout direction.
Dovish Fed / larger cut → EURUSD likely to break higher toward 1.1940+.
Hawkish Powell → bearish breakout below 1.1780 toward 1.1684.

EURUSD: Exhausting Uptrend Around 1.1930-1.2400The EUR/USD pair shows signs of losing momentum on the chart, which is expected as it is currently in the final (5th) wave of a larger wave C or 3.
The RSI indicates a second consecutive bearish divergence, but the uptrend could continue for a while. The price is likely to reach at least 1.1930, which is the level where wave C equals wave A, for symmetry.
The blue box highlights the target area based on the Fibonacci sequence. It starts at 1.1930 and peaks around 1.2400, where wave 5 of wave C is projected to cover 61.8% of the distance from wave 1 to wave 3.
We’re not predicting the reversal point yet; we’ll let the market reveal it in due time.
Wishing us all lucky trades!

Heading into pullback resistance?EUR/AUD is rising towards the pivot which acts as a pullback resistance and could reverse to the 1st support.
Pivot: 1.78230
1st Support: 1.76984
1st Resistance: 1.79130
Disclaimer:
The above opinions given constitute general market commentary, and do not constitute the opinion or advice of IC Markets or any form of personal or investment advice.
Any opinions, news, research, analyses, prices, other information, or links to third-party sites contained on this website are provided on an "as-is" basis, are intended only to be informative, is not an advice nor a recommendation, nor research, or a record of our trading prices, or an offer of, or solicitation for a transaction in any financial instrument and thus should not be treated as such. The information provided does not involve any specific investment objectives, financial situation and needs of any specific person who may receive it. Please be aware, that past performance is not a reliable indicator of future performance and/or results. Past Performance or Forward-looking scenarios based upon the reasonable beliefs of the third-party provider are not a guarantee of future performance. Actual results may differ materially from those anticipated in forward-looking or past performance statements. IC Markets makes no representation or warranty and assumes no liability as to the accuracy or completeness of the information provided, nor any loss arising from any investment based on a recommendation, forecast or any information supplied by any third-party.


EURGBP – Battleground of Supply and Demand!EURGBP has been trading between clear supply and demand zones ⚖️, respecting both ends of the range.
After rejecting the 0.8750 supply zone, price turned lower, showing that sellers remain in control. Currently, EURGBP is hovering around the 0.8620 – 0.8640 demand zone, where buyers previously stepped in.
This area forms an important decision point 🔑:
- If demand holds, we could see a bounce back toward mid-range levels.
- If broken, a continuation lower would confirm supply’s dominance 📉.
Patience here is key ⏳ — waiting for confirmation at these zones can help filter out false moves and set up a cleaner trade.
⚠️ Disclaimer: This is not financial advice. Always do your own research and manage risk properly.
📚 Always follow your trading plan regarding entry, risk management, and trade management.
Good luck!
All Strategies Are Good; If Managed Properly!
~Richard Nasr

EURUSD This is its final rally before Bear Market.The EURUSD pair has been rising aggressively within a (blue) Channel Up since the January 13 2025 bottom. The current Bullish Leg started 6 weeks ago when it hit the 1D MA100 (red trend-line) and rebounded.
This is a critical buy level as it has supported all similar Channel Up patterns since January 2017. When that broke and a 1W MA50 (blue trend-line) crossing came equally fast, the new Bear Market in the form of a (red) Channel Down started.
The key now is the 1W RSI, which has started to form a Double Top peak pattern similar to those that led to the tops of February 12 2018 and January 04 2021. What those two have in common is contact with the Lower Highs trend-line, an 8-year Resistance level that EURUSD is targeting now.
If the 1W RSI double tops again, we expect another brutal rejection on the Lower Highs trend-line and we estimate that to be around the 1.20000 psychological level. As a result, we call the current rise, EURUSD's final rally on a Bull Cycle that lasted a year. After that, we expect the new Channel Down to lead to the Bear Market that will at least target the top of the 9-year Support Zone. It is a long-term projection but we see 1.06500 getting hit by the end of 2026 - beginning of 2027.
-------------------------------------------------------------------------------
** Please LIKE 👍, FOLLOW ✅, SHARE 🙌 and COMMENT ✍ if you enjoy this idea! Also share your ideas and charts in the comments section below! This is best way to keep it relevant, support us, keep the content here free and allow the idea to reach as many people as possible. **
-------------------------------------------------------------------------------
💸💸💸💸💸💸
👇 👇 👇 👇 👇 👇

Bullish momentum to extend?The Fiber (EUR/USD) has bounced off the pivot and could rise to the 1st resistance.
Pivot: 1.1736
1st Support: 1.1678
1st Resistance: 1.1808
Oil markets on September 16, 2025, are caught between conflicting forces. While immediate supply disruption risks from Ukrainian attacks on Russian infrastructure and anticipated Federal Reserve rate cuts are providing near-term price support, fundamental market conditions point to significant oversupply ahead. The EIA's projection of massive inventory builds and OPEC+'s continued production increases suggest substantial downward price pressure through 2026, with Brent potentially falling to $50 per barrel despite current geopolitical tensions. The market is essentially pricing in short-term disruption risks while bracing for longer-term oversupply challenges.

Bearish drop?EUR/GBP has rejected off the resistance level which is a pullback resistance that aligns with the 38.2% Fibonacci retracement, and could drop from this level to our take profit.
Entry: 0.8662
Why we like it:
There is a pullback resistance that lines up with the 38.2% Fibonacci retracement.
Stop loss: 0.8686
Why we like it:
There is a pullback resistance that lines up with the 61.8% Fibonacci retracement.
Take profit: 0.8613
Why we like it:
There is a swing low support.
Enjoying your TradingView experience? Review us!
Please be advised that the information presented on TradingView is provided to Vantage (‘Vantage Global Limited’, ‘we’) by a third-party provider (‘Everest Fortune Group’). Please be reminded that you are solely responsible for the trading decisions on your account. There is a very high degree of risk involved in trading. Any information and/or content is intended entirely for research, educational and informational purposes only and does not constitute investment or consultation advice or investment strategy. The information is not tailored to the investment needs of any specific person and therefore does not involve a consideration of any of the investment objectives, financial situation or needs of any viewer that may receive it. Kindly also note that past performance is not a reliable indicator of future results. Actual results may differ materially from those anticipated in forward-looking or past performance statements. We assume no liability as to the accuracy or completeness of any of the information and/or content provided herein and the Company cannot be held responsible for any omission, mistake nor for any loss or damage including without limitation to any loss of profit which may arise from reliance on any information supplied by Everest Fortune Group.

EURCADLooking for a retracement of 23% or lower from the previous low of the recent wave. Since July, the EUR has been gaining strength compared to the CAD while volume has been decreasing in general. Price is currently ranging on a lower timeframe.

EUR/USD - Trade Idea (Forecast Linked)🕰 Weekly View
Price is pushing away from major support at 1.14–1.15 and climbing into the 1.18–1.20 resistance zone. Weekly structure still favors upside momentum while support holds.
📉 Daily Structure
Resistance: 1.18–1.20 strong supply.
Support : 1.16–1.17 demand , with deeper discount demand sitting at 1.15–1.16.
Daily price action shows liquidity being swept both sides before a push higher.
⏱ 8H Breakdown
Price is reacting from unmitigated demand around 1.16–1.17. A wedge breakout is sending price toward resistance at 1.18–1.20. If rejected, look for retrace back into discount demand (1.15–1.16) before continuation.
🔎 Outlook
Scenario 1 → Sweep into 1.18–1.20 supply → retrace back into 1.15–1.16 discount demand → continuation higher.
Scenario 2 → Clean breakout above 1.20 accelerates toward 1.22+.
Bias : Short-term reaction lower possible → mid-term bullish continuation.

EUR/USD - Forecast 🕰 Weekly View
Price has broken out of the long-term downtrend and is now retesting the 1.16–1.17 support zone as new structure. If this level holds, momentum favors continuation higher toward 1.20–1.22.
📉 Daily Structure
Resistance: 1.18–1.20 supply zone.
Support: 1.16–1.17 demand base.
Daily structure shows accumulation and breakout, with price consolidating just under higher resistance.
⏱ 8H Breakdown
Price has respected the wedge breakout and is holding above demand. If support at 1.16–1.17 continues to hold, expect another leg up into 1.20+ targets. Failure here reopens downside back toward 1.12–1.13 demand.
🔎 Outlook
Scenario 1 → Hold above 1.16 and push into 1.20–1.22.
Scenario 2 → Rejection at resistance leads to deeper correction into 1.12–1.13.
Bias : Pullback into support → bullish continuation toward 1.20–1.22.

EUR/USD - Moving into Buy movements🕰 Monthly View
Price is breaking out of the major support/resistance zone around 1.18–1.20 after years of compression. Historically, this level has acted as a turning point, and now momentum favors the upside. MACD confirms strength with a bullish cross, pointing to continuation.
📉 Weekly Structure
Resistance: Cleared at 1.20, room to expand higher.
Support: 1.10–1.12 base holds as long-term demand.
Macro structure now looks like a sustained breakout phase.
⏱ Daily / Lower-Timeframe Perspective
Price has been steadily pressing higher without significant supply above. The clean breakout above 1.18 suggests little resistance until much higher levels, leaving upside open.
🔎 Outlook
Bullish momentum dominates. As long as price holds above 1.18, continuation toward 1.30+ becomes likely. MACD divergence that held the downside has now shifted, fueling the upside breakout.
Bias : Strong bullish continuation → mid-to-long term upside toward 1.30+.
