Gold - Intraday Long Setup (5M TF) | Smart Money + Elliott Struc# 🟢 Gold - Intraday Long Setup (5M TF) | Smart Money + Elliott Structure
**Pair:** Gold Spot / USD
**Timeframe:** 5M
**Session:** London / NY Overlap
**Type:** Intraday Long Idea
**Concepts:** Smart Money, Supply & Demand, Wave Analysis, SSL Confirmation
---
## 🔍 Market Context
The market is currently reacting inside a **key Demand Zone** on the 5-minute timeframe, following a strong bearish move during the London session. The structure suggests a corrective **ABC wave formation**, where the **(c) point** appears to be forming a potential higher low at demand.
- Point **(a)**: Marked the first impulse down
- Point **(b)**: Rejection at minor **Supply Zone**
- Point **(c)**: Retest of **POI at Demand**, showing signs of exhaustion in selling pressure
---
## 📈 Technical Confluences
- 🟦 **Demand Zone** active and respected
- 📏 Potential BOS (Break of Structure) upon break of the recent high
- 📊 **Vol %ile** = 83% → Above average participation
- ⚠️ Risk Level: High (tight structure, requires confirmation)
- 🧭 Entry Distance: Near
---
## 🔧 Indicators Status (SSL Hybrid)
| Indicator | Status |
|--------------------------|----------|
| SSL Channel | ✅ Bullish cross (supporting reversal)
| RSI (50) | ✅ Holding above midpoint
| MACD | ✅ Bullish crossover (early signal)
| BB Oscillator / HT / RQK | ❌ Still bearish (lagging)
---
## 🎯 Trade Idea
**Bias:** Long
**Trigger:** Break above **minor Supply** and formation of BOS
**Target Zones:**
1. **TP1:** 3,370
2. **TP2:** 3,378 (supply edge)
3. **TP3:** 3,385 (upper supply zone)
**SL:** Below point (c) @ **~3,357**
---
## 🧠 Notes
This setup is valid as long as price holds above the Demand Zone and confirms a bullish shift via BOS. Wait for clear confirmation before entering.
_This is an educational idea based on Smart Money + Elliott Wave principles – not financial advice._
---
#gold #smartmoney #supplydemand #elliottwave #sslhybrid #intraday #5mtf #tradingview
F-XAU

Gold Hits Record $3,625 – Bulls Eye 3,636/3,650Gold – Overview
Gold surged to a record high at $3,625, following weaker U.S. hiring data that fueled demand for the safe-haven asset. Momentum remains strong, with traders watching if there’s more room to the upside.
Technical Outlook:
📈 Bullish scenario: As long as price trades above 3,612, momentum favors a move toward 3,636. A confirmed stabilization above 3,637 would extend the rally toward 3,650.
📉 Bearish scenario: A confirmed 1H close below 3,612 would trigger a correction, targeting 3,600 → 3,580.
Key Levels:
Pivot: 3,618
Resistance: 3,636 – 3,650
Support: 3,612 – 3,600 – 3,580
Bias: Bullish above 3,612; bearish correction only if price closes below this leve
previous idea:

Silver | H4 Double Top | GTradingMethod
🧐 Market Overview:
All my variables have been met.
Some of the variables I look for are as follows:
- RSI divergence
- Lower volume on top 2 (In this case JOLTS came out, which causes an exception to the volume rule)
- Attack candle closes in range
Opened a short position on Silver.
📊 Trade Plan:
Risk/Reward: 3.9
🎯 Entry: 41.29
🛑 Stop Loss: 41.67
💰 Take Profit 1 (50%): 39.93
💰 Take Profit 2 (50%): 39.34
💡 GTradingMethod Tip:
Sometimes news events (like JOLTS) can disrupt normal volume behavior. That’s why it’s key to use multiple variables together, not rely on just one signal.
🙏 Thanks for checking out my post!
Make sure to follow me to catch the next idea and please share your thoughts — I’d love to hear them.
📌 Please note:
This is not financial advice. This content is to track my trading journey and for educational purposes only.

XAUUSD - Daily | The breakout is REALSimple trading - Triangle pattern
Gold is back to making All-Time highs. Reaching as high as 3600. You can see the breakout was fast and instant. In less than 2 weeks, gold managed to move the price over 1500 pips.
The target of the triangle breakout is nearly reached. Roughly 3675.
Gold has already tested support that was previously a bullish daily FVG. With clean rejection, we see the price remaining bullish.

BITCOIN VS. GOLDAlthough there is a time difference between bitcoin, known as digital gold, and spot gold, it continues to follow suit, which we can clearly see on the chart.

Silver | H1 Head and Shoulders | GTradingMethodHello Traders.
Welcome to today's trade idea by GTradingMethod.
🧐 Market Overview:
I’m watching silver closely for a potential short setup. Price action suggests a possible head and shoulders formation, but I’m still waiting for confirmation from key variables before committing. For example:
- I’d like to see the current 1H candle close within my range
- Lower volume on the right shoulder compared to the left.
📊 Trade Plan:
Risk/reward = 3.0
Entry price = 40.88
Stop loss price = 41.14
Take profit level 1 (50%) = 40.17
Take profit level 2 (50%) = 39.77
💡 GTradingMethod Tip:
Patience is a trading edge. Waiting for confirmation before entering means fewer trades, but higher-quality ones.
🙏 Thanks for checking out my post!
Make sure to follow me to catch the next idea and please share your thoughts – I would like to hear them.
📌 Please note:
This is not financial advice. This content is to track my trading journey and for educational purposes only.

GOLD H1 | Bearish reversal off swing high resistanceBased on the H1 chart analysis, we could see the price rise to the sell entry at 3,573.66, which is a pullback resistance and could reverse from this level to the downside.
Stop loss is at 3,573.66, which is a swing high resistance.
Take profit is at 3,484.30, which is a pullback support that lines up with the 38.2% Fibonacci retracement.
High Risk Investment Warning
Trading Forex/CFDs on margin carries a high level of risk and may not be suitable for all investors. Leverage can work against you.
Stratos Markets Limited (tradu.com ):
CFDs are complex instruments and come with a high risk of losing money rapidly due to leverage. 65% of retail investor accounts lose money when trading CFDs with this provider. You should consider whether you understand how CFDs work and whether you can afford to take the high risk of losing your money.
Stratos Europe Ltd (tradu.com ):
CFDs are complex instruments and come with a high risk of losing money rapidly due to leverage. 66% of retail investor accounts lose money when trading CFDs with this provider. You should consider whether you understand how CFDs work and whether you can afford to take the high risk of losing your money.
Stratos Global LLC (tradu.com ):
Losses can exceed deposits.
Please be advised that the information presented on TradingView is provided to Tradu (‘Company’, ‘we’) by a third-party provider (‘TFA Global Pte Ltd’). Please be reminded that you are solely responsible for the trading decisions on your account. There is a very high degree of risk involved in trading. Any information and/or content is intended entirely for research, educational and informational purposes only and does not constitute investment or consultation advice or investment strategy. The information is not tailored to the investment needs of any specific person and therefore does not involve a consideration of any of the investment objectives, financial situation or needs of any viewer that may receive it. Kindly also note that past performance is not a reliable indicator of future results. Actual results may differ materially from those anticipated in forward-looking or past performance statements. We assume no liability as to the accuracy or completeness of any of the information and/or content provided herein and the Company cannot be held responsible for any omission, mistake nor for any loss or damage including without limitation to any loss of profit which may arise from reliance on any information supplied by TFA Global Pte Ltd.
The speaker(s) is neither an employee, agent nor representative of Tradu and is therefore acting independently. The opinions given are their own, constitute general market commentary, and do not constitute the opinion or advice of Tradu or any form of personal or investment advice. Tradu neither endorses nor guarantees offerings of third-party speakers, nor is Tradu responsible for the content, veracity or opinions of third-party speakers, presenters or participants.

Extremely bearish scenario for gold has been activated!Look at the screenshot - the price bounces off the trendline for the third time and is about to crash to level 3220. Strictly short!

XAUUSD H1 | Bullish continuationThe Gold (XAU/USD) is falling towards the buy entry which is a pullback support that aligns with the 61.8% Fibonacci retracement and could bounce from this level to the take profit.
Buy entry is at 3,507.77, which is a pullback support that lines up with the 61.8% Fibonacci retracement.
Stop loss is at 3,469.17, whichis a pullback support that aligns with the 50% Fibnacci retracement.
Tak eprofit is at 3,574.66, whichis a swing high reisstance.
High Risk Investment Warning
Trading Forex/CFDs on margin carries a high level of risk and may not be suitable for all investors. Leverage can work against you.
Stratos Markets Limited (tradu.com ):
CFDs are complex instruments and come with a high risk of losing money rapidly due to leverage. 65% of retail investor accounts lose money when trading CFDs with this provider. You should consider whether you understand how CFDs work and whether you can afford to take the high risk of losing your money.
Stratos Europe Ltd (tradu.com ):
CFDs are complex instruments and come with a high risk of losing money rapidly due to leverage. 66% of retail investor accounts lose money when trading CFDs with this provider. You should consider whether you understand how CFDs work and whether you can afford to take the high risk of losing your money.
Stratos Global LLC (tradu.com ):
Losses can exceed deposits.
Please be advised that the information presented on TradingView is provided to Tradu (‘Company’, ‘we’) by a third-party provider (‘TFA Global Pte Ltd’). Please be reminded that you are solely responsible for the trading decisions on your account. There is a very high degree of risk involved in trading. Any information and/or content is intended entirely for research, educational and informational purposes only and does not constitute investment or consultation advice or investment strategy. The information is not tailored to the investment needs of any specific person and therefore does not involve a consideration of any of the investment objectives, financial situation or needs of any viewer that may receive it. Kindly also note that past performance is not a reliable indicator of future results. Actual results may differ materially from those anticipated in forward-looking or past performance statements. We assume no liability as to the accuracy or completeness of any of the information and/or content provided herein and the Company cannot be held responsible for any omission, mistake nor for any loss or damage including without limitation to any loss of profit which may arise from reliance on any information supplied by TFA Global Pte Ltd.
The speaker(s) is neither an employee, agent nor representative of Tradu and is therefore acting independently. The opinions given are their own, constitute general market commentary, and do not constitute the opinion or advice of Tradu or any form of personal or investment advice. Tradu neither endorses nor guarantees offerings of third-party speakers, nor is Tradu responsible for the content, veracity or opinions of third-party speakers, presenters or participants.

Good News and Bad News for Gold as It Hits Record HighsAs gold continues to surge to record highs (~$3600) , two major risks exist that could impact its momentum—one potentially positive, and the other negative.
The Potential Removal of Trump's Tariffs
A federal appeals court recently ruled that Trump’s tariffs, imposed under the International Emergency Economic Powers Act, were unlawful. As a result, U.S. businesses have paid over $210 billion in tariffs that are now considered illegal.
Trump’s administration is preparing an appeal to the Supreme Court, and if the tariffs are reversed, it could reduce Treasury revenue. This could lead to increased borrowing, potentially putting downward pressure on gold prices.
Concerns Over the Fed's Independence
Concerns about the Federal Reserve's independence also pose a risk to gold. If these concerns grow, markets could price in a higher risk premium against the dollar, which could boost gold’s appeal.
Helping to moderate these concerns, at least for now, two Republican senators recently announced they would block any replacement for Fed Governor Lisa Cook until her lawsuit over her firing is resolved.

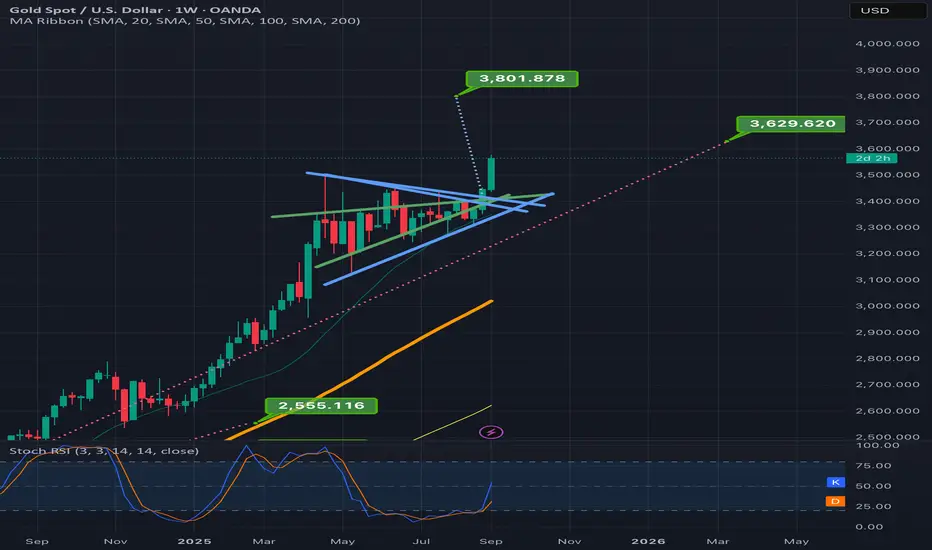
Gold chart showing Technical Analysis at its bestTA doesn’t get much more exact than this. Gold beautifully displayed why TA is such a powerful manifestation device. Look how perfectly Gold broke up and then used the dotted measured move line as a staircase to climb its way to the full breakout target. Perfection. Those who’s off at TA as just imaginary or arbitrary lines, have not seen this kind of accuracy play outthe and time again as I have during my time as a technical analyst. Posting this as a prime example for posterity. *not financial advice*
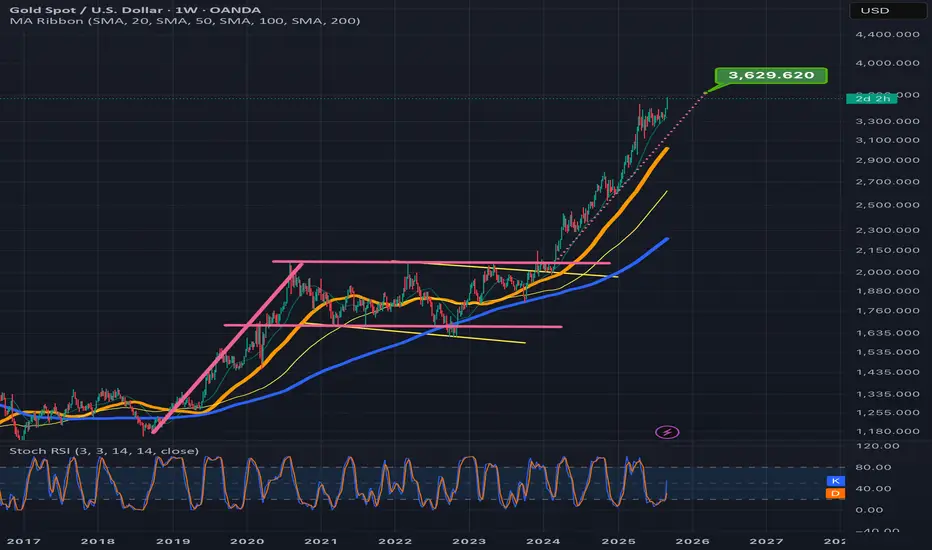
Gold is now less than $100 from hitting target I called in 2023Been a long journey but the top target I charted all the way back in 2023 for gold is about to get hit as we are now less than100 dollars away from that target. Based on this blue symmetrical triangle it is currently breaking up from we should not only hit the old target but surpass it and head to 3800 as well. *not financial advice*
#PAXGUSDT #1D (ByBit) Head & Shoulders near breakdownPax Gold printed a shooting star and is losing 50MA now, on daily.
Seems on the verge of a big retracement down towards 200MA support, once neckline is broken.
⚡️⚡️ #PAXG/USDT ⚡️⚡️
Exchanges: ByBit USDT
Signal Type: Regular (Short)
Leverage: Isolated (9.0X)
Amount: 4.9%
Entry Targets:
1) 3349.94
Take-Profit Targets:
1) 3049.06
Stop Targets:
1) 3500.75
Published By: @Zblaba
LSE:PAXG BYBIT:PAXGUSDT.P #1D #PaxGold TVC:XAU
Risk/Reward= 1:2.0
Expected Profit= +80.8%
Possible Loss= -40.5%
Estimated Gaintime= 1.5 months

Gold | 15min Head and Shoulders | GTradingMethodHello Traders.
Welcome to today's trade idea by GTradingMethod.
🧐 Market Overview:
There’s a potential head and shoulders pattern forming on the 15-minute chart. Gold broke to a new high yesterday, and a healthy breakout often comes with a retest before continuing higher.
This 15-minute head and shoulders could signal that retest — or potentially lead to a deeper correction.
One of the variables I will be looking for is lower volume on the right shoulder.
📊 Trade Plan:
Risk/reward = 3.3
Entry price = 3 536.3
Stop loss price = 3 543.5
Take profit level 1 (50%) = 3 516.8
Take profit level 2 (50%) = 3 506
💡 GTradingMethod Tip:
Patterns can provide an edge, but waiting for confirmation helps you avoid false signals and emotional decisions.
🙏 Thanks for checking out my post!
Make sure to follow me to catch the next idea and please share your thoughts - I would like to hear them.
📌 Please note:
This is not financial advice. This content is to track my trading journey and for educational purposes only.

Gold | H1 Double Bottom | GTradingMethodHello Traders.
Welcome to today's trade idea by GTradingMethod.
🧐 Market Overview
Gold has been making higher highs while RSI has been making lower highs, which is known as negative RSI divergence. This is an indication of weakening buying strength. For further confluence, this potential double top is at the ATH level, which could provide further resistance.
📊 Trade Plan
Risk/reward = 2.9
Entry price = 3 497.6
Stop loss price = 3 515.5
Take profit level 1 (50%) = 3 456.4
Take profit level 2 (50%) = 3 431.9
💡 GTradingMethod Tip
Always predefine your risk for every trade and always accept this risk. If you accept the risk, there can be no emotional pain. If you do not get emotional, you will interpret the market's information objectively.
🙏 Thanks for checking out my post!
Make sure to follow me to catch the next idea and please share your thoughts - I would like to hear them.
📌 Please note:
This is not financial advice. This content is to track my trading journey and for educational purposes only.

GOLD Expecting Local Correction! Sell!
Hello,Traders!
GOLD has almost reached
A massive horizontal
Resistance of 3500$ which
Is also an ATH level and Gold
Is locally oversold so despite
Our long-term bullish bias
A correction from the
Resistance is likely
Sell!
Comment and subscribe to help us grow!
Check out other forecasts below too!
Disclosure: I am part of Trade Nation's Influencer program and receive a monthly fee for using their TradingView charts in my analysis.

GOLD ALL TIME HIGH|SHORT|
✅GOLD keeps growing in
An EPIC uptrend and the price
Nearly reached the ATH of 3500$
Which I am sure will be broken
Soon, however we can't be expecting
An immediate breakout so I think
We will see a local bearish
Correction from the ATH
SHORT🔥
✅Like and subscribe to never miss a new idea!✅

BITCOIN vs GOLD - Massive Fall in 2025?My prediction: TVC:XAU (Gold) will OUTPERFORM CRYPTOCAP:BTC (Bitcoin) until December of 2025
Here is why:
1. Technical side. The price failed to break through the 33.5 resistance and is now heading downwards. The right shoulder of the H&S pattern has formed clearly. The TVC:XAU chart is very bullish, breaking resistance one by one. In contrast, the CRYPTOCAP:BTC failed to hold above the $117,000 resistance, resulting in a hard dump that seems to be far from over.
2. Fundamental side. People buy gold during uncertain times, and we are currently on the verge of experiencing such a period. Rate cuts are already priced in, and each FOMC meeting is a "sell the news" event. If only Powell refuses to cut rates or cut it just one - markets, especially SP:SPX , will be heavily affected. When crypto and stocks are falling, people buy gold—it's a simple rule.
I'm not calling for a massive correction in the stock and crypto markets, but holding some gold in your portfolio during the fall of 2025 seems like the right thing to do.

𝐌𝐓𝐗 | Buy-Side Sweet Spot in Gold’s Correction📌 From previous analysis:
• We anticipated corrective pullbacks and highlighted reversal zones.
• Focus was on 436–432 as the first critical support/resistance area.
⸻
1️⃣ Key Reversal Levels
There’s two scenarios in this rally:
A)
• 436 – 432 → First potential bullish reversal zone.
• 4H close above 435 → upside continuation toward 442 → 447 → 452.
B)
• 4H close below 432 → decline into 420.
• 420 – 415 is the strongest weekly demand zone (high-probability bullish bounce).
⸻
2️⃣ Continues Bullish Scenario
• 4H close above 454 → opens the way to 467.
• Stabilization above 467 → next major upside target 484.
✴️Plus Tip:
Daily closes above 420-415 zone supports the bullish momentum.
⸻
⚖️ Summary:
Gold is starting the month at a decisive zone (436–432). Holding above 435 favors further upside toward 452, while losing 432 puts the strong 420–415 demand zone into play. A confirmed breakout above 454 could accelerate the rally toward 484.

XAUUSD 4H🔎 Chart Context
• Asset: Gold Spot (XAU/USD)
• Timeframe: 4H
• Current price: 3,447.4
• The chart shows gold breaking out of a multi-week consolidation range between 3,250 – 3,400, now pushing toward higher liquidity zones.
📊 Key Observations
1. Market Structure
• Gold has been consolidating inside a wide range box (3,250 – 3,400) since July.
• Recent breakout above 3,425 resistance suggests bullish momentum.
• Structure remains bullish as long as price holds above 3,400 support.
2. Support Zones
• 3,400 – 3,425: Fresh breakout zone; now flipped into short-term support.
• 3,325 – 3,350: Mid-range demand, strong base for buyers.
• 3,250 – 3,275: Major structural demand, defended multiple times in July & August.
3. Resistance Zones
• 3,500: First major upside target (supply/psychological resistance).
• 3,600: Extended bullish target and liquidity cluster.
4. Liquidity & Projections
• Liquidity pools above 3,500 will likely attract price.
• Chart projection suggests:
• Possible short-term pullback into 3,400 – 3,425.
• Continuation rally toward 3,500 → 3,600.
📈 Bullish Scenario (Higher Probability)
• Price sustains above 3,425 breakout level.
• Path: Pullback → Retest support → Continuation higher.
• Targets:
• TP1: 3,500
• TP2: 3,600
📉 Bearish Scenario (Low Probability / Countertrend)
• Gold fails to hold above 3,400.
• Breakdown path:
• Re-entry into range (3,350 → 3,325).
• Possible revisit of 3,250 demand zone.
• Would represent fake breakout scenario.
⚡ Trading Plan
• Long Setup (Preferred):
• Entry: Pullback into 3,425 – 3,400.
• TP1: 3,500
• TP2: 3,600
• Stop: Below 3,375
• Short Setup (Only if breakdown confirmed):
• Entry: Failed retest of 3,400 from below.
• TP: 3,325 → 3,250
• Stop: Above 3,425

Gold | H2 Double Top | GTradingMethod🧐 Market Overview:
Gold is testing a key diagonal resistance level while forming a potential double top on the H2 timeframe. This setup suggests that sellers may step in at this level if resistance holds.
📊 Trade Plan:
Risk/Reward: 4.6
Entry: 3423.1
Stop Loss: 3429.6
Take Profit 1 (50%): 3397.8
Take Profit 2 (50%): 3385.5
💡 GTradingMethod Tip:
Double tops near major resistance often provide high R:R opportunities, but confirmation from price action is key before entering.
🙏 Thanks for checking out my post!
Make sure to follow me to catch the next idea and share your thoughts — I’d love to hear them.
📌 Please note:
This is not financial advice. This content is to track my trading journey and for educational purposes only.

Good Price action can continue on Gold As we get ready to close out the week price moved full on bullish yesterday and it looks like it can continue. Looking to see what Happens when price moves back insde of the small 1HR FVG they left behind. we are not reacting to anything before the killzone.

XAUUSD Holds Above Pivot — Bulls Target $3,401 NextGold – Live Update
Bullish Trend Holds Above Pivot
Gold reached our projected target around 3,392 as mentioned in the previous idea.
Currently, the price is trading above the 3,374 pivot line, maintaining bullish momentum.
🔹 Technical Outlook
✅ As long as price holds above 3,374, the bullish trend should continue toward 3,384 → 3,401 → 3,412.
⚠️ A move below 3,374 would trigger a correction to 3,363, with deeper downside toward 3,350.
🔹 Key Levels
Pivot: 3,374
Resistance: 3,384 – 3,401 – 3,412
Support: 3,363 – 3,350
✅ Summary:
Gold continues to respect bullish momentum above the pivot. Watch 3,374 as the decision zone — holding above favors continuation higher, while a break below shifts focus to 3,363 and 3,350.
previous idea:
