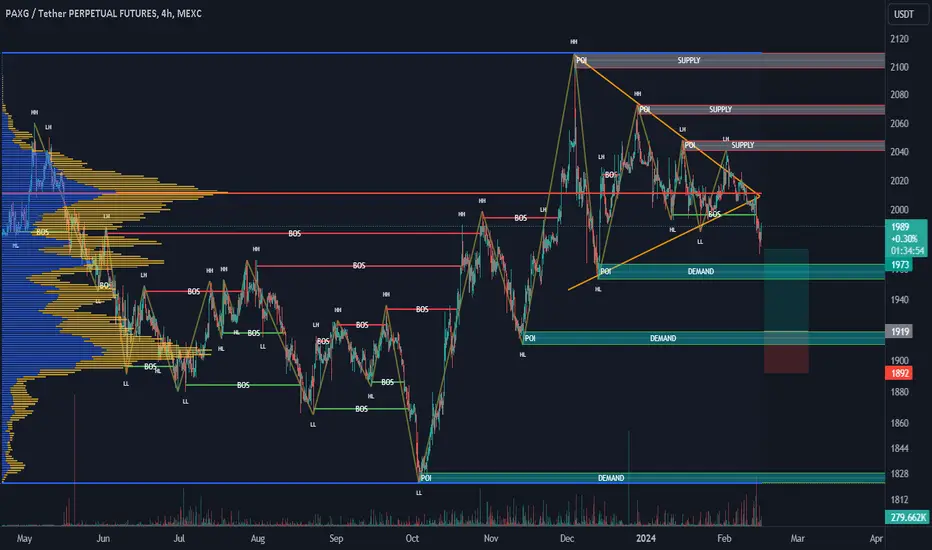
PAXG: Bullish Divergence From Lower Value — POC Rotation SetupPAXG: Bullish Divergence From Lower Value — POC Rotation Setup
PAXG is still trading inside a broader bearish structure, but the current location is starting to look interesting.
Price is sitting near the lower part of the Value Area, while daily Q is showing a clear bullish divergence.
That create
GOLD !1 Kings 10:2 — "And she came to Jerusalem with a very great train, with camels that bare spices, and very much gold, and precious stones: and when she was come to Solomon, she communed with him of all that was in her heart."
The Queen of Sheba brought gold to the wise.
PAXG is that gold. 4,620 is
What do you think about shorting gold?Hello, what do you think about this setup?
Based on bearish structure: Lower High -> Lower Low
Gold looks rejecting 20 EMA (Green MA) around 4330 level which is also a confluence level
Confluence level: many fibo + green MA + prior support + MACD 3/10 (4h + 1h) Divergence + Shooting Star (Not clo
Bullish Bat Pattern in PAXGUSDTPAXGUSDT Analysis
CMP 4562.97(19-05-2026 02:59am PST)
Bullish Bat Pattern along with Bullish
Divergence showing signs of reversal.
However, 4488 is an Important Support.
Upside resistance is around 4800 - 4900 initially.
Crossing & Sustaining this range may lead it towards
5200 - 5300.
PAXGUSDT (Gold) - 4H Timeframe weekly AnalysisPAXGUSDT Gold 4H Timeframe
Current Situation
Price is currently 4536 and has broken below the important 4600 level. That level has now turned into resistance.
---
Resistance Levels Selling Zones
Level: 4580 to 4600
Strength: Very Strong
Comment: Broken support now resistance
Level: 4670 to 470
PAXG/USDT Perpetual - Analysis 1H Timeframe my Direction LongPAXG/USDT Perpetual - Support and Resistance Analysis 1H Timeframe
Current Price approximately 4691
Resistance Levels (Upside)
Level R1
Price Zone 4720 - 4725
Strength Immediate resistance recent rejection zone
Level R2
Price Zone 4750 - 4755
Strength Strong resistance recent swi
PAXG/USDT Perpetual - 1H Time Frame Analysis Buying directionPAXG/USDT Perpetual - 1H Time Frame Analysis
Current Price: 4709.96
Support Areas Neechay ke levels
Level S1 Immediate
Price Range 4680 - 4685
Importance Minor support recent consolidation zone
Level S2 Strong
Price Range 4640 - 4650
Importance Major support swing low se bana hua
PAXGUSDT Bearish Continuation Scenario From Daily Rising WedgePAXGUSDT is showing signs of rejection below the 0.5 Fibonacci resistance on the 4H chart, where price appears to have formed a bearish rejection candle, possibly close to a bearish engulfing or a mild shooting star structure.
This reaction becomes more meaningful when viewed alongside the broader
PAXG: Broken Growth TrendlinePAXG has officially confirmed a major reversal signal by breaking below the long-term ascending trendline that has supported prices for an extended period. This represents a pivotal turning point, indicating that buying momentum has completely exhausted, handing control over to the bears. After pier
See all ideas
Summarizing what the indicators are suggesting.
Oscillators
Neutral
SellBuy
Strong sellStrong buy
Strong sellSellNeutralBuyStrong buy
Oscillators
Neutral
SellBuy
Strong sellStrong buy
Strong sellSellNeutralBuyStrong buy
Summary
Neutral
SellBuy
Strong sellStrong buy
Strong sellSellNeutralBuyStrong buy
Summary
Neutral
SellBuy
Strong sellStrong buy
Strong sellSellNeutralBuyStrong buy
Summary
Neutral
SellBuy
Strong sellStrong buy
Strong sellSellNeutralBuyStrong buy
Moving Averages
Neutral
SellBuy
Strong sellStrong buy
Strong sellSellNeutralBuyStrong buy
Moving Averages
Neutral
SellBuy
Strong sellStrong buy
Strong sellSellNeutralBuyStrong buy
Displays a symbol's price movements over previous years to identify recurring trends.