EURCHF Readies An Inverse Head and ShouldersOANDA:EURCHF has exhibited strong indications of a Bullish Reversal possible with the formation of an Inverse Head and Shoulders!
Price has made it back to the "Neckline" or Resistance @.9138, that has been holding price down and helping form the pattern which is not completed!
If price is successful in making a Breakout of the Neckline, this will generate Long Opportunities to take from the Neckline up to the next Resistance level!
Falsebreakout

GJ Delivers Valid Breakout After False OneThis week has been nothing but Consolidation for OANDA:GBPJPY but today we finally get a Valid Breakout of the Falling Wedge!
A Falling Wedge consists of price trading between Lower Highs and Lower Lows and can be considered a Continuation or Reversal pattern dependent upon at what level the pattern is forming.
Monday, Bulls attempted to make a Breakout of the Falling Resistance but turned false once price fell right back down into the pattern and tested it as Resistance again and succeeded!
This morning, price has delivered what seems to be a Valid Bearish Breakout of the Falling Support but price seems to be exhausted which means we could be looking for a Retest of the Breakout.
If the Retest of the Breakout is successful, this could generate Short Opportunities to take price further down!
Fundamentally, we see strength come in for JPY with the Prime Minister Sanae Takaichi's election victory.
"Analysts also noted that Takaichi’s policy, which includes tax cuts and more fiscal spending, is expected to boost the economy and lift the stock market, potentially prompting the Bank of Japan to take a more hawkish stance, all factors that could support the yen."
- tradingview.com/news/reuters.com,2026:newsml_L6N3Z60OK:0-yen-extends-gains-after-takaichi-election-victory-us-data-in-focus/

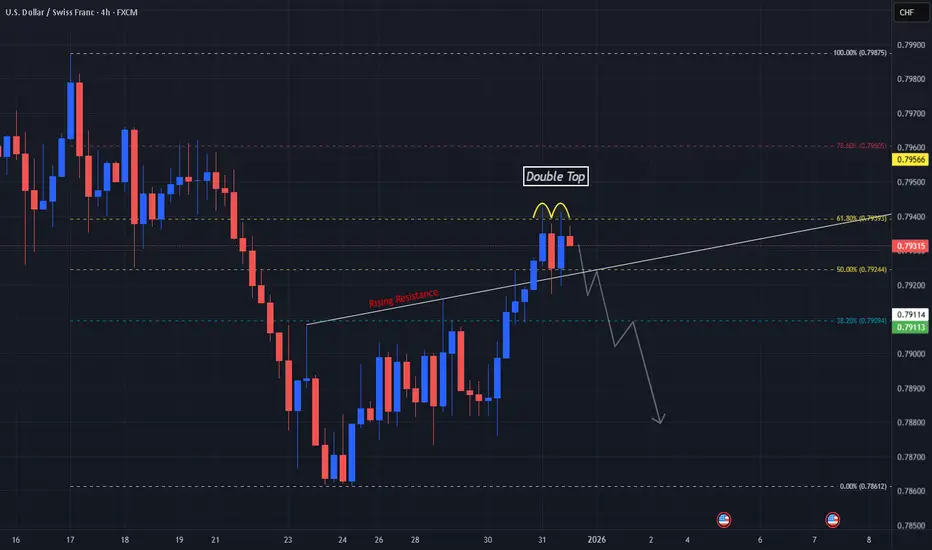
Potential Double Top @ Golden Ratio On USDCHFBefore the New Year, price on OANDA:USDCHF may have formed a strong reversal at a very vital level!
Since the Low @ .78612, price has made a retracement to the High @ .79875 and seems to have found some resistance at the Golden Ratio Level, 61.8% @ .79393.
In prices second attempt to break this level, we see it is again rejected down before markets closed for New Years.
If price breaks back below the 50% level @ .794244 where the Low of the Double Top sits, this will confirm the reversal pattern and generate Short Opportunities!
GJ Bulls Fail To Push Higher After BOE Rate CutAfter price on OANDA:GBPJPY made a 3rd test of a Rising Support, we see price push up to the Previous High but failed to secure a Higher High and made a False Breakout resulting in price being rejected down!
This also comes after the Bank of England made an expected 25 point Interest Rate Cut going from 4% down to 3.75%. Along with CPI for GBP coming down from 3.6% to 3.2%, this all weakens GBP.
Now later tonight, the Bank of Japan is expected to make a 25 point Interest Rate Hike from .5% to .75% and if Cuts weaken currencies, Hikes tend to strengthen.
I believe the False Breakout of the Highs and the intervention of Central Bank decisions will see OANDA:GBPJPY make a plummet down to the Rising Support another time and deliver a Bearish Breakout.

Bitcoin Price History RhymesAs I look at the chart for CRYPTO:BTCUSD on the Weekly timeframe with Ichimoku overlayed the similarities to the 2021-2022 cycle top are eerie. Let's break down what I mean:
The key indicator of Ichimoku is price relative to the Kumo Cloud. A trend on the respective timeframe begins when price is above the cloud. I also use Chickou as momentum for confirmation. This means that the current Bull trend of Bitcoin began officially on the Weekly in November 2023.
The inverse to this rule is when price and momentum are on the opposite side of the cloud. The last Bear trend of Bitcoin began officially on the Weekly in May 2022.
So we can see how close Bitcoin is to true Bearish territory; getting below 80k and staying there for a prolonged time.
The other eerie similarity is the double false breakouts or "Spikes." If you learn ONE price action indicator remember the false breakout! There is no more reliable signal of reversal than when price makes a new high/low and then CLOSES back inside the prior range.
Once again this year as in 2021 there were two such signals weeks apart. It means that the market stopped buying at critical moments where breakouts should have occurred if price were to continue. These false breakouts are past being tradeable now but everyone should take note of just how frequent and reliable these instances are.

Somebody Order A EG Pennant Sandwich?!Here on the Hourly Chart for OANDA:EURGBP we can see price has made quite a Consolidation.
Since Thursday last week we can see price has been pinballing back and forth between a Horizontal Resistance @ .8748 - .8754 and Support @ .8724 - .8721
Currently price has been working into Lower Highs and Higher Lows forming a Pennant Pattern right in the middle of this Consolidation.
Once price breaks either the Falling Resistance or Rising Support, this will generate a Breakout and Retest opportunity!
Then prices next move will be to either the Overhead Resistance or Underlying Support!

EJ Bulls Break 4Hr PennantHere on OANDA:EURJPY price has formed a Pennant Pattern!
Pennants can break either Bullish or Bearish but today Bulls gave us a Breakout of the Falling Resistance.
This could generate Long Opportunities on the pair as a Breakout and Retest scenario!
If price is successfully rejected out of the pattern, we can expect price to make a retest of that break to then push price higher!

EU's Consolidation ExpandsHere on FX:EURUSD we can see that Price has been trading between a Rising Resistance and Falling Support or Higher Highs and Lower Lows.
This forms an Expanding Range!
Currently the range is between:
- High: 1.16232
- Low: 1.15912
Until we get a clear cut Breakout of either leg, this Price Action will remain in a battle of Tug-O-War between Bears and Bulls.
*The Breakout will need to be accompanied by a large amount of volume to verify!
Fundamentally, both EUR and USD have impactful news coming out this week with the ECB recently stating they could be at the end of their easing cycle with cuts and the Federal Reserve looking at an 87% chance of another Interest Rate Cut at the Dec. 10th meeting.
Stay vigilant!

"Heads Down" With Hopes Up For EUFX:EURUSD seems to have found Support at a Weekly Low formed earlier this month.
Now, since having visited this Support, you can notice that price has begun to form a Higher Low suggesting that price action is forming a strong bullish reversal pattern, the Inverse Head and Shoulders!
If price can continue pushing higher to the Neckline once more, this will complete the reversal pattern.
Once the pattern is complete, we will want to wait for a Breakout and Retest to generate potential long opportunities to take the price up to test the overhead resistance levels.

How to PCCE+FBD – Decoding Expansion/Exhaustion & Reversal zones🧭 PCCE + False Breakout Detector – Decoding Expansion, Exhaustion & Reversal Zones
How It Worked on the Chart
In this BTC/USDT 15-minute chart, the indicator detected several Price Coil Compression & Expansion (PCCE ) phases and confirmed false breakouts with visual clarity:
• Green vertical zones represent bullish expansion bursts — price coils tightly, then breaks upward with volume confirmation.
→ These often appear after sideways congestion, signaling early trend ignition.
• Red vertical zones mark b earish expansion bursts — price expands downward after compression, usually following distribution-like setups.
→ Notice how each burst frequently aligns with a decisive trend move.
• The “Burst↑ / Burst↓” labels highlight valid expansions confirmed by momentum and volume thrust conditions, showing continuation opportunities.
However, the true power lies in the False Breakout Detection System — the small “X”-shaped bullish (green) or bearish (red) crosses that appear at potential exhaustion points.
🔍 Interpreting the False Breakout Marks
The bullish “X” and bearish “X” crosses represent trap zones or deceptive breakouts that failed to sustain momentum beyond the coil’s boundary.
• Bearish X (Red) : Price attempted to break higher but was rejected, often marking a short-term top.
→ Can be used as a signal to exit long trades or prepare for short entries once confirmation candle closes below.
• Bullish X (Green) : Price dipped below the compression base but quickly re-entered, showing rejection of lower prices.
→ Indicates a failed breakdown, usable as an early long setup or exit from short positions.
🎯 How Traders Can Use It
1. For Entry Confirmation:
• Wait for a Burst↑ or Burst↓ label after a compression phase.
• Enter in the direction of the expansion, confirming with volume or candle momentum.
2. For Exit or Reversal Spotting:
• Use the False Breakout crosses as smart exit markers.
→ If you are long and a red “X” appears near the top, consider partial profit or tighten stops.
→ If short and a green “X” appears near the bottom, expect possible short covering.
3. For Reversal Trading:
• Combine “Burst” direction with the opposite false breakout mark.
Example: After a Burst↓ (bearish move), if a bullish X appears, it suggests exhaustion — a reversal or pullback may begin
💡 Practical Takeaway
The PCCE + False Breakout Detector effectively blends volatility compression theory with trap pattern logic, letting traders:
• Spot pre-move compression zones ,
• Identify false breakouts and momentum traps , and
• Time exits or reversals with visual precision.
This makes it a dual-purpose tool — both a trend-continuation detector and a reversal warning system — ideal for intraday and swing traders across all markets.

ETHEREUM → False breakout of 4100. Panic?BINANCE:ETHUSDT is forming a false breakout of resistance on the daily chart, formed by the ATH of the previous bullish cycle - 4100. Closing below this level could cause panic in the market...
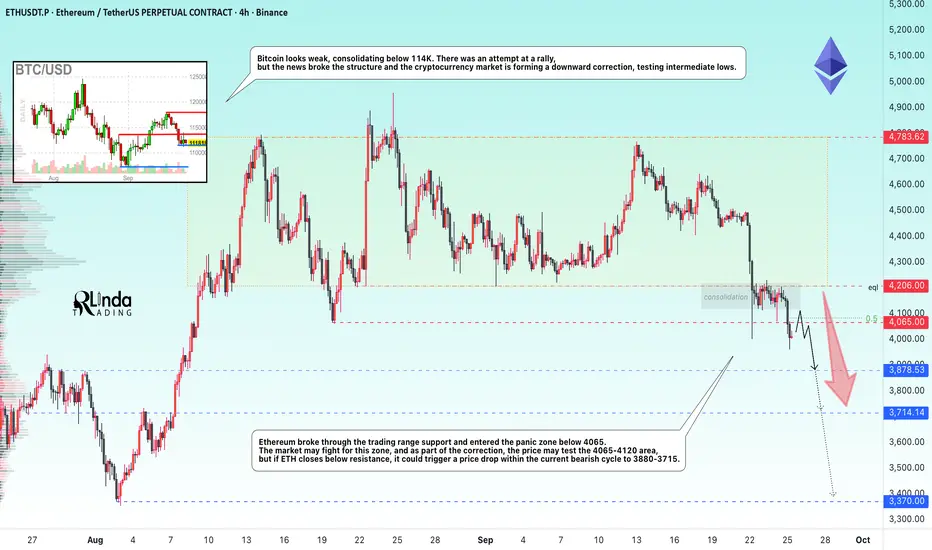
Bitcoin looks weak, consolidating below 114K. There was an attempt at a rally, but the news broke the structure and the cryptocurrency market is forming a downward correction, testing intermediate lows.
Ethereum broke the support of the trading range and entered the panic zone - below 4065. The market may fight for this zone, and as part of the correction, the price may test the 4065-4120 area, but if ETH closes below resistance, it could trigger a price drop within the current bearish cycle to 3880-3715.
Resistance levels: 4065, 4120, 4206
Support levels: 3880: 3715, 3370
On D1, the structure is weak, the price breaks through 4100-4090 and consolidates in the sales zone. Everyone who bought above 4100 can now start active sales due to the activation of stop orders, panic, fear, and the reversal of their positions. If the market does not receive support (bullish driver), the correction may continue. The nearest target is 3878 - 3715 7 3400
Sincerely, R. Linda!
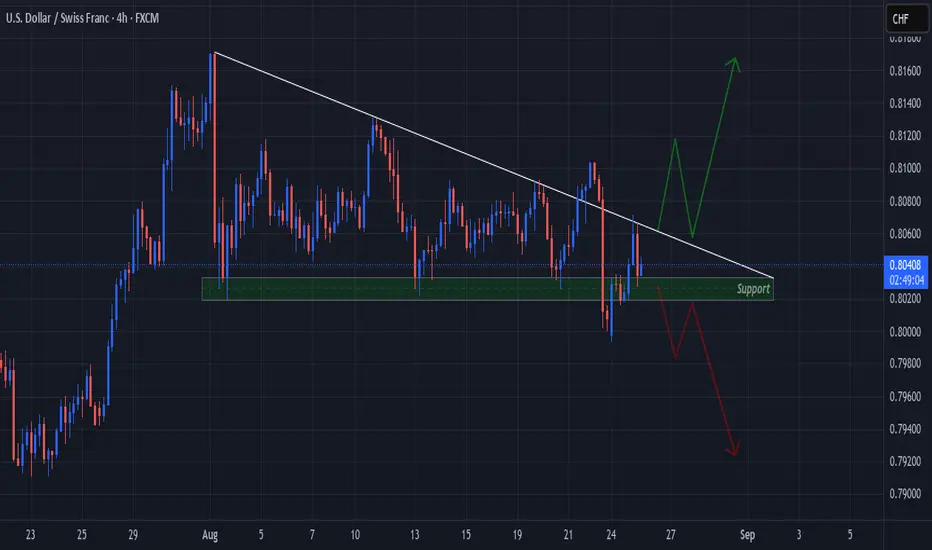
USDCHF "Descends" Into Multiple False Breakouts of the Triangle!Price on OANDA:USDCHF has been falling in a Descending Triangle Pattern shown here on the 4Hr Chart.
Price ending last week created 2 False Breakouts of both the Falling Resistance and Horizontal Support!
Price soon will be looking to make a Breakout with it consolidating tighter into the Apex of the Triangle.
Once a Breakout is validated, we will want to see a Retest!
Battle Of Wicks Confirms Pennant On EJ, Which Leg Will Break?!Here on OANDA:EURJPY we can see Price has been volleyed back and forth between a Falling Resistance and Rising Support at similar degrees forming a Pennant Pattern!
Currently we can see the Consolidation is getting tight and likely to breakout soon, the question is which leg will break?!
Fundamentally EUR and JPY have news events littered throughout this week that will give us some good insight into both currencies corresponding economies, like Tokyo Core CPI y/y on Thursday, Aug. 28th with a Bearish forecast of 2.6%, down from 2.9%!
For now, we must wait for Price to give us a Breakout and Retest!

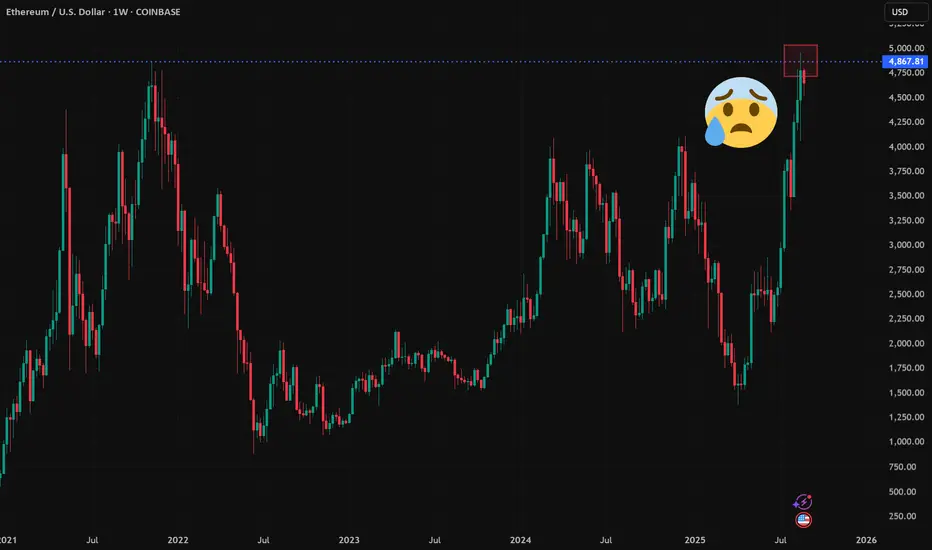
Uh Oh... False Breakouts on both Bitcoin and EthereumWith the close of last week's candlestick COINBASE:ETHUSD failed to sustain its new All Time High (ATH). Last week's price action was interesting because the prior major high at 4070 was solidly broken, retested, and price moved on to make a new ATH.
This price action follows Bitcoin COINBASE:BTCUSD last week which also had the same phenomenon; a new ATH that was quickly rejected.
There is no more reliable sign of a bearish pullback about to occur than a false breakout. In order for new ATH to be sustained traders and investors must keep buying. If they do not... WATCH OUT!
Prior history of the event can be consulted to see just how reliable it can be:
January 2025 Bitcoin
March 2024 Bitcoin
And of course November 2021... the start of the last bear cycle in Bitcoin.
Trade wisely!
USDCAD - price increase after correction. Bullish trendA reversal pattern is forming, indicating the emergence of limit resistance from bears. The pattern structure has been broken, and the price has entered the realization phase. As part of a downward rally, USDCAD may test 0.5 Fibonacci and return to the bullish trend.
Scenario: The current aggressive decline may be halted by a strong support zone, which has several confirmations. A false breakdown and consolidation above 1.3831 - 1.3835 will confirm the bullish sentiment and may return the price to retest the resistance at 1.3879.

EJ Bears Breakout Of The BoxOANDA:EURJPY has been consolidating pretty tightly between Resistance and Support creating a Rectangle Pattern where Price has currently broken out to the downside!
If Price makes a Retest of the Breakout and is successfully rejected, this could deliver some potential Short Opportunities!!
After a Retest, Price has a couple Support Areas it could visit:
TP1 @ 171.515
TP2 @ 170.975

DXY Consolidates SidewaysTVC:DXY continues to consolidate and be held between a Resistance and Support Between:
Resistance @ 98.2 - 98.3
Support @ 97.75 - 97.6
If TVC:DXY breaks the Local Resistance, this will see the USD gain strength temporarily til the Next Resistance Level @ 98.5 - 98.95
If TVC:DXY breaks the Local Support, this will see the USD lose strength temporarily til the Next Support Level @ 97.3 - 97.1
Fundamentally, Tariffs will continue to effect the underlying inflation issue USD deals with along with expectations gaining of not only 1 but a few Interest Cuts could come from the Federal Reserve before the end of the year! This could severely weaken USD!

False breakoutPrice just hit a major resistance trendline and it couldn't break it out. Also is overbought with RSI 76. It can try again to go higher but I don't think is going to break the trendline any time soon. TP in the 485 zone SL is it breaks up with a weekly candle and closes above the trendline.

UCAD Bears Ready to Break 2 Month Long Falling Support??OANDA:USDCAD has been supported by a Falling Support Trend line since August 14th and here soon Price could potentially give us a Bearish Break to that Trend line!
Once a Breakout is validated, we could look for a Retest Set-Up for some Short Opportunities to take Price down to the Support Zone created by the August and September 2024 Lows.
An interesting fact to point out is if you observe the reaction of Price when it tests the Falling Support, we can see Price arc and the following reactions arc smaller, suggesting Bulls are losing strength on the push off of the Falling Support!
Price Action is being heavily driven by Fundamentals in the markets this week:
-USD-
ADP Non-Farm Employment - Previous 60K / Forecast 111K / Actual 37K
ISM Services PMI - Previous 51.6 / Forecast 52 / Actual 49.9
ISM Manufacturing PMI - Previous 48.7 / Forecast 49.3 / Actual 48.5
ISM Manufacturing Prices - Previous 69.8 / Forecast 70.2 / Actual 48.5
Unemployment Claims - Previous 239K / Forecast 236K / Actual 247K
*Average Hourly Earnings, Non-Farm Employment and Unemployment Rate are to be released tomorrow
-CAD-
BOC held Interest Rates @ 2.75%
Ivey PMI - Previous 47.9 / Forecast 48.3 / Actual 48.9
*Employment Change and Unemployment are to be released tomorrow
With BOC holding Interest Rates and the Federal Reserve possibly looking to cut rates because of a "softening labor market", this could fuel CAD to overcome the pair and put Bears in control to pull Prices lower!
www.tradingview.com

NZDUSD - growth ended with a false breakout NZDUSD makes a false breakout of resistance after strong growth in the Asian session. The dollar is correcting a bit before the news at this time, which may give a chance for the currency pair to correct
Scenario: Strong growth of 2.3% is tempered by a false breakout. The price is not ready to continue rising. Consolidation of the price below 0.60200 may intensify the sell-off and trigger a correction to the support at 0.5969 (0.5)

AU Bulls Make A Break For Higher Prices! Time To Long??OANDA:AUDUSD has practically been caught in an Ascending Channel for most of this year but that might not be for "Long"!
A few key things to point out:
- Early April delivered a False Breakout where Price reached the Previous 5 Year Low @ .5980 and was immediately sent back up into the Channel! (Liquidity Sweep??)
- Most of the Price Action that's occurred in this range has been contained to the Upper Chamber of the Channel between the Rising Resistance and Linear Regression.
- Price Consolidated tightly into a Pennant Pattern underneath the Rising Resistance for the past few weeks before delivering a Bullish Break just earlier this evening.
If Bulls are able to sustain Price outside the Channel, this could generate potential Long Opportunities on the Retest of the Break of the Ascending Channel!
Once a Breakout is validated and Retest is successful, the Price Target would be the Next Swing High @ .66875 where Bears were able to push Price down last.
Fundamentally, RBA will be releasing CPI y/y numbers on Tuesday, May 27th with analysts forecasting a .1% Decrease in Inflation from 2.4% to 2.3% after last week having made a 25 basis point rate cut from 4.1% to 3.85%.

GBPUSD may correct after false breakout The currency pair has overcome a huge 0.8% or 110 points since the opening of the session, having wasted all the potential and is trying to test the resistance. The potential for breakout and continuation of growth may not be enough and the price may make a false breakout and correction before the second impulse to the intermediate high, where the scenario with correction may be repeated
Scenario: Breakout of 1.3402. No possibility to continue growth, return under the level and consolidation below the level - further sales.
It is possible that the price will consolidate above 1.34 and will head towards the far, strong level of 1.34425 from which a false breakout and correction can also be considered.

GOLD consolidated below a key level on FridayGold is in a downtrend forming a counter-trend correction. Friday's trading session closes below the key level of 3203-3205. Buyers are weaker than sellers.
But, before the continuation of the fall MM is quite likely to test the resistance to provoke ordinary buyers before the fall
Scenario: the growth attempt may turn out to be false. A retest of 3203 resistance, a false breakout and price consolidation below 3203 is a sell signal.
Additional scenario: MM trap to provoke buyers to buy. A retest of the far resistance 3230, a false breakout and a price fixing below 3223 could start a decline
